Estimated zip code population in 2022: 24,227 Zip code population in 2010: 24,458 Zip code population in 2000: 25,215
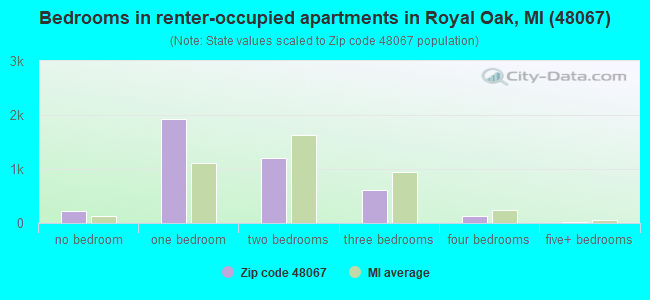
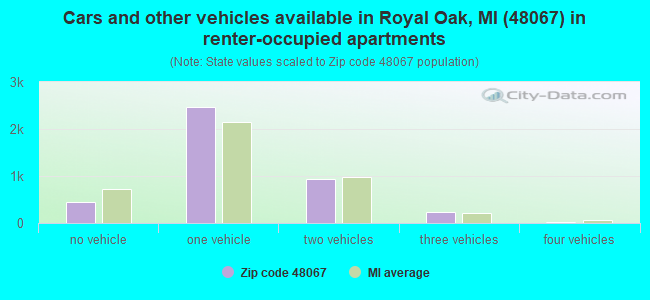
Houses and condos: 13,653 Renter-occupied apartments: 4,099
% of renters here:
32%
State:
27%
March 2022 cost of living index in zip code 48067: 97.3 (near average, U.S. average is 100)
Land area: 4.6 sq. mi. Water area: 0.0 sq. mi.
Population density: 5,278 people per square mile
(average).
OSM Map
General Map
Google Map
MSN Map
OSM Map
General Map
Google Map
MSN Map
OSM Map
General Map
Google Map
MSN Map
OSM Map
General Map
Google Map
MSN Map
Please wait while loading the map...
Real estate property taxes paid for housing units in 2022:
This zip code:
1.2% ($4,002)
Michigan:
1.2% ($2,746)
Median real estate property taxes paid for housing units with mortgages in 2022: $4,347 (1.3%) Median real estate property taxes paid for housing units with no mortgage in 2022: $3,373 (1.1%)
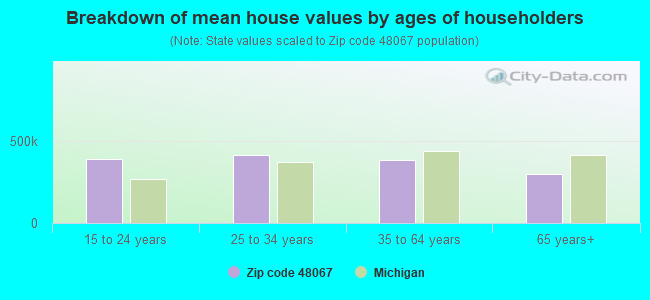
Estimated median house/condo value in 2022: $327,171
48067:
$327,171
Michigan:
$224,400
According to our research of Michigan and other state lists, there were 16 registered sex offenders living in 48067 zip code as of April 27, 2024. The ratio of all residents to sex offenders in zip code 48067 is 1,586 to 1. The ratio of registered sex offenders to all residents in this zip code is much lower than the state average.
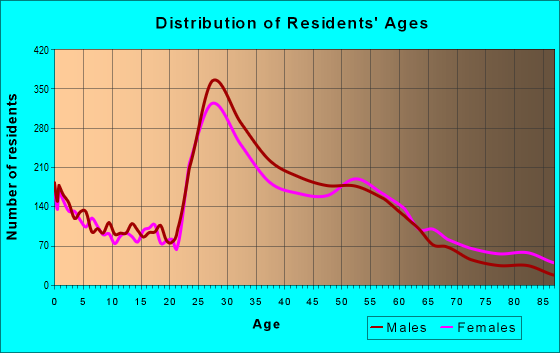
Median resident age:
This zip code:
35.7 years
Michigan median age:
40.3 years
Average household size:
This zip code:
1.9 people
Michigan:
2.4 people
Averages for the 2020 tax year for zip code 48067, filed in 2021:
Average Adjusted Gross Income (AGI) in 2020: $100,707 (Individual Income Tax Returns)
Here:
$100,707
State:
$68,945
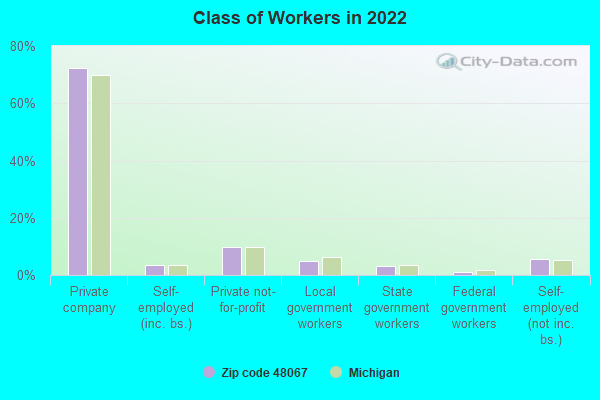
Salary/wage: $91,944 (reported on 84.2% of returns)
Here:
$91,944
State:
$57,142
(% of AGI for various income ranges: 996.5% for AGIs below $25k, 3675.1% for AGIs $25k-50k, 6820.8% for AGIs $50k-75k, 10310.9% for AGIs $75k-100k, 19473.9% for AGIs $100k-200k, 76539.8% for AGIs over 200k)
Taxable interest for individuals: $958 (reported on 41.2% of returns)
This zip code:
$958
Michigan:
$1,630
(% of AGI for various income ranges: 19.4% for AGIs below $25k, 18.9% for AGIs $25k-50k, 18.9% for AGIs $50k-75k, 44.3% for AGIs $75k-100k, 69.0% for AGIs $100k-200k, 537.7% for AGIs over 200k)
Ordinary dividends: $4,388 (reported on 33.5% of returns)
Here:
$4,388
State:
$6,972
(% of AGI for various income ranges: 65.6% for AGIs below $25k, 53.6% for AGIs $25k-50k, 75.5% for AGIs $50k-75k, 135.9% for AGIs $75k-100k, 229.6% for AGIs $100k-200k, 2255.0% for AGIs over 200k)
Net capital gain/loss in AGI: +$14,866 (reported on 31.0% of returns)
Here:
+$14,866
State:
+$20,064
(% of AGI for various income ranges: 27.5% for AGIs below $25k, 55.5% for AGIs $25k-50k, 74.4% for AGIs $50k-75k, 175.1% for AGIs $75k-100k, 448.8% for AGIs $100k-200k, 10424.8% for AGIs over 200k)
Profit/loss from business: +$18,817 (reported on 16.1% of returns)
Here:
+$18,817
State:
+$11,172
(% of AGI for various income ranges: 144.6% for AGIs below $25k, 173.8% for AGIs $25k-50k, 240.3% for AGIs $50k-75k, 253.4% for AGIs $75k-100k, 537.2% for AGIs $100k-200k, 3909.2% for AGIs over 200k)
Taxable individual retirement arrangement distribution: $17,636 (reported on 8.7% of returns)
48067:
$17,636
Michigan:
$19,803
(% of AGI for various income ranges: 104.1% for AGIs below $25k, 117.1% for AGIs $25k-50k, 162.8% for AGIs $50k-75k, 223.1% for AGIs $75k-100k, 376.3% for AGIs $100k-200k, 938.1% for AGIs over 200k)
Self-employed (Keogh) retirement plans: $25,181 (reported on 1.2% of returns)
48067:
$25,181
Michigan:
$25,132
(% of AGI for various income ranges: 26.3% for AGIs $50k-75k, 38.2% for AGIs $100k-200k, 599.2% for AGIs over 200k)
Total itemized deductions: $23,736 (reported on 15.8% of returns)
Here:
$23,736
State:
$34,117
(% of AGI for various income ranges: 76.9% for AGIs below $25k, 136.1% for AGIs $25k-50k, 287.8% for AGIs $50k-75k, 508.9% for AGIs $75k-100k, 930.9% for AGIs $100k-200k, 3941.7% for AGIs over 200k)
Charity contributions: $5,494 (reported on 11.3% of returns)
Here:
$5,494
State:
$13,548
(% of AGI for various income ranges: 2.0% for AGIs below $25k, 11.1% for AGIs $25k-50k, 30.0% for AGIs $50k-75k, 45.4% for AGIs $75k-100k, 111.5% for AGIs $100k-200k, 1065.2% for AGIs over 200k)
Taxes paid: $8,567 (reported on 15.7% of returns)
48067:
$8,567
State:
$7,972
(% of AGI for various income ranges: 14.9% for AGIs below $25k, 34.3% for AGIs $25k-50k, 111.6% for AGIs $50k-75k, 227.0% for AGIs $75k-100k, 390.6% for AGIs $100k-200k, 1142.3% for AGIs over 200k)
Earned income credit: $1,241 (reported on 4.6% of returns)
Here:
$1,241
State:
$2,251
(% of AGI for various income ranges: 27.9% for AGIs below $25k, 19.0% for AGIs $25k-50k)
Percentage of individuals using paid preparers for their 2020 taxes: 93.7%
Here:
94%
State:
93%
(% for various income ranges: 90.1% for AGIs below $25k, 93.6% for AGIs $25k-50k, 94.8% for AGIs $50k-75k, 94.9% for AGIs $75k-100k, 95.1% for AGIs $100k-200k, 94.8% for AGIs over 200k)
Averages for the 2012 tax year for zip code 48067, filed in 2013:
Average Adjusted Gross Income (AGI) in 2012: $70,561 (Individual Income Tax Returns)
Here:
$70,561
State:
$55,609
Salary/wage: $63,444 (reported on 85.7% of returns)
Here:
$63,444
State:
$46,782
(% of AGI for various income ranges: 68.7% for AGIs below $25k, 82.9% for AGIs $25k-50k, 85.8% for AGIs $50k-75k, 86.8% for AGIs $75k-100k, 86.0% for AGIs $100k-200k, 55.2% for AGIs over 200k)
Taxable interest for individuals: $864 (reported on 38.9% of returns)
This zip code:
$864
Michigan:
$1,491
(% of AGI for various income ranges: 1.0% for AGIs below $25k, 0.5% for AGIs $25k-50k, 0.4% for AGIs $50k-75k, 0.4% for AGIs $75k-100k, 0.4% for AGIs $100k-200k, 0.5% for AGIs over 200k)
Ordinary dividends: $3,432 (reported on 26.6% of returns)
Here:
$3,432
State:
$6,225
(% of AGI for various income ranges: 2.2% for AGIs below $25k, 1.1% for AGIs $25k-50k, 0.9% for AGIs $50k-75k, 0.8% for AGIs $75k-100k, 1.1% for AGIs $100k-200k, 1.9% for AGIs over 200k)
Net capital gain/loss in AGI: +$5,010 (reported on 20.9% of returns)
Here:
+$5,010
State:
+$9,326
(% of AGI for various income ranges: 0.1% for AGIs $25k-50k, 0.2% for AGIs $50k-75k, 0.3% for AGIs $75k-100k, 0.7% for AGIs $100k-200k, 4.8% for AGIs over 200k)
Profit/loss from business: +$18,632 (reported on 15.4% of returns)
Here:
+$18,632
State:
+$11,523
(% of AGI for various income ranges: 8.2% for AGIs below $25k, 4.6% for AGIs $25k-50k, 2.5% for AGIs $50k-75k, 2.6% for AGIs $75k-100k, 2.8% for AGIs $100k-200k, 6.2% for AGIs over 200k)
Taxable individual retirement arrangement distribution: $13,278 (reported on 9.2% of returns)
48067:
$13,278
Michigan:
$15,298
(% of AGI for various income ranges: 3.9% for AGIs below $25k, 2.1% for AGIs $25k-50k, 1.8% for AGIs $50k-75k, 1.4% for AGIs $75k-100k, 2.1% for AGIs $100k-200k, 0.9% for AGIs over 200k)
Self-employment retirement plans: $12,292 (reported on 0.9% of returns)
48067:
$12,292
Michigan:
$20,834
(% of AGI for various income ranges: 0.3% for AGIs below $25k, 0.2% for AGIs $50k-75k, 0.2% for AGIs $100k-200k, 0.3% for AGIs over 200k)
Total itemized deductions: $18,705 (16% of AGI, reported on 41.7% of returns)
Here:
$18,705
State:
$21,628
Here:
15.9% of AGI
State:
18.4% of AGI
(% of AGI for various income ranges: 11.6% for AGIs below $25k, 9.4% for AGIs $25k-50k, 10.8% for AGIs $50k-75k, 12.3% for AGIs $75k-100k, 13.2% for AGIs $100k-200k, 9.0% for AGIs over 200k)
Charity contributions: $2,341 (reported on 34.5% of returns)
Here:
$2,341
State:
$4,225
(% of AGI for various income ranges: 0.7% for AGIs below $25k, 0.8% for AGIs $25k-50k, 1.0% for AGIs $50k-75k, 1.3% for AGIs $75k-100k, 1.4% for AGIs $100k-200k, 1.1% for AGIs over 200k)
Taxes paid: $8,297 (reported on 41.5% of returns)
48067:
$8,297
State:
$8,327
(% of AGI for various income ranges: 2.8% for AGIs below $25k, 3.1% for AGIs $25k-50k, 4.0% for AGIs $50k-75k, 5.0% for AGIs $75k-100k, 6.1% for AGIs $100k-200k, 5.3% for AGIs over 200k)
Earned income credit: $1,330 (reported on 7.4% of returns)
Here:
$1,330
State:
$2,306
(% of AGI for various income ranges: 2.1% for AGIs below $25k, 0.3% for AGIs $25k-50k)
Percentage of individuals using paid preparers for their 2012 taxes: 49.3%
Here:
49%
State:
57%
(% for various income ranges: 45.3% for AGIs below $25k, 46.5% for AGIs $25k-50k, 48.0% for AGIs $50k-75k, 50.9% for AGIs $75k-100k, 54.8% for AGIs $100k-200k, 75.5% for AGIs over 200k)
Averages for the 2004 tax year for zip code 48067, filed in 2005:
Average Adjusted Gross Income (AGI) in 2004: $52,654 (Individual Income Tax Returns)
Here:
$52,654
State:
$48,204
Salary/wage: $50,912 (reported on 86.4% of returns)
Here:
$50,912
State:
$42,791
(% of AGI for various income ranges: 101.0% for AGIs below $10k, 70.8% for AGIs $10k-25k, 85.7% for AGIs $25k-50k, 89.9% for AGIs $50k-75k, 90.5% for AGIs $75k-100k, 76.3% for AGIs over 100k)
Taxable interest for individuals: $1,137 (reported on 53.3% of returns)
This zip code:
$1,137
Michigan:
$1,725
(% of AGI for various income ranges: 7.6% for AGIs below $10k, 2.8% for AGIs $10k-25k, 1.0% for AGIs $25k-50k, 0.7% for AGIs $50k-75k, 1.0% for AGIs $75k-100k, 1.2% for AGIs over 100k)
Taxable dividends: $1,961 (reported on 30.4% of returns)
Here:
$1,961
State:
$3,420
(% of AGI for various income ranges: 4.3% for AGIs below $10k, 1.9% for AGIs $10k-25k, 0.9% for AGIs $25k-50k, 0.7% for AGIs $50k-75k, 0.8% for AGIs $75k-100k, 1.5% for AGIs over 100k)
Net capital gain/loss: +$5,514 (reported on 23.4% of returns)
Here:
+$5,514
State:
+$8,532
(% of AGI for various income ranges: -3.4% for AGIs below $10k, 0.2% for AGIs $10k-25k, 0.1% for AGIs $25k-50k, 0.4% for AGIs $50k-75k, 0.6% for AGIs $75k-100k, 6.5% for AGIs over 100k)
Profit/loss from business: +$12,952 (reported on 13.8% of returns)
Here:
+$12,952
State:
+$9,547
(% of AGI for various income ranges: 12.1% for AGIs below $10k, 7.2% for AGIs $10k-25k, 3.2% for AGIs $25k-50k, 2.4% for AGIs $50k-75k, 1.6% for AGIs $75k-100k, 4.2% for AGIs over 100k)
IRA payment deduction: $2,740 (reported on 2.4% of returns)
48067:
$2,740
Michigan:
$2,875
(% of AGI for various income ranges: 0.4% for AGIs below $10k, 0.3% for AGIs $10k-25k, 0.2% for AGIs $25k-50k, 0.1% for AGIs $50k-75k, 0.1% for AGIs $75k-100k, 0.1% for AGIs over 100k)
Self-employed pension: $9,397 (reported on 0.9% of returns)
Here:
$9,397
Michigan:
$13,826
(% of AGI for various income ranges: 0.1% for AGIs $10k-25k, 0.1% for AGIs $25k-50k, 0.1% for AGIs $50k-75k, 0.1% for AGIs $75k-100k, 0.3% for AGIs over 100k)
Total itemized deductions: $16,162 (20% of AGI, reported on 47.2% of returns)
Here:
$16,162
State:
$18,509
Here:
19.8% of AGI
State:
20.7% of AGI
(% of AGI for various income ranges: 26.3% for AGIs below $10k, 12.0% for AGIs $10k-25k, 13.1% for AGIs $25k-50k, 16.4% for AGIs $50k-75k, 16.5% for AGIs $75k-100k, 13.0% for AGIs over 100k)
Charity contributions deductions: $2,042 (2% of AGI, reported on 42.3% of returns)
Here:
$2,042
State:
$3,365
Here:
2.4% of AGI
State:
3.6% of AGI
(% of AGI for various income ranges: 1.1% for AGIs below $10k, 1.0% for AGIs $10k-25k, 1.2% for AGIs $25k-50k, 1.7% for AGIs $50k-75k, 1.8% for AGIs $75k-100k, 1.8% for AGIs over 100k)
Total tax: $8,129 (reported on 84.6% of returns)
48067:
$8,129
State:
$7,691
(% of AGI for various income ranges: 3.9% for AGIs below $10k, 5.3% for AGIs $10k-25k, 9.1% for AGIs $25k-50k, 11.3% for AGIs $50k-75k, 11.9% for AGIs $75k-100k, 18.4% for AGIs over 100k)
Earned income credit: $1,065 (reported on 5.7% of returns)
Here:
$1,065
State:
$1,737
Percentage of individuals using paid preparers for their 2004 taxes: 52.0%
Here:
52%
State:
60%
(% for various income ranges: 48.6% for AGIs below $10k, 53.4% for AGIs $10k-25k, 50.5% for AGIs $25k-50k, 52.1% for AGIs $50k-75k, 52.3% for AGIs $75k-100k, 58.4% for AGIs over 100k)
Likely homosexual households (counted as self-reported same-sex unmarried-partner households)
Lesbian couples: 0.2% of all households
Gay men: 0.3% of all households
Household received Food Stamps/SNAP in the past 12 months: 563 Household did not receive Food Stamps/SNAP in the past 12 months: 12,182
Women who had a birth in the past 12 months: 282 (289 now married, 0 unmarried) Women who did not have a birth in the past 12 months: 6,243 (2,360 now married, 3,885 unmarried)
Housing units in zip code 48067 with a mortgage: 6,108 (511 second mortgage, 12 home equity loan, 453 both second mortgage and home equity loan) Houses without a mortgage: 99
Median monthly owner costs for units with a mortgage: $1,746 Median monthly owner costs for units without a mortgage: $620
Residents with income below the poverty level in 2022:
This zip code:
6.6%
Whole state:
13.4%
Residents with income below 50% of the poverty level in 2022:
This zip code:
2.7%
Whole state:
6.9%
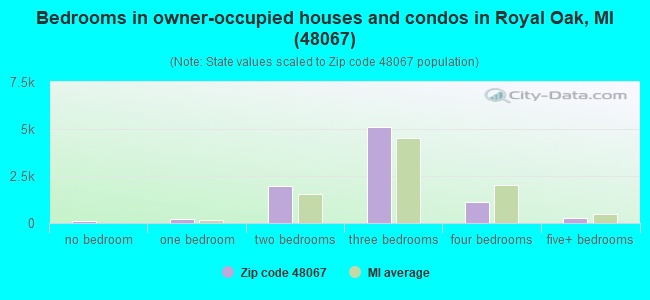
Median number of rooms in houses and condos:
Here:
6.2
State:
6.5
Median number of rooms in apartments:
Here:
3.6
State:
4.3
Notable locations in this zip code not listed on our city pages
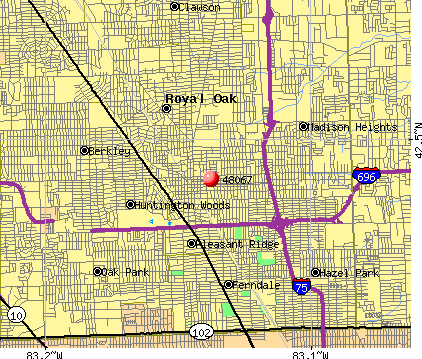
Notable locations in zip code 48067: Royal Oak Station (A), Henry Ford Medical Center - Royal Oak (B), Royal Oak Fire Department Station 1 (C). Display/hide their locations on the map
Parks in zip code 48067 include: Wendtland Park (1), Whittier Park (2), Bassett Park (3), Detroit Zoological Park Historical Marker (4), First Baptist Church of Royal Oak Historical Marker (5), Royal Oak Methodist Episcopal Church Historical Marker (6), Royal Oak Township Cemetery Historical Marker (7), Royal Oak Woman's Club Historical Marker (8), Saint Mary Catholic Cemetery Historical Marker (9). Display/hide their locations on the map
2,513 married couples with children.
451 single-parent households (69 men, 382 women).
90.5% of residents of 48067 zip code speak English at home.
2.2% of residents speak Spanish at home (89% very well, 11% well).
4.7% of residents speak other Indo-European language at home (74% very well, 14% well, 11% not well).
1.5% of residents speak Asian or Pacific Island language at home (94% very well, 2% well, 4% not well).
0.7% of residents speak other language at home (74% very well, 26% well).
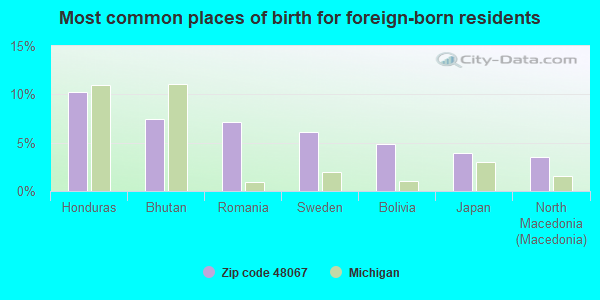
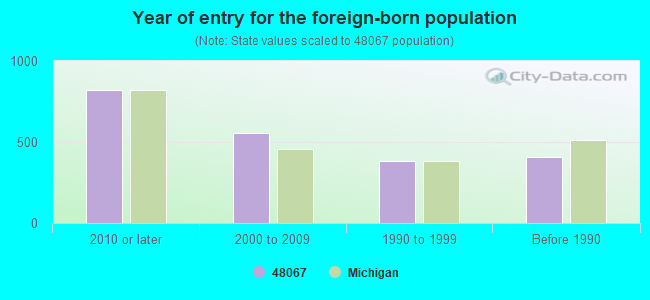
Foreign born population: 1,864 (7.7%) (59.3% of them are naturalized citizens)
Major facilities with environmental interests located in this zip code:
BENJAMIN FRANKLIN ELEM. SCHOOL (1121 MOHAWK AVENUE in ROYAL OAK, MI)
(National Center for Education Statistics) - STATE ID-05105 Organizations: SCHOOL DISTRICT OF THE CITY OF ROYAL OAK (SCHOOL DISTRICT)
GEORGE A. DONDERO HIGH SCHOOL (709 N. WASHINGTON AVENUE in ROYAL OAK, MI)
(National Center for Education Statistics) - STATE ID-00932 Organizations: SCHOOL DISTRICT OF THE CITY OF ROYAL OAK (SCHOOL DISTRICT)
AMOCO OIL CO (28992 WOODWARD in ROYAL OAK, MI)
(Resource Conservation and Recovery Act (tracking hazardous waste)) Organizations: AMOCO OIL COMPANY (CONTACT/OWNER)
AMOCO OIL CO 5391 (102 N MAIN ST in ROYAL OAK, MI)
(Resource Conservation and Recovery Act (tracking hazardous waste)) Organizations: AMOCO OIL COMPANY (CONTACT/OWNER)
BELL PLASTICS (1220 MORSE in ROYAL OAK, MI)
(Resource Conservation and Recovery Act (tracking hazardous waste))
BIG (5025 LEAFDALE in ROYAL OAK, MI)
(Resource Conservation and Recovery Act (tracking hazardous waste)) Organizations: MARK YAMARINO (CONTACT/OWNER)
Alternative names: BIG "Y" AUTOMOTIVE
MGM DRY CLEANERS INC (1407 E 11 MILE RD in ROYAL OAK, MI)
(Resource Conservation and Recovery Act (tracking hazardous waste)) Organizations: SUTHERLAND JAMES M (CONTACT/OPERATOR)
GREAT NORTHERN SERVICES INC (310 N. BLAIR in ROYAL OAK, MI)
(Resource Conservation and Recovery Act (tracking hazardous waste)) Organizations: EDWARD TRUDELL OWNER (CONTACT/OPERATOR)
Alternative names: GREAT NORTHERN WASTE OIL CO
DIAMOND LINCOLN MERCURY BODY SHOP (423 N MAIN in ROYAL OAK, MI)
(Resource Conservation and Recovery Act (tracking hazardous waste)) Organizations: FORD LEASING DEVELOPMENT CO (CONTACT/OWNER)
DOLORES J BARAN DDS (1103 N MAIN STREET in ROYAL OAK, MI)
(Resource Conservation and Recovery Act (tracking hazardous waste)) Business NAICS classification: NONRESIDENTIAL PROPERTY MANAGERS. Organizations: DOLORES J. BARAN DDS (CONTACT/OPERATOR)
ELECTROFORMED PRODUCTS INC (1921 BELLAIRE AVE in ROYAL OAK, MI)
(Resource Conservation and Recovery Act (tracking hazardous waste)) Business NAICS classification: POWER-DRIVEN HANDTOOL MANUFACTURING. Organizations: VECERE WILLIAM T (CONTACT/OWNER)
ENAMELCOTE INC (1825 BELLAIRE in ROYAL OAK, MI)
(Resource Conservation and Recovery Act (tracking hazardous waste)) Organizations: MARTIN ENDRES (CONTACT/OWNER)
Housing units lacking complete plumbing facilities: 0.5% Housing units lacking complete kitchen facilities: 0.9%
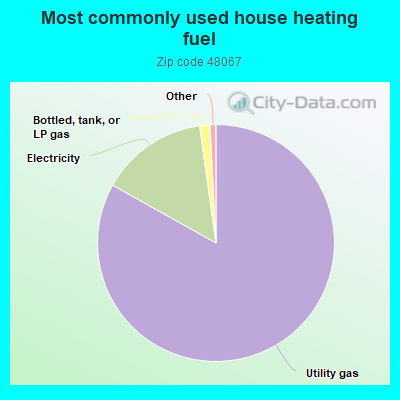
83.2%Utility gas
14.7%Electricity
1.4%Bottled, tank, or LP gas
Population in 1990: 27,820.
Place of birth for U.S.-born residents:
This state: 17,555
Northeast: 1,294
Midwest: 1,464
South: 1,086
West: 702
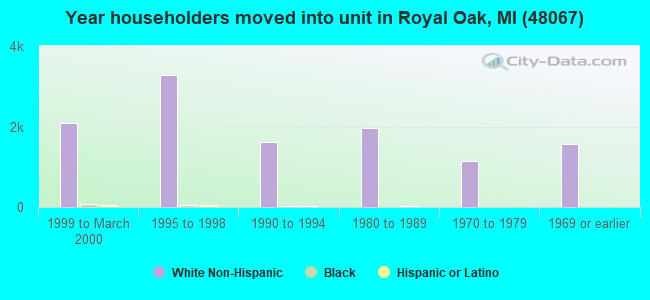
60% of the 48067 zip code residents lived in the same house 5 years ago. Out of people who lived in different houses, 56% lived in this county. Out of people who lived in different counties, 50% lived in Michigan.
86% of the 48067 zip code residents lived in the same house 1 year ago. Out of people who lived in different houses, 52% moved from this county. Out of people who lived in different houses, 33% moved from different county within same state. Out of people who lived in different houses, 12% moved from different state. Out of people who lived in different houses, 1% moved from abroad.
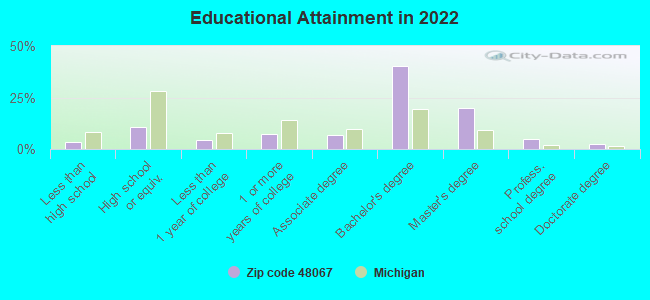
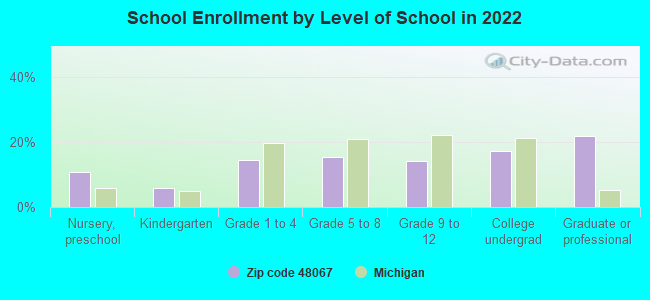
Private vs. public school enrollment:
Students in private schools in grades 1 to 8 (elementary and middle school): 284
Here:
25.4%
Michigan:
12.4%
Students in private schools in grades 9 to 12 (high school): 105
Here:
19.9%
Michigan:
9.8%
Students in private undergraduate colleges: 83
Here:
12.9%
Michigan:
14.9%
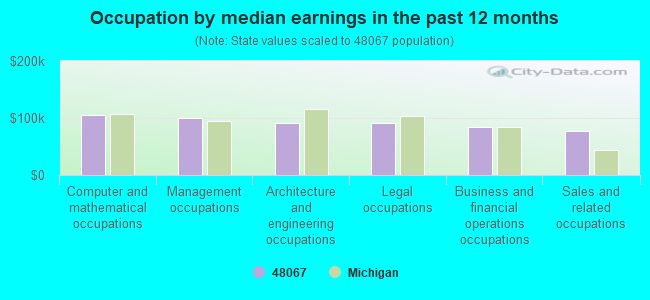
Occupation by median earnings in the past 12 months ($)
105,532Computer and mathematical occupations
100,705Management occupations
91,269Architecture and engineering occupations
90,842Legal occupations
83,443Business and financial operations occupations
76,459Sales and related occupations
Companies with federal contracts located in this zip code:
REALTIME TECHNOLOGIES, INC (1517 N MAIN ST in ROYAL OAK, MI; small business) : $3,739,080 in 23 contractsfrom 2001 to 2006
Contracts for Other Research and Development -- Basic Research (R&D), Defense Tank - Automotive -- Applied Research and Exploratory Development (R&D), Services -- Applied Research and Exploratory Development (R&D), Other Research and Development -- Engineering Development (R&D), and moreby Army, U.S. Army Corps of Engineers - civil program financing only Signed by year:2000: $0; 2001: $115,200; 2002: $669,043; 2003: $903,887; 2004: $861,656; 2005: $510,598; 2006: $678,696.
Biggest contracts:
$373,842 with Army for Other Research and Development -- Basic Research (R&D). Signed on 2004-11-19. Completion date: 2006-11-09.
$369,493 with Army for Defense Tank - Automotive -- Applied Research and Exploratory Development (R&D). Signed on 2004-12-15. Completion date: 2006-12-15.
$360,432 with Army for Other Research and Development -- Basic Research (R&D). Signed on 2002-12-24. Completion date: 2004-12-31.
$355,897 with Army for Services -- Applied Research and Exploratory Development (R&D). Signed on 2006-01-27. Completion date: 2008-01-27.
DOUBLEJACK ELECTRIC COMPANY, I (1221 N CAMPBELL in ROYAL OAK, MI; small business) : $96,223 in 2 contractsfrom 2000 to 2001
$63,370 with Army for Construction of Structures and Facilities -- Other Administrative Facilities and Service Buildings. Signed on 2000-09-29. Completion date: 2000-11-29.
$32,853 with Army for Construction of Structures and Facilities -- Office Buildings. Signed on 2001-05-17. Completion date: 2001-07-27.
ACIERNO, DENISE, DDS (424 WEST FIFTH ST in ROYAL OAK, MI; small business)
$6,750 with Army for Dentistry Services. Signed on 2004-01-14. Completion date: 2004-02-10.
ACCU LAMINATION CO (1215 E LINCOLN AVE in ROYAL OAK, MI; small business)
$6,000 with Army for Miscellaneous Office Machines. Signed on 2005-09-19. Completion date: 2005-11-14.
BILLY BOB S GAMEROOM FURNISHI (2020 BELLAIRE AVE in ROYAL OAK, MI; small business)
$2,804 with Army for Recreational and Gymnastic Equipment. Signed on 2002-09-18. Completion date: 2002-10-01.
CAVANAUGH, JOHN ( in Royal Oak, MI; small business)
$2,500 with National Highway Traffic Safety Administration for Other Quality Control, Testing and Inspection Services -- Ground Effect Vehicles, Motor Vehicles, Trailers, and Cycles. Signed on 2005-07-13. Completion date: 2005-08-31.
Top industries in this zip code by the number of employees in 2005:
2002 - 2018 National Fire Incident Reporting System (NFIRS) incidents
According to the data from the years 2002 - 2018 the average number of fire incidents per year is 50. The highest number of reported fires - 101 took place in 2005, and the least - 1 in 2007. The data has a declining trend.
When looking into fire subcategories, the most incidents belonged to: Structure Fires (47.4%), and Mobile Property/Vehicle Fires (24.9%).
Fire incident types reported to NFIRS in Zip Code 48067
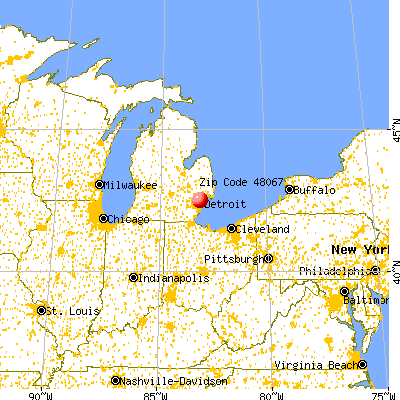


 Nearest zip codes: 48069, 48070, 48220, 48071, 48073, 48017.
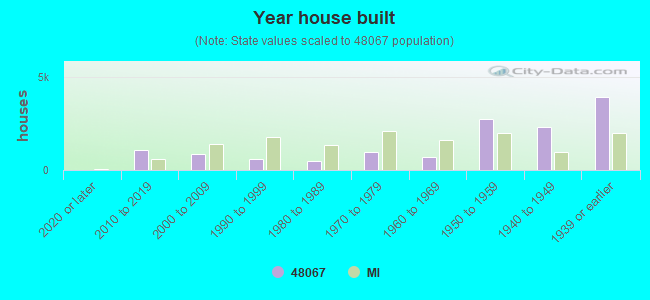


 According to the data from the years 2002 - 2018 the average number of fire incidents per year is 50. The highest number of reported fires - 101 took place in 2005, and the least - 1 in 2007. The data has a declining trend.
 When looking into fire subcategories, the most incidents belonged to: Structure Fires (47.4%), and Mobile Property/Vehicle Fires (24.9%).