Estimated zip code population in 2022: 6,349 Zip code population in 2010: 6,238 Zip code population in 2000: 6,150
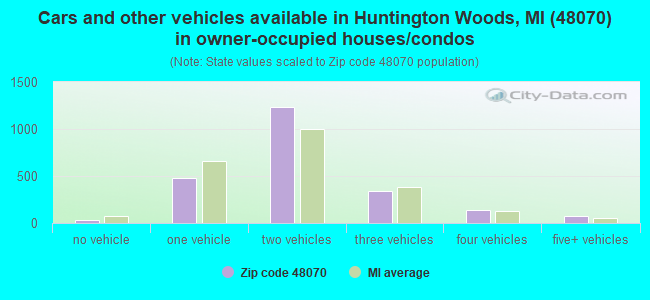
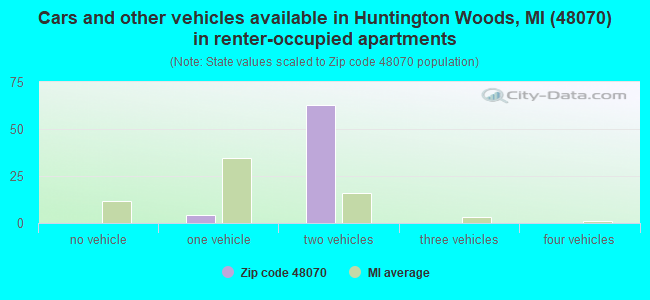
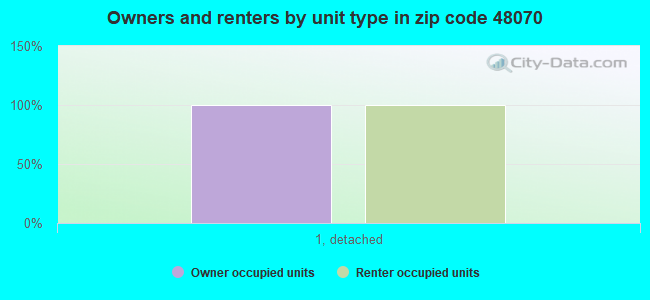
Houses and condos: 2,436 Renter-occupied apartments: 68
% of renters here:
3%
State:
27%
March 2022 cost of living index in zip code 48070: 100.2 (near average, U.S. average is 100)
Land area: 1.5 sq. mi. Water area: 0.0 sq. mi.
Population density: 4,274 people per square mile
(average).
OSM Map
General Map
Google Map
MSN Map
OSM Map
General Map
Google Map
MSN Map
OSM Map
General Map
Google Map
MSN Map
OSM Map
General Map
Google Map
MSN Map
Please wait while loading the map...
Real estate property taxes paid for housing units in 2022:
This zip code:
1.6% ($8,069)
Michigan:
1.2% ($2,746)
Median real estate property taxes paid for housing units with mortgages in 2022: $8,836 (1.7%) Median real estate property taxes paid for housing units with no mortgage in 2022: $6,815 (1.5%)
Business Search- 14 Million verified businesses
Males: 3,234
(50.9%)
Females: 3,115
(49.1%)
For population 25 years and over in 48070:
High school or higher: 101.3%
Bachelor's degree or higher: 83.6%
Graduate or professional degree: 49.0%
Unemployed: 1.4%
Mean travel time to work (commute): 21.2 minutes
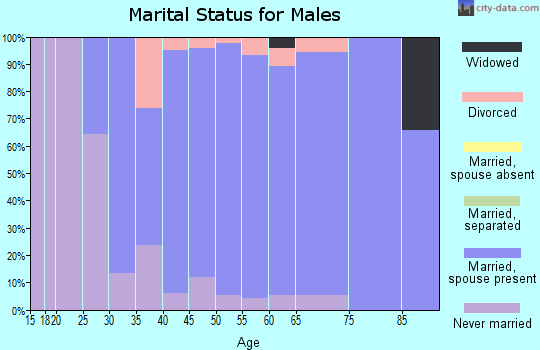
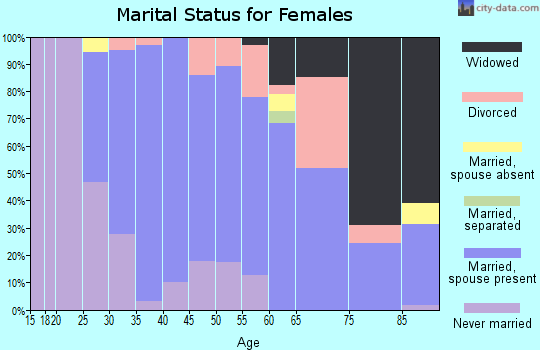
For population 15 years and over in 48070:
Never married: 24.0%
Now married: 66.1%
Separated: 1.5%
Widowed: 2.6%
Divorced: 5.8%
Zip code 48070 compared to state average:
Median household income significantly above state average.
Median house value significantly above state average.
Unemployed percentage significantly below state average.
Black race population percentage significantly below state average.
Hispanic race population percentage below state average.
Foreign-born population percentage below state average.
Renting percentage significantly below state average.
Length of stay since moving in above state average.
Number of rooms per house above state average.
House age above state average.
Percentage of population with a bachelor's degree or higher significantly above state average.
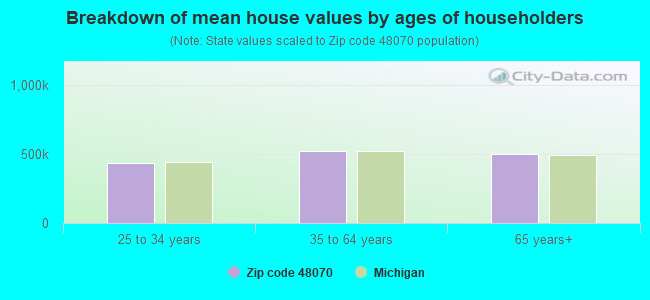
Estimated median house/condo value in 2022: $510,619
48070:
$510,619
Michigan:
$224,400
Median resident age:
This zip code:
43.9 years
Michigan median age:
40.3 years
Average household size:
This zip code:
2.7 people
Michigan:
2.4 people
Averages for the 2020 tax year for zip code 48070, filed in 2021:
Average Adjusted Gross Income (AGI) in 2020: $187,049 (Individual Income Tax Returns)
Here:
$187,049
State:
$68,945
Salary/wage: $134,502 (reported on 76.8% of returns)
Here:
$134,502
State:
$57,142
(% of AGI for various income ranges: 1032.5% for AGIs below $25k, 3760.6% for AGIs $25k-50k, 6051.0% for AGIs $50k-75k, 8757.9% for AGIs $75k-100k, 19034.0% for AGIs $100k-200k, 103379.5% for AGIs over 200k)
Taxable interest for individuals: $3,872 (reported on 55.7% of returns)
This zip code:
$3,872
Michigan:
$1,630
(% of AGI for various income ranges: 37.2% for AGIs below $25k, 105.0% for AGIs $25k-50k, 126.5% for AGIs $50k-75k, 170.7% for AGIs $75k-100k, 190.7% for AGIs $100k-200k, 2559.0% for AGIs over 200k)
Ordinary dividends: $11,315 (reported on 53.8% of returns)
Here:
$11,315
State:
$6,972
(% of AGI for various income ranges: 84.4% for AGIs below $25k, 275.6% for AGIs $25k-50k, 475.0% for AGIs $50k-75k, 636.4% for AGIs $75k-100k, 888.4% for AGIs $100k-200k, 6321.4% for AGIs over 200k)
Net capital gain/loss in AGI: +$39,205 (reported on 50.2% of returns)
Here:
+$39,205
State:
+$20,064
(% of AGI for various income ranges: 75.3% for AGIs below $25k, 173.9% for AGIs $25k-50k, 320.5% for AGIs $50k-75k, 511.4% for AGIs $75k-100k, 989.6% for AGIs $100k-200k, 27572.9% for AGIs over 200k)
Profit/loss from business: +$37,569 (reported on 24.5% of returns)
Here:
+$37,569
State:
+$11,172
(% of AGI for various income ranges: 160.8% for AGIs below $25k, 200.6% for AGIs $25k-50k, 426.5% for AGIs $50k-75k, 1137.9% for AGIs $75k-100k, 1302.9% for AGIs $100k-200k, 9907.6% for AGIs over 200k)
Taxable individual retirement arrangement distribution: $26,704 (reported on 15.0% of returns)
48070:
$26,704
Michigan:
$19,803
(% of AGI for various income ranges: 77.8% for AGIs below $25k, 287.8% for AGIs $25k-50k, 452.5% for AGIs $50k-75k, 752.9% for AGIs $75k-100k, 1237.1% for AGIs $100k-200k, 2267.1% for AGIs over 200k)
Self-employed (Keogh) retirement plans: $29,062 (reported on 4.0% of returns)
48070:
$29,062
Michigan:
$25,132
(% of AGI for various income ranges: 114.9% for AGIs $100k-200k, 1552.9% for AGIs over 200k)
Total itemized deductions: $35,203 (reported on 22.0% of returns)
Here:
$35,203
State:
$34,117
(% of AGI for various income ranges: 602.8% for AGIs $25k-50k, 699.0% for AGIs $50k-75k, 1050.0% for AGIs $75k-100k, 1351.3% for AGIs $100k-200k, 7291.4% for AGIs over 200k)
Charity contributions: $13,089 (reported on 20.2% of returns)
Here:
$13,089
State:
$13,548
(% of AGI for various income ranges: 97.2% for AGIs $25k-50k, 76.5% for AGIs $50k-75k, 125.7% for AGIs $75k-100k, 241.6% for AGIs $100k-200k, 3356.2% for AGIs over 200k)
Taxes paid: $9,283 (reported on 22.0% of returns)
48070:
$9,283
State:
$7,972
(% of AGI for various income ranges: 215.0% for AGIs $25k-50k, 213.0% for AGIs $50k-75k, 357.1% for AGIs $75k-100k, 470.0% for AGIs $100k-200k, 1550.5% for AGIs over 200k)
Earned income credit: $1,080 (reported on 3.1% of returns)
Here:
$1,080
State:
$2,251
(% of AGI for various income ranges: 18.9% for AGIs below $25k, 22.2% for AGIs $25k-50k)
Percentage of individuals using paid preparers for their 2020 taxes: 92.4%
Here:
92%
State:
93%
(% for various income ranges: 90.5% for AGIs below $25k, 89.3% for AGIs $25k-50k, 93.9% for AGIs $50k-75k, 92.3% for AGIs $75k-100k, 93.3% for AGIs $100k-200k, 93.5% for AGIs over 200k)
Averages for the 2012 tax year for zip code 48070, filed in 2013:
Average Adjusted Gross Income (AGI) in 2012: $141,328 (Individual Income Tax Returns)
Here:
$141,328
State:
$55,609
Salary/wage: $108,940 (reported on 78.6% of returns)
Here:
$108,940
State:
$46,782
(% of AGI for various income ranges: 61.3% for AGIs below $25k, 59.4% for AGIs $25k-50k, 58.2% for AGIs $50k-75k, 65.5% for AGIs $75k-100k, 72.7% for AGIs $100k-200k, 54.6% for AGIs over 200k)
Taxable interest for individuals: $1,824 (reported on 58.9% of returns)
This zip code:
$1,824
Michigan:
$1,491
(% of AGI for various income ranges: 2.7% for AGIs below $25k, 1.6% for AGIs $25k-50k, 1.5% for AGIs $50k-75k, 0.7% for AGIs $75k-100k, 0.8% for AGIs $100k-200k, 0.6% for AGIs over 200k)
Ordinary dividends: $7,963 (reported on 53.7% of returns)
Here:
$7,963
State:
$6,225
(% of AGI for various income ranges: 8.6% for AGIs below $25k, 5.1% for AGIs $25k-50k, 4.3% for AGIs $50k-75k, 3.6% for AGIs $75k-100k, 2.8% for AGIs $100k-200k, 2.7% for AGIs over 200k)
Net capital gain/loss in AGI: +$15,587 (reported on 45.0% of returns)
Here:
+$15,587
State:
+$9,326
(% of AGI for various income ranges: 1.2% for AGIs $50k-75k, 1.6% for AGIs $75k-100k, 1.3% for AGIs $100k-200k, 7.8% for AGIs over 200k)
Profit/loss from business: +$32,695 (reported on 23.9% of returns)
Here:
+$32,695
State:
+$11,523
(% of AGI for various income ranges: 8.5% for AGIs below $25k, 9.6% for AGIs $25k-50k, 6.2% for AGIs $50k-75k, 7.0% for AGIs $75k-100k, 6.2% for AGIs $100k-200k, 4.7% for AGIs over 200k)
Taxable individual retirement arrangement distribution: $25,490 (reported on 16.8% of returns)
48070:
$25,490
Michigan:
$15,298
(% of AGI for various income ranges: 5.0% for AGIs below $25k, 5.4% for AGIs $25k-50k, 5.3% for AGIs $50k-75k, 4.1% for AGIs $75k-100k, 3.5% for AGIs $100k-200k, 2.3% for AGIs over 200k)
Self-employment retirement plans: $26,192 (reported on 3.9% of returns)
48070:
$26,192
Michigan:
$20,834
Total itemized deductions: $29,979 (15% of AGI, reported on 64.4% of returns)
Here:
$29,979
State:
$21,628
Here:
14.9% of AGI
State:
18.4% of AGI
(% of AGI for various income ranges: 25.9% for AGIs below $25k, 17.6% for AGIs $25k-50k, 21.5% for AGIs $50k-75k, 18.9% for AGIs $75k-100k, 16.9% for AGIs $100k-200k, 10.3% for AGIs over 200k)
Charity contributions: $4,958 (reported on 58.9% of returns)
Here:
$4,958
State:
$4,225
(% of AGI for various income ranges: 1.1% for AGIs below $25k, 1.8% for AGIs $25k-50k, 2.3% for AGIs $50k-75k, 2.0% for AGIs $75k-100k, 2.2% for AGIs $100k-200k, 2.0% for AGIs over 200k)
Taxes paid: $14,276 (reported on 64.4% of returns)
48070:
$14,276
State:
$8,327
(% of AGI for various income ranges: 7.7% for AGIs below $25k, 7.0% for AGIs $25k-50k, 7.8% for AGIs $50k-75k, 7.8% for AGIs $75k-100k, 7.8% for AGIs $100k-200k, 5.6% for AGIs over 200k)
Earned income credit: $1,210 (reported on 3.2% of returns)
Here:
$1,210
State:
$2,306
(% of AGI for various income ranges: 1.4% for AGIs below $25k, 0.3% for AGIs $25k-50k)
Percentage of individuals using paid preparers for their 2012 taxes: 64.4%
Here:
64%
State:
57%
(% for various income ranges: 59.0% for AGIs below $25k, 64.3% for AGIs $25k-50k, 62.9% for AGIs $50k-75k, 63.6% for AGIs $75k-100k, 64.0% for AGIs $100k-200k, 75.5% for AGIs over 200k)
Averages for the 2004 tax year for zip code 48070, filed in 2005:
Average Adjusted Gross Income (AGI) in 2004: $96,274 (Individual Income Tax Returns)
Here:
$96,274
State:
$48,204
Salary/wage: $85,500 (reported on 79.2% of returns)
Here:
$85,500
State:
$42,791
(% of AGI for various income ranges: 252.6% for AGIs below $10k, 51.2% for AGIs $10k-25k, 60.6% for AGIs $25k-50k, 70.3% for AGIs $50k-75k, 78.2% for AGIs $75k-100k, 69.5% for AGIs over 100k)
Taxable interest for individuals: $2,388 (reported on 77.7% of returns)
This zip code:
$2,388
Michigan:
$1,725
(% of AGI for various income ranges: 23.5% for AGIs below $10k, 8.8% for AGIs $10k-25k, 4.8% for AGIs $25k-50k, 2.7% for AGIs $50k-75k, 1.7% for AGIs $75k-100k, 1.5% for AGIs over 100k)
Taxable dividends: $4,560 (reported on 63.9% of returns)
Here:
$4,560
State:
$3,420
(% of AGI for various income ranges: 38.8% for AGIs below $10k, 10.5% for AGIs $10k-25k, 6.8% for AGIs $25k-50k, 4.0% for AGIs $50k-75k, 2.2% for AGIs $75k-100k, 2.5% for AGIs over 100k)
Net capital gain/loss: +$7,950 (reported on 52.9% of returns)
Here:
+$7,950
State:
+$8,532
(% of AGI for various income ranges: -26.8% for AGIs below $10k, 1.3% for AGIs $10k-25k, 0.9% for AGIs $25k-50k, 0.8% for AGIs $50k-75k, 0.7% for AGIs $75k-100k, 5.7% for AGIs over 100k)
Profit/loss from business: +$25,024 (reported on 21.3% of returns)
Here:
+$25,024
State:
+$9,547
(% of AGI for various income ranges: 11.2% for AGIs below $10k, 5.0% for AGIs $10k-25k, 5.7% for AGIs $25k-50k, 4.8% for AGIs $50k-75k, 4.7% for AGIs $75k-100k, 5.7% for AGIs over 100k)
IRA payment deduction: $3,646 (reported on 3.6% of returns)
48070:
$3,646
Michigan:
$2,875
(% of AGI for various income ranges: 0.7% for AGIs $10k-25k, 0.5% for AGIs $25k-50k, 0.4% for AGIs $50k-75k, 0.2% for AGIs $75k-100k, 0.1% for AGIs over 100k)
Self-employed pension: $16,078 (reported on 4.5% of returns)
Here:
$16,078
Michigan:
$13,826
(% of AGI for various income ranges: 5.4% for AGIs below $10k, 0.3% for AGIs $50k-75k, 0.3% for AGIs $75k-100k, 0.9% for AGIs over 100k)
Total itemized deductions: $25,144 (18% of AGI, reported on 65.3% of returns)
Here:
$25,144
State:
$18,509
Here:
18.3% of AGI
State:
20.7% of AGI
(% of AGI for various income ranges: 89.9% for AGIs below $10k, 31.5% for AGIs $10k-25k, 25.5% for AGIs $25k-50k, 23.2% for AGIs $50k-75k, 20.8% for AGIs $75k-100k, 14.7% for AGIs over 100k)
Charity contributions deductions: $4,393 (3% of AGI, reported on 62.5% of returns)
Here:
$4,393
State:
$3,365
Here:
3.1% of AGI
State:
3.6% of AGI
(% of AGI for various income ranges: 2.8% for AGIs below $10k, 2.4% for AGIs $10k-25k, 3.2% for AGIs $25k-50k, 3.0% for AGIs $50k-75k, 2.6% for AGIs $75k-100k, 2.9% for AGIs over 100k)
Total tax: $19,531 (reported on 83.1% of returns)
48070:
$19,531
State:
$7,691
(% of AGI for various income ranges: 10.2% for AGIs below $10k, 4.7% for AGIs $10k-25k, 7.6% for AGIs $25k-50k, 9.5% for AGIs $50k-75k, 10.7% for AGIs $75k-100k, 19.5% for AGIs over 100k)
Earned income credit: $1,041 (reported on 2.4% of returns)
Here:
$1,041
State:
$1,737
Percentage of individuals using paid preparers for their 2004 taxes: 64.6%
Here:
65%
State:
60%
(% for various income ranges: 64.1% for AGIs below $10k, 62.3% for AGIs $10k-25k, 62.6% for AGIs $25k-50k, 64.1% for AGIs $50k-75k, 62.3% for AGIs $75k-100k, 67.3% for AGIs over 100k)
Likely homosexual households (counted as self-reported same-sex unmarried-partner households)
Lesbian couples: 0.0% of all households
Gay men: 0.6% of all households
Household received Food Stamps/SNAP in the past 12 months: 16 Household did not receive Food Stamps/SNAP in the past 12 months: 2,310
Women who had a birth in the past 12 months: 55 (56 now married, 0 unmarried) Women who did not have a birth in the past 12 months: 1,271 (739 now married, 526 unmarried)
Housing units in zip code 48070 with a mortgage: 1,567 (120 second mortgage, 113 both second mortgage and home equity loan) Houses without a mortgage: 30
Median monthly owner costs for units with a mortgage: $2,595 Median monthly owner costs for units without a mortgage: over $1,000
Residents with income below the poverty level in 2022:
This zip code:
1.6%
Whole state:
13.4%
Residents with income below 50% of the poverty level in 2022:
This zip code:
1.2%
Whole state:
6.9%
Median number of rooms in houses and condos:
Here:
7.9
State:
6.5
Median number of rooms in apartments:
Here:
6.3
State:
4.3
Notable locations in this zip code not listed on our city pages
Notable locations in zip code 48070: Rackham Golf Club (A), Huntington Woods Police Department (B), Huntington Woods Volunteer Fire Company (C), Huntington Woods Department of Public Safety Fire Station (D). Display/hide their locations on the map
Parks in zip code 48070 include: Fred A Baker House Historical Marker (1), Detroit Zoological Park (2), Scotia Lincoln Park (3). Display/hide their locations on the map
In group quarters: 5 (-1 institutionalized population)
Size of family households: 693 2-persons, 533 3-persons, 466 4-persons, 139 5-persons, 18 6-persons, 5 7-or-more-persons
Size of nonfamily households: 353 1-person, 117 2-persons
1,450 married couples with children.
106 single-parent households (35 men, 71 women).
95.7% of residents of 48070 zip code speak English at home.
2.8% of residents speak other Indo-European language at home (96% very well, 4% not well).
1.1% of residents speak other language at home (100% very well).
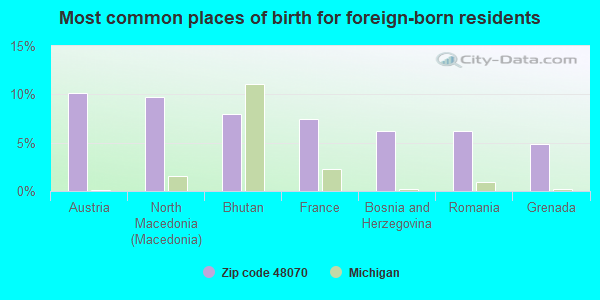
Foreign born population: 228 (3.6%) (65.9% of them are naturalized citizens)
This zip code:
3.6%
Whole state:
6.9%
10%Austria
10%North Macedonia (Macedonia)
8%Bhutan
7%France
6%Bosnia and Herzegovina
6%Romania
5%Grenada
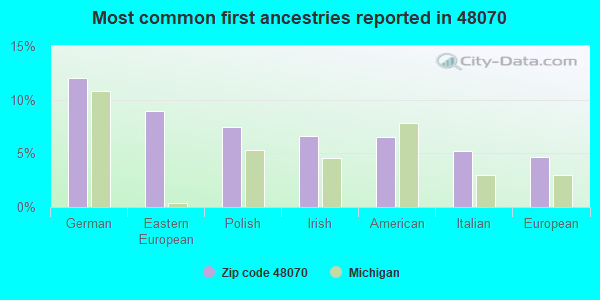
12%German
9%Eastern European
7%Polish
7%Irish
6%American
5%Italian
5%European
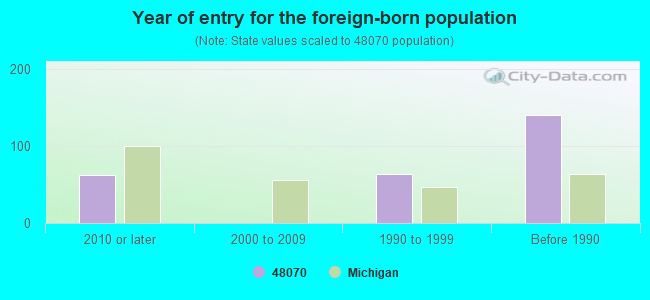
Year of entry for the foreign-born population
622010 or later
02000 to 2009
631990 to 1999
140Before 1990
Facilities with environmental interests located in this zip code:
ARMITAGE COLLISION INC (13153 W 11 MILE RD in HUNTINGTON WOODS, MI)
Small Quantity Generators, between 100 kg and 1000 kg of hazardous waste/month (Resource Conservation and Recovery Act (tracking hazardous waste)) Organizations: STECKROTH PAUL (CONTACT/OPERATOR)
, KLUGER BRIAN (CONTACT/OPERATOR)
DETROIT RACKAM GOLF CITY OF (10100 W 10 MILE in HUNTINGTON WOODS, MI)
Conditionally Exempt Small Quantity Generators, less than 100 kg/month of hazardous waste (Resource Conservation and Recovery Act (tracking hazardous waste)) Organizations: DETROIT CITY OF DPW (CONTACT/OWNER)
90.5%Utility gas
5.7%Electricity
3.3%Bottled, tank, or LP gas
Population in 1990: 9,107.
Place of birth for U.S.-born residents:
This state: 4,858
Northeast: 558
Midwest: 413
South: 170
West: 90
69% of the 48070 zip code residents lived in the same house 5 years ago. Out of people who lived in different houses, 61% lived in this county. Out of people who lived in different counties, 50% lived in Michigan.
95% of the 48070 zip code residents lived in the same house 1 year ago. Out of people who lived in different houses, 78% moved from this county. Out of people who lived in different houses, 12% moved from different county within same state. Out of people who lived in different houses, 11% moved from different state.
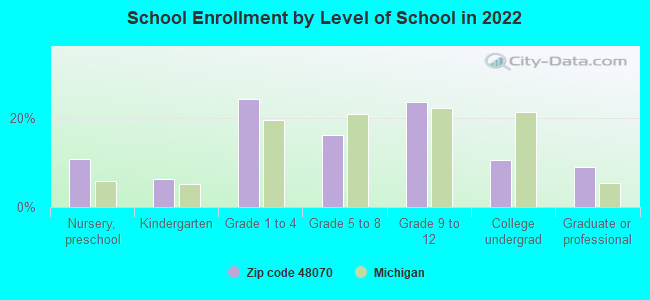
Private vs. public school enrollment:
Students in private schools in grades 1 to 8 (elementary and middle school): 145
Here:
21.6%
Michigan:
12.4%
Students in private schools in grades 9 to 12 (high school): 103
Here:
26.7%
Michigan:
9.8%
Students in private undergraduate colleges: 23
Here:
13.2%
Michigan:
14.9%
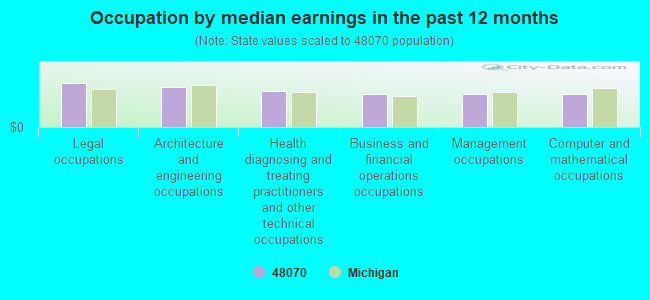
Occupation by median earnings in the past 12 months ($)
165,237Legal occupations
151,545Architecture and engineering occupations
135,767Health diagnosing and treating practitioners and other technical occupations
125,421Business and financial operations occupations
124,916Management occupations
122,312Computer and mathematical occupations
Top industries in this zip code by the number of employees in 2005:
Other Services (except Public Administration): Drycleaning and Laundry Services (except Coin-Operated) (100-249 employees: 1 establishment)
Finance and Insurance: Real Estate Credit (50-99: 1, 10-19: 2, 1-4: 1)
Health Care and Social Assistance: Offices of Dentists (20-49: 1, 5-9: 7, 1-4: 6)
Health Care and Social Assistance: Home Health Care Services (50-99: 1, 10-19: 1)
Administrative and Support and Waste Management and Remediation Services: Office Administrative Services (50-99: 1, 1-4: 1)
Arts, Entertainment, and Recreation: Golf Courses and Country Clubs (50-99: 1)
Health Care and Social Assistance: Offices of Physicians (except Mental Health Specialists) (20-49: 1, 10-19: 1, 1-4: 4)
Real Estate and Rental and Leasing: Other Activities Related to Real Estate (20-49: 1, 10-19: 1)
Professional, Scientific, and Technical Services: Offices of Lawyers (10-19: 1, 1-4: 10)
People in group quarters in 2010:
6 people in group homes intended for adults
People in group quarters in 2000:
6 people in homes for the mentally retarded
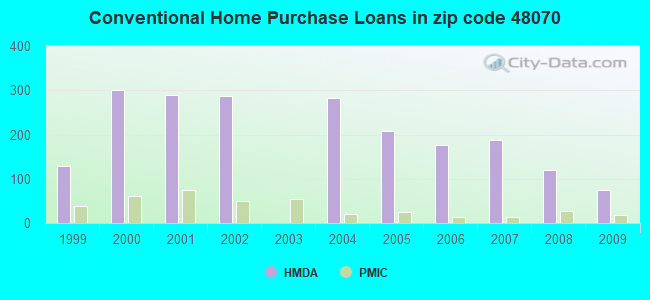
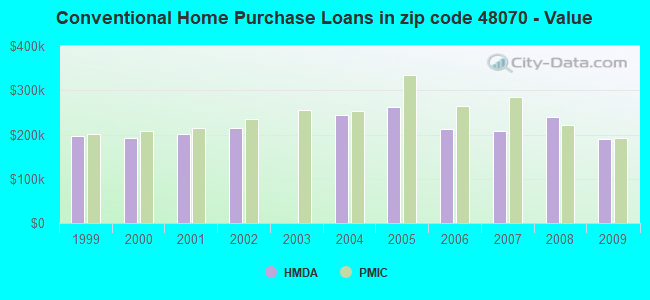
Home Mortgage Disclosure Act Aggregated Statistics For Year 2009 (Based on 4 full tracts)
A) FHA, FSA/RHS & VA Home Purchase Loans
B) Conventional Home Purchase Loans
C) Refinancings
D) Home Improvement Loans
F) Non-occupant Loans on < 5 Family Dwellings (A B C & D)
Number
Average Value
Number
Average Value
Number
Average Value
Number
Average Value
Number
Average Value
LOANS ORIGINATED
54
$186,821
75
$190,345
383
$231,481
14
$126,086
6
$212,135
APPLICATIONS APPROVED, NOT ACCEPTED
2
$215,055
6
$284,078
53
$262,215
0
$0
2
$292,530
APPLICATIONS DENIED
6
$194,695
6
$218,422
134
$274,007
4
$62,128
4
$292,530
APPLICATIONS WITHDRAWN
6
$132,218
10
$195,992
54
$292,404
0
$0
2
$86,020
FILES CLOSED FOR INCOMPLETENESS
0
$0
0
$0
23
$248,541
0
$0
0
$0
Aggregated Statistics For Year 2008 (Based on 4 full tracts)
A) FHA, FSA/RHS & VA Home Purchase Loans
B) Conventional Home Purchase Loans
C) Refinancings
D) Home Improvement Loans
F) Non-occupant Loans on < 5 Family Dwellings (A B C & D)
Number
Average Value
Number
Average Value
Number
Average Value
Number
Average Value
Number
Average Value
LOANS ORIGINATED
25
$204,709
120
$239,338
221
$253,465
15
$58,365
16
$171,320
APPLICATIONS APPROVED, NOT ACCEPTED
0
$0
14
$226,783
27
$197,278
6
$19,827
2
$198,920
APPLICATIONS DENIED
2
$150,165
12
$301,376
74
$281,279
12
$21,188
0
$0
APPLICATIONS WITHDRAWN
2
$167,265
6
$293,818
29
$236,822
2
$375,415
2
$243,730
FILES CLOSED FOR INCOMPLETENESS
0
$0
2
$353,645
10
$259,110
4
$209,648
0
$0
Aggregated Statistics For Year 2007 (Based on 4 full tracts)
A) FHA, FSA/RHS & VA Home Purchase Loans
B) Conventional Home Purchase Loans
C) Refinancings
D) Home Improvement Loans
F) Non-occupant Loans on < 5 Family Dwellings (A B C & D)
Number
Average Value
Number
Average Value
Number
Average Value
Number
Average Value
Number
Average Value
LOANS ORIGINATED
4
$190,402
188
$208,670
277
$245,794
17
$152,779
17
$164,270
APPLICATIONS APPROVED, NOT ACCEPTED
0
$0
13
$248,789
56
$197,932
2
$86,980
4
$124,732
APPLICATIONS DENIED
0
$0
33
$277,273
125
$265,568
10
$219,248
31
$180,552
APPLICATIONS WITHDRAWN
0
$0
4
$185,425
37
$229,815
2
$29,255
4
$254,720
FILES CLOSED FOR INCOMPLETENESS
0
$0
2
$406,615
17
$328,244
2
$95,580
2
$95,580
Aggregated Statistics For Year 2006 (Based on 4 full tracts)
A) FHA, FSA/RHS & VA Home Purchase Loans
B) Conventional Home Purchase Loans
C) Refinancings
D) Home Improvement Loans
F) Non-occupant Loans on < 5 Family Dwellings (A B C & D)
Number
Average Value
Number
Average Value
Number
Average Value
Number
Average Value
Number
Average Value
LOANS ORIGINATED
4
$204,062
176
$213,139
323
$226,363
44
$93,635
12
$178,733
APPLICATIONS APPROVED, NOT ACCEPTED
0
$0
8
$141,636
41
$191,371
8
$594,080
0
$0
APPLICATIONS DENIED
4
$207,408
23
$166,465
107
$271,032
12
$276,628
4
$206,930
APPLICATIONS WITHDRAWN
0
$0
12
$234,831
37
$244,371
2
$76,060
2
$301,075
FILES CLOSED FOR INCOMPLETENESS
0
$0
0
$0
23
$172,830
0
$0
0
$0
Aggregated Statistics For Year 2005 (Based on 4 full tracts)
A) FHA, FSA/RHS & VA Home Purchase Loans
B) Conventional Home Purchase Loans
C) Refinancings
D) Home Improvement Loans
F) Non-occupant Loans on < 5 Family Dwellings (A B C & D)
Number
Average Value
Number
Average Value
Number
Average Value
Number
Average Value
Number
Average Value
LOANS ORIGINATED
0
$0
209
$262,124
482
$258,413
37
$128,363
29
$191,289
APPLICATIONS APPROVED, NOT ACCEPTED
0
$0
27
$277,139
37
$291,265
6
$221,998
4
$297,405
APPLICATIONS DENIED
4
$195,940
16
$325,142
87
$260,111
17
$137,008
2
$177,780
APPLICATIONS WITHDRAWN
0
$0
27
$219,063
85
$267,193
2
$682,570
2
$234,025
FILES CLOSED FOR INCOMPLETENESS
0
$0
8
$166,202
35
$241,985
2
$43,965
0
$0
Aggregated Statistics For Year 2004 (Based on 4 full tracts)
A) FHA, FSA/RHS & VA Home Purchase Loans
B) Conventional Home Purchase Loans
C) Refinancings
D) Home Improvement Loans
F) Non-occupant Loans on < 5 Family Dwellings (A B C & D)
Number
Average Value
Number
Average Value
Number
Average Value
Number
Average Value
Number
Average Value
LOANS ORIGINATED
0
$0
283
$243,300
609
$233,588
39
$153,465
27
$178,986
APPLICATIONS APPROVED, NOT ACCEPTED
0
$0
31
$259,483
66
$192,831
15
$177,083
10
$220,167
APPLICATIONS DENIED
2
$113,110
10
$230,772
66
$227,164
8
$54,850
6
$146,112
APPLICATIONS WITHDRAWN
0
$0
16
$276,878
54
$219,747
10
$166,547
4
$313,008
FILES CLOSED FOR INCOMPLETENESS
0
$0
8
$231,931
19
$181,279
4
$21,125
2
$119,475
Aggregated Statistics For Year 2002 (Based on 4 full tracts)
A) FHA, FSA/RHS & VA Home Purchase Loans
B) Conventional Home Purchase Loans
C) Refinancings
D) Home Improvement Loans
F) Non-occupant Loans on < 5 Family Dwellings (A B C & D)
Number
Average Value
Number
Average Value
Number
Average Value
Number
Average Value
Number
Average Value
LOANS ORIGINATED
0
$0
287
$213,594
1,564
$204,610
46
$40,026
23
$167,271
APPLICATIONS APPROVED, NOT ACCEPTED
0
$0
23
$211,609
124
$190,523
10
$36,278
4
$251,852
APPLICATIONS DENIED
0
$0
12
$205,477
77
$233,466
12
$10,786
4
$213,885
APPLICATIONS WITHDRAWN
2
$166,740
10
$213,121
83
$192,080
4
$149,190
2
$131,640
FILES CLOSED FOR INCOMPLETENESS
0
$0
8
$144,658
25
$204,004
0
$0
0
$0
Aggregated Statistics For Year 2001 (Based on 4 full tracts)
B) Conventional Home Purchase Loans
C) Refinancings
D) Home Improvement Loans
F) Non-occupant Loans on < 5 Family Dwellings (A B C & D)
Number
Average Value
Number
Average Value
Number
Average Value
Number
Average Value
LOANS ORIGINATED
290
$201,360
1,083
$201,462
79
$35,178
16
$167,171
APPLICATIONS APPROVED, NOT ACCEPTED
12
$224,382
79
$155,955
8
$19,432
0
$0
APPLICATIONS DENIED
8
$239,086
58
$211,681
8
$28,031
0
$0
APPLICATIONS WITHDRAWN
10
$315,615
79
$203,088
4
$10,238
2
$152,930
FILES CLOSED FOR INCOMPLETENESS
2
$268,155
31
$171,593
0
$0
2
$136,515
Aggregated Statistics For Year 2000 (Based on 4 full tracts)
B) Conventional Home Purchase Loans
C) Refinancings
D) Home Improvement Loans
F) Non-occupant Loans on < 5 Family Dwellings (A B C & D)
Number
Average Value
Number
Average Value
Number
Average Value
Number
Average Value
LOANS ORIGINATED
300
$192,773
270
$173,093
72
$59,696
17
$158,598
APPLICATIONS APPROVED, NOT ACCEPTED
13
$205,238
23
$149,787
19
$22,639
0
$0
APPLICATIONS DENIED
15
$144,635
37
$201,041
14
$30,294
4
$92,148
APPLICATIONS WITHDRAWN
19
$186,206
35
$165,686
6
$30,553
0
$0
FILES CLOSED FOR INCOMPLETENESS
4
$226,048
6
$76,403
0
$0
0
$0
Aggregated Statistics For Year 1999 (Based on 2 full tracts)
A) FHA, FSA/RHS & VA Home Purchase Loans
B) Conventional Home Purchase Loans
C) Refinancings
D) Home Improvement Loans
F) Non-occupant Loans on < 5 Family Dwellings (A B C & D)


 Nearest zip codes: 48237, 48072, 48069, 48067, 48073, 48220.