Estimated zip code population in 2022: 29,425 Zip code population in 2010: 29,319 Zip code population in 2000: 32,493
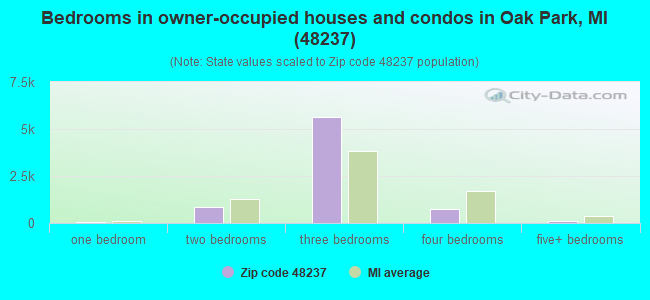
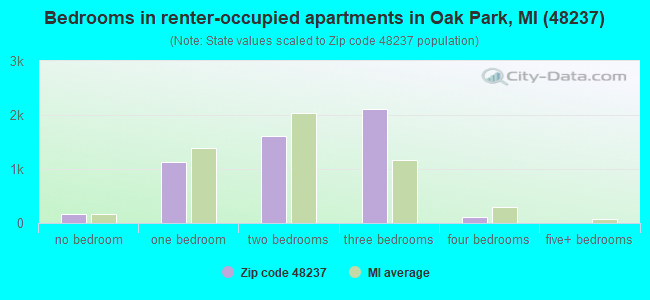
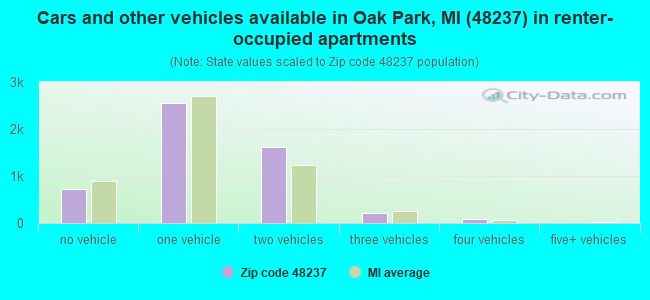
Houses and condos: 12,937 Renter-occupied apartments: 5,212
% of renters here:
41%
State:
27%
March 2022 cost of living index in zip code 48237: 96.8 (near average, U.S. average is 100)
Land area: 5.2 sq. mi. Water area: 0.0 sq. mi.
Population density: 5,712 people per square mile
(average).
OSM Map
General Map
Google Map
MSN Map
OSM Map
General Map
Google Map
MSN Map
OSM Map
General Map
Google Map
MSN Map
OSM Map
General Map
Google Map
MSN Map
Please wait while loading the map...
Real estate property taxes paid for housing units in 2022:
This zip code:
1.3% ($2,618)
Michigan:
1.2% ($2,746)
Median real estate property taxes paid for housing units with mortgages in 2022: $2,741 (1.3%) Median real estate property taxes paid for housing units with no mortgage in 2022: $2,431 (1.3%)
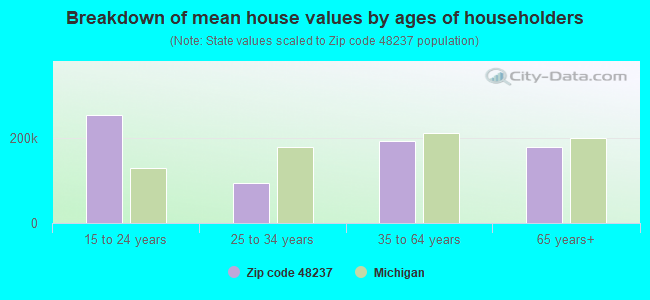
Estimated median house/condo value in 2022: $197,396
48237:
$197,396
Michigan:
$224,400
According to our research of Michigan and other state lists, there were 51 registered sex offenders living in 48237 zip code as of April 27, 2024. The ratio of all residents to sex offenders in zip code 48237 is 592 to 1. The ratio of registered sex offenders to all residents in this zip code is lower than the state average.
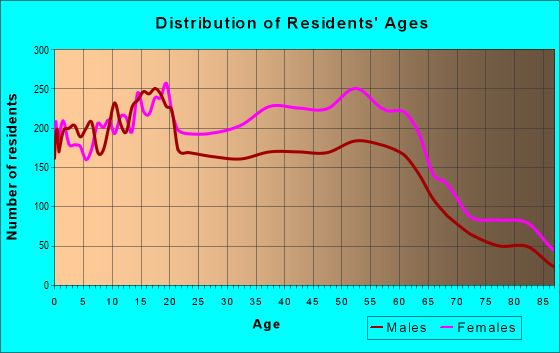
Median resident age:
This zip code:
38.3 years
Michigan median age:
40.3 years
Average household size:
This zip code:
2.3 people
Michigan:
2.4 people
Averages for the 2020 tax year for zip code 48237, filed in 2021:
Average Adjusted Gross Income (AGI) in 2020: $48,570 (Individual Income Tax Returns)
Here:
$48,570
State:
$68,945
Salary/wage: $44,846 (reported on 79.6% of returns)
Here:
$44,846
State:
$57,142
(% of AGI for various income ranges: 1021.5% for AGIs below $25k, 3568.0% for AGIs $25k-50k, 7086.2% for AGIs $50k-75k, 10610.0% for AGIs $75k-100k, 18063.4% for AGIs $100k-200k, 87388.0% for AGIs over 200k)
Taxable interest for individuals: $1,232 (reported on 18.4% of returns)
This zip code:
$1,232
Michigan:
$1,630
(% of AGI for various income ranges: 9.1% for AGIs below $25k, 8.4% for AGIs $25k-50k, 24.9% for AGIs $50k-75k, 50.9% for AGIs $75k-100k, 89.6% for AGIs $100k-200k, 2670.0% for AGIs over 200k)
Ordinary dividends: $4,018 (reported on 11.1% of returns)
Here:
$4,018
State:
$6,972
(% of AGI for various income ranges: 14.6% for AGIs below $25k, 19.6% for AGIs $25k-50k, 43.1% for AGIs $50k-75k, 103.4% for AGIs $75k-100k, 181.2% for AGIs $100k-200k, 5462.0% for AGIs over 200k)
Net capital gain/loss in AGI: +$7,476 (reported on 10.2% of returns)
Here:
+$7,476
State:
+$20,064
(% of AGI for various income ranges: 8.5% for AGIs below $25k, 19.9% for AGIs $25k-50k, 42.3% for AGIs $50k-75k, 71.4% for AGIs $75k-100k, 370.9% for AGIs $100k-200k, 13648.0% for AGIs over 200k)
Profit/loss from business: +$3,394 (reported on 20.7% of returns)
Here:
+$3,394
State:
+$11,172
(% of AGI for various income ranges: 30.6% for AGIs below $25k, 84.2% for AGIs $50k-75k, 154.9% for AGIs $75k-100k, 544.7% for AGIs $100k-200k, 7544.0% for AGIs over 200k)
Taxable individual retirement arrangement distribution: $13,289 (reported on 5.8% of returns)
48237:
$13,289
Michigan:
$19,803
(% of AGI for various income ranges: 32.8% for AGIs below $25k, 55.8% for AGIs $25k-50k, 140.4% for AGIs $50k-75k, 172.8% for AGIs $75k-100k, 530.3% for AGIs $100k-200k, 2038.0% for AGIs over 200k)
Self-employed (Keogh) retirement plans: $10,733 (reported on 0.2% of returns)
48237:
$10,733
Michigan:
$25,132
(% of AGI for various income ranges: 47.4% for AGIs $100k-200k)
Total itemized deductions: $27,640 (reported on 6.6% of returns)
Here:
$27,640
State:
$34,117
(% of AGI for various income ranges: 28.2% for AGIs below $25k, 116.6% for AGIs $25k-50k, 316.5% for AGIs $50k-75k, 504.7% for AGIs $75k-100k, 1028.5% for AGIs $100k-200k, 11546.0% for AGIs over 200k)
Charity contributions: $12,182 (reported on 5.5% of returns)
Here:
$12,182
State:
$13,548
(% of AGI for various income ranges: 3.7% for AGIs below $25k, 33.1% for AGIs $25k-50k, 107.5% for AGIs $50k-75k, 146.0% for AGIs $75k-100k, 361.9% for AGIs $100k-200k, 6850.0% for AGIs over 200k)
Taxes paid: $6,505 (reported on 6.6% of returns)
48237:
$6,505
State:
$7,972
(% of AGI for various income ranges: 5.0% for AGIs below $25k, 25.5% for AGIs $25k-50k, 83.6% for AGIs $50k-75k, 141.4% for AGIs $75k-100k, 296.8% for AGIs $100k-200k, 1518.0% for AGIs over 200k)
Earned income credit: $2,266 (reported on 18.8% of returns)
Here:
$2,266
State:
$2,251
(% of AGI for various income ranges: 98.7% for AGIs below $25k, 77.0% for AGIs $25k-50k, 0.9% for AGIs $50k-75k)
Percentage of individuals using paid preparers for their 2020 taxes: 90.6%
Here:
91%
State:
93%
(% for various income ranges: 89.8% for AGIs below $25k, 92.1% for AGIs $25k-50k, 89.9% for AGIs $50k-75k, 89.6% for AGIs $75k-100k, 91.1% for AGIs $100k-200k, 88.9% for AGIs over 200k)
Averages for the 2012 tax year for zip code 48237, filed in 2013:
Average Adjusted Gross Income (AGI) in 2012: $38,911 (Individual Income Tax Returns)
Here:
$38,911
State:
$55,609
Salary/wage: $34,982 (reported on 81.9% of returns)
Here:
$34,982
State:
$46,782
(% of AGI for various income ranges: 69.7% for AGIs below $25k, 79.8% for AGIs $25k-50k, 78.2% for AGIs $50k-75k, 77.3% for AGIs $75k-100k, 73.8% for AGIs $100k-200k, 43.6% for AGIs over 200k)
Taxable interest for individuals: $1,290 (reported on 20.9% of returns)
This zip code:
$1,290
Michigan:
$1,491
(% of AGI for various income ranges: 0.8% for AGIs below $25k, 0.4% for AGIs $25k-50k, 0.5% for AGIs $50k-75k, 0.6% for AGIs $75k-100k, 0.6% for AGIs $100k-200k, 2.3% for AGIs over 200k)
Ordinary dividends: $4,179 (reported on 11.5% of returns)
Here:
$4,179
State:
$6,225
(% of AGI for various income ranges: 1.3% for AGIs below $25k, 0.5% for AGIs $25k-50k, 0.8% for AGIs $50k-75k, 0.9% for AGIs $75k-100k, 1.4% for AGIs $100k-200k, 4.4% for AGIs over 200k)
Net capital gain/loss in AGI: +$3,379 (reported on 9.1% of returns)
Here:
+$3,379
State:
+$9,326
(% of AGI for various income ranges: 0.3% for AGIs $75k-100k, 1.9% for AGIs $100k-200k, 5.6% for AGIs over 200k)
Profit/loss from business: +$7,313 (reported on 16.9% of returns)
Here:
+$7,313
State:
+$11,523
(% of AGI for various income ranges: 9.6% for AGIs below $25k, 0.6% for AGIs $25k-50k, 2.0% for AGIs $50k-75k, 1.3% for AGIs $75k-100k, 3.0% for AGIs $100k-200k, 6.3% for AGIs over 200k)
Taxable individual retirement arrangement distribution: $11,124 (reported on 7.2% of returns)
48237:
$11,124
Michigan:
$15,298
(% of AGI for various income ranges: 2.3% for AGIs below $25k, 1.7% for AGIs $25k-50k, 1.9% for AGIs $50k-75k, 2.5% for AGIs $75k-100k, 3.2% for AGIs $100k-200k)
Self-employment retirement plans: $13,200 (reported on 0.3% of returns)
48237:
$13,200
Michigan:
$20,834
Total itemized deductions: $17,465 (24% of AGI, reported on 26.1% of returns)
Here:
$17,465
State:
$21,628
Here:
23.8% of AGI
State:
18.4% of AGI
(% of AGI for various income ranges: 7.0% for AGIs below $25k, 10.3% for AGIs $25k-50k, 12.6% for AGIs $50k-75k, 12.6% for AGIs $75k-100k, 13.4% for AGIs $100k-200k, 17.0% for AGIs over 200k)
Charity contributions: $4,857 (reported on 22.9% of returns)
Here:
$4,857
State:
$4,225
(% of AGI for various income ranges: 1.0% for AGIs below $25k, 2.1% for AGIs $25k-50k, 2.9% for AGIs $50k-75k, 2.9% for AGIs $75k-100k, 3.4% for AGIs $100k-200k, 7.0% for AGIs over 200k)
Taxes paid: $5,392 (reported on 26.0% of returns)
48237:
$5,392
State:
$8,327
(% of AGI for various income ranges: 1.4% for AGIs below $25k, 2.7% for AGIs $25k-50k, 3.8% for AGIs $50k-75k, 4.1% for AGIs $75k-100k, 4.9% for AGIs $100k-200k, 6.0% for AGIs over 200k)
Earned income credit: $2,430 (reported on 25.3% of returns)
Here:
$2,430
State:
$2,306
(% of AGI for various income ranges: 8.7% for AGIs below $25k, 1.3% for AGIs $25k-50k)
Percentage of individuals using paid preparers for their 2012 taxes: 56.8%
Here:
57%
State:
57%
(% for various income ranges: 56.4% for AGIs below $25k, 54.0% for AGIs $25k-50k, 58.2% for AGIs $50k-75k, 58.0% for AGIs $75k-100k, 64.5% for AGIs $100k-200k, 90.9% for AGIs over 200k)
Averages for the 2004 tax year for zip code 48237, filed in 2005:
Average Adjusted Gross Income (AGI) in 2004: $38,813 (Individual Income Tax Returns)
Here:
$38,813
State:
$48,204
Salary/wage: $37,237 (reported on 84.3% of returns)
Here:
$37,237
State:
$42,791
(% of AGI for various income ranges: 78.8% for AGIs below $10k, 71.5% for AGIs $10k-25k, 84.5% for AGIs $25k-50k, 87.8% for AGIs $50k-75k, 86.2% for AGIs $75k-100k, 69.0% for AGIs over 100k)
Taxable interest for individuals: $1,467 (reported on 37.4% of returns)
This zip code:
$1,467
Michigan:
$1,725
(% of AGI for various income ranges: 5.1% for AGIs below $10k, 2.2% for AGIs $10k-25k, 1.0% for AGIs $25k-50k, 0.9% for AGIs $50k-75k, 0.9% for AGIs $75k-100k, 2.1% for AGIs over 100k)
Taxable dividends: $2,146 (reported on 18.2% of returns)
Here:
$2,146
State:
$3,420
(% of AGI for various income ranges: 3.5% for AGIs below $10k, 1.4% for AGIs $10k-25k, 0.8% for AGIs $25k-50k, 0.7% for AGIs $50k-75k, 0.6% for AGIs $75k-100k, 1.5% for AGIs over 100k)
Net capital gain/loss: +$6,035 (reported on 12.1% of returns)
Here:
+$6,035
State:
+$8,532
(% of AGI for various income ranges: -1.1% for AGIs below $10k, 0.5% for AGIs $10k-25k, 0.2% for AGIs $25k-50k, 0.3% for AGIs $50k-75k, 0.7% for AGIs $75k-100k, 7.7% for AGIs over 100k)
Profit/loss from business: +$6,127 (reported on 13.8% of returns)
Here:
+$6,127
State:
+$9,547
(% of AGI for various income ranges: 9.6% for AGIs below $10k, 5.5% for AGIs $10k-25k, 1.5% for AGIs $25k-50k, 1.0% for AGIs $50k-75k, 1.4% for AGIs $75k-100k, 2.6% for AGIs over 100k)
IRA payment deduction: $2,544 (reported on 1.7% of returns)
48237:
$2,544
Michigan:
$2,875
(% of AGI for various income ranges: 0.2% for AGIs below $10k, 0.1% for AGIs $10k-25k, 0.2% for AGIs $25k-50k, 0.1% for AGIs $50k-75k, 0.1% for AGIs $75k-100k, 0.1% for AGIs over 100k)
Self-employed pension: $9,213 (reported on 0.3% of returns)
Here:
$9,213
Michigan:
$13,826
Total itemized deductions: $16,425 (26% of AGI, reported on 40.9% of returns)
Here:
$16,425
State:
$18,509
Here:
26.1% of AGI
State:
20.7% of AGI
(% of AGI for various income ranges: 16.8% for AGIs below $10k, 14.2% for AGIs $10k-25k, 17.0% for AGIs $25k-50k, 19.5% for AGIs $50k-75k, 18.0% for AGIs $75k-100k, 16.2% for AGIs over 100k)
Charity contributions deductions: $3,966 (6% of AGI, reported on 36.9% of returns)
Here:
$3,966
State:
$3,365
Here:
6.1% of AGI
State:
3.6% of AGI
(% of AGI for various income ranges: 1.3% for AGIs below $10k, 2.1% for AGIs $10k-25k, 3.2% for AGIs $25k-50k, 4.0% for AGIs $50k-75k, 3.7% for AGIs $75k-100k, 5.4% for AGIs over 100k)
Total tax: $5,110 (reported on 71.8% of returns)
48237:
$5,110
State:
$7,691
(% of AGI for various income ranges: 2.7% for AGIs below $10k, 3.8% for AGIs $10k-25k, 6.4% for AGIs $25k-50k, 9.2% for AGIs $50k-75k, 10.8% for AGIs $75k-100k, 15.8% for AGIs over 100k)
Earned income credit: $1,754 (reported on 17.9% of returns)
Here:
$1,754
State:
$1,737
Percentage of individuals using paid preparers for their 2004 taxes: 61.5%
Here:
61%
State:
60%
(% for various income ranges: 59.6% for AGIs below $10k, 64.8% for AGIs $10k-25k, 60.1% for AGIs $25k-50k, 60.4% for AGIs $50k-75k, 59.1% for AGIs $75k-100k, 68.2% for AGIs over 100k)
Likely homosexual households (counted as self-reported same-sex unmarried-partner households)
Lesbian couples: 0.1% of all households
Gay men: 0.7% of all households
Household received Food Stamps/SNAP in the past 12 months: 2,307 Household did not receive Food Stamps/SNAP in the past 12 months: 10,419
Women who had a birth in the past 12 months: 213 (129 now married, 83 unmarried) Women who did not have a birth in the past 12 months: 7,505 (2,119 now married, 5,404 unmarried)
Housing units in zip code 48237 with a mortgage: 4,977 (376 second mortgage, 237 both second mortgage and home equity loan) Houses without a mortgage: 195
Median monthly owner costs for units with a mortgage: $1,314 Median monthly owner costs for units without a mortgage: $586
Residents with income below the poverty level in 2022:
This zip code:
14.7%
Whole state:
13.4%
Residents with income below 50% of the poverty level in 2022:
This zip code:
8.9%
Whole state:
6.9%
Median number of rooms in houses and condos:
Here:
6.2
State:
6.5
Median number of rooms in apartments:
Here:
4.7
State:
4.3
Notable locations in this zip code not listed on our city pages
Shopping Centers: Parkwoods Plaza Shopping Center (1), Oak Park Shopping Plaza Shopping Center (2), Green Eight Shopping Center (3). Display/hide their locations on the map
Churches in zip code 48237 include: Church of God Sabbatarian (A), Mar Addai Catholic Chaldean Church (B), First Baptist Church of Oak Park (C). Display/hide their locations on the map
3,012 married couples with children.
1,877 single-parent households (302 men, 1,575 women).
87.0% of residents of 48237 zip code speak English at home.
1.5% of residents speak Spanish at home (91% very well, 8% well, 2% not well).
4.3% of residents speak other Indo-European language at home (52% very well, 22% well, 21% not well, 5% not at all).
2.0% of residents speak Asian or Pacific Island language at home (58% very well, 15% well, 7% not well, 21% not at all).
4.8% of residents speak other language at home (43% very well, 38% well, 12% not well, 6% not at all).
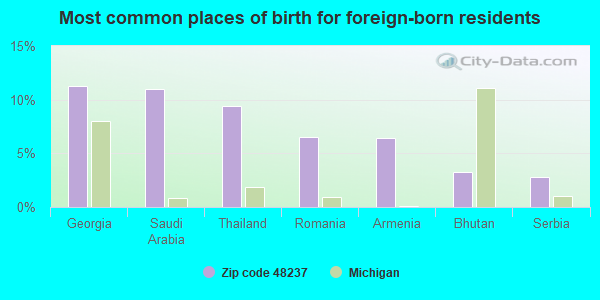
Foreign born population: 2,787 (9.5%) (66.5% of them are naturalized citizens)
This zip code:
9.5%
Whole state:
6.9%
11%Georgia
11%Saudi Arabia
9%Thailand
7%Romania
6%Armenia
3%Bhutan
3%Serbia
4%American
2%Russian
2%Irish
2%African
2%Polish
1%Syrian
1%German
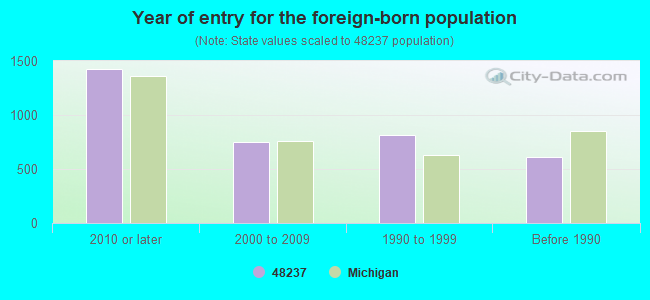
Year of entry for the foreign-born population
1,4272010 or later
7512000 to 2009
8141990 to 1999
607Before 1990
Major facilities with environmental interests located in this zip code:
ACADEMY OF MICHIGAN (20820 GREENFIELD in OAK PARK, MI)
(National Center for Education Statistics) - STATE ID-08524
ACADEMY OF OAK PARK (K-3) (21700 MARLOW STREET in OAK PARK, MI)
(National Center for Education Statistics) - STATE ID-08681
GENERAL PLATING INCORPORATED PLANT NUMBER 2 (21841 WYOMING in OAK PARK, MI)
AIR MINOR (AIRS/AFS) HAZARDOUS WASTE BIENNIAL REPORTER (Resource Conservation and Recovery Act (tracking hazardous waste)) (Resource Conservation and Recovery Act (tracking hazardous waste)) TRI REPORTER (Tracking of toxic chemicals releasing facilities) Business SIC classification: ELECTROPLATING, PLATING, POLISHING, ANODIZING, AND COLORING; COATING, ENGRAVING, AND ALLIED SERVICES Business NAICS classification: ELECTROPLATING, PLATING, POLISHING, ANODIZING, AND COLORING.
CHANDLER PARK ACADEMY-OAK PARK (13400 OAK PARK BOULEVARD in OAK PARK, MI)
(National Center for Education Statistics) - STATE ID-08915
AVERY EARLY CHILDHOOD CENTER (14700 W. LINCOLN STREET in OAK PARK, MI)
(National Center for Education Statistics) - STATE ID-04238 Organizations: BERKLEY SCHOOL DISTRICT (SCHOOL DISTRICT)
EINSTEIN ELEMENTARY SCHOOL (14001 NORTHEND AVENUE in OAK PARK, MI)
(National Center for Education Statistics) - STATE ID-01097 Organizations: OAK PARK CITY SCHOOL DISTRICT (SCHOOL DISTRICT)
MEL FARR FORD INC (26500 HARDING in OAK PARK, MI)
AIR MINOR (AIRS/AFS) (Resource Conservation and Recovery Act (tracking hazardous waste)) Business SIC classification: MOTOR VEHICLE DEALERS (NEW AND USED) Alternative names: FARR MEL FORD BODY SHOP
DETROIT NAME PLATE INC (13000 CAPITAL in OAK PARK, MI)
AIR MINOR (AIRS/AFS) Small Quantity Generators, between 100 kg and 1000 kg of hazardous waste/month (Resource Conservation and Recovery Act (tracking hazardous waste)) - notification Business SIC classification: COATING, ENGRAVING, AND ALLIED SERVICES Business NAICS classification: ALL OTHER MISCELLANEOUS FABRICATED METAL PRODUCT MANUFACTURING. Organizations: GREG RIVARD (CONTACT/OPERATOR)
Alternative names: DETROIT NAMEPLATE ETCHING CO
MI DEPT/MILITARY & VETERANS AFFAIRS (15000 WEST 8 MILE ROAD in OAK PARK, MI) . Federal Facility. U.S. ARMY
Large Quantity Generators, more that 1000 kg of hazardous waste/month (Resource Conservation and Recovery Act (tracking hazardous waste)) Organizations: MI DEPT OF MILIATRY AFFAIRS (CONTACT/OPERATOR)
, MICHIGAN STATE OF (CONTACT/OWNER)
Alternative names: DETROIT ARTILLERY ARMORY
GENERAL DIE CASTING INC (10750 CAPITAL in OAK PARK, MI)
COMPLIANCE ACTIVITY (Tracking inspections of insecticide, fungicide, and rodenticide, and toxic substances) (Resource Conservation and Recovery Act (tracking hazardous waste))
MI DEPT/TRANSPORTATION (10105 W 10 MILE RD in OAK PARK, MI)
(Resource Conservation and Recovery Act (tracking hazardous waste)) Organizations: MICH DEPT OF TRANSPORTATION (CONTACT/OPERATOR)
Alternative names: MIDOT PARCEL NO 2416 WEBERS NURSERY
AMERITECH CORP (26555 GREENFIELD in OAK PARK, MI)
(Resource Conservation and Recovery Act (tracking hazardous waste))
AMOCO OIL CO 0149 (22211 COOLIDGE HWY in OAK PARK, MI)
(Resource Conservation and Recovery Act (tracking hazardous waste)) Organizations: AMOCO OIL COMPANY (CONTACT/OWNER)
Housing units lacking complete plumbing facilities: 0.1% Housing units lacking complete kitchen facilities: 0.9%
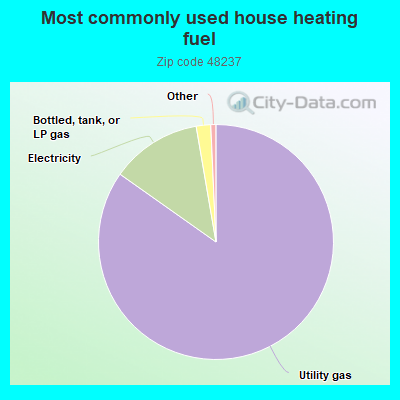
84.8%Utility gas
12.5%Electricity
2.0%Bottled, tank, or LP gas
Population in 1990: 28,884. Population change in the 1990s: +3,609 (+12.5%).
Place of birth for U.S.-born residents:
This state: 21,025
Northeast: 731
Midwest: 1,290
South: 2,342
West: 412
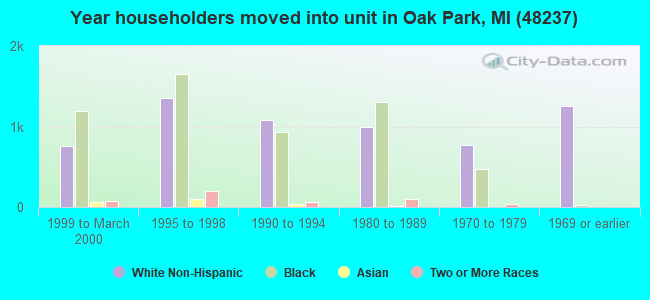
62% of the 48237 zip code residents lived in the same house 5 years ago. Out of people who lived in different houses, 47% lived in this county. Out of people who lived in different counties, 50% lived in Michigan.
88% of the 48237 zip code residents lived in the same house 1 year ago. Out of people who lived in different houses, 58% moved from this county. Out of people who lived in different houses, 26% moved from different county within same state. Out of people who lived in different houses, 9% moved from different state. Out of people who lived in different houses, 6% moved from abroad.
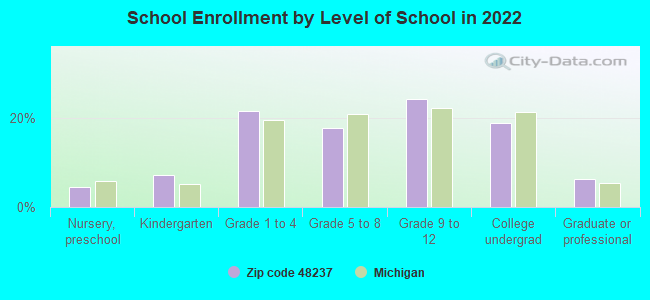
Private vs. public school enrollment:
Students in private schools in grades 1 to 8 (elementary and middle school): 569
Here:
23.0%
Michigan:
12.4%
Students in private schools in grades 9 to 12 (high school): 242
Here:
16.0%
Michigan:
9.8%
Students in private undergraduate colleges: 169
Here:
14.5%
Michigan:
14.9%
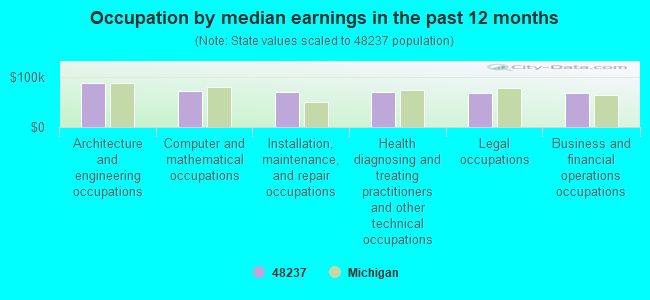
Occupation by median earnings in the past 12 months ($)
87,385Architecture and engineering occupations
71,736Computer and mathematical occupations
69,269Installation, maintenance, and repair occupations
69,087Health diagnosing and treating practitioners and other technical occupations
68,234Legal occupations
67,617Business and financial operations occupations
Companies with federal contracts located in this zip code (OAK PARK, MI):
MICHIGAN COMPUTER RESOURCES, I (25900 GREENFIELD ROAD; small business) : $3,391,454 in 27 contractsfrom 2001 to 2005
Contracts for Other ADP and Telecommunications Services (includes data storage on tapes, compact disks, etc.), ADPE System Configuration by Army, U.S. Army Corps of Engineers - civil program financing only Signed by year:2000: $0; 2001: $481,312; 2002: $323,045; 2003: $1,210,920; 2004: $631,900; 2005: $744,277; 2006: $0.
Biggest contracts:
$485,000 with Army for Other ADP and Telecommunications Services (includes data storage on tapes, compact disks, etc.). Signed on 2004-11-16. Completion date: 2004-11-17.
$447,577, same as above.Signed on 2005-11-17. Completion date: 2004-11-17.
$425,138, same as above.Signed on 2003-11-18. Completion date: 2004-11-17.
$425,138 with U.S. Army Corps of Engineers - civil program financing only for Other ADP and Telecommunications Services (includes data storage on tapes, compact disks, etc.). Signed on 2003-11-18. Completion date: 2004-11-17.
MASAI TECHNOLOGIES CORPORATION (25900 GREENFIELD ROAD; small business) : $2,646,000 in 6 contractsfrom 2003 to 2005
Contracts for ADP Facility Operation and Maintenance Services, Automated Information System Design and Integration Services by Army Signed by year:2000: $0; 2001: $0; 2002: $0; 2003: $310,000; 2004: $1,990,000; 2005: $346,000; 2006: $0.
Biggest contracts:
$815,000 with Army for ADP Facility Operation and Maintenance Services. Signed on 2004-05-21. Completion date: 2005-01-11.
$800,000 with Army for Automated Information System Design and Integration Services. Signed on 2004-12-28. Completion date: 2005-01-11.
$375,000 with Army for ADP Facility Operation and Maintenance Services. Taking place in MD. Signed on 2004-02-24. Completion date: 2005-01-11.
$310,000, same as above.Signed on 2003-12-31. Completion date: 2005-01-11.
CONTRACTORS MACHINERY COMPANY, (13200 NORTHEND AVE; small business)
$53,820 with Army for Miscellaneous Vehicular Components. Signed on 2001-11-08. Completion date: 2002-04-22.
WILLIAM AGBORUCHE & CO (P O BOX 47603; small business)
$18,000 with Air Force for Accounting Services (NOTE: New code created for Financial Services See R710 below). Taking place in SC. Signed on 2006-06-14. Completion date: 2006-09-30.
DALE L PRENTICE CO (26511 HARDING ST; small business) : $4,240 in 2 contractsfrom 2005 to 2006
$3,460 with EPA for Laboratory Equipment and Supplies. Taking place in CO. Signed on 2005-03-08. Completion date: 2005-03-15.
$780 with Army for Maintenance, Repair and Rebuilding of Equipment -- Rope, Cable, Chain, and Fittings. Signed on 2006-01-31. Completion date: 2006-02-28.
ZITEK CORPORATION (12950 W 8 MILE RD; small business)
$2,976 with Navy for Non-nuclear Ship Repair (West) Ship repair (including overhauls and conversions) performed on. non-nuclear propelled and nonpropelled ships west of the 108th meridian. Taking place in CA. Signed on 2005-01-20. Completion date: 2005-02-25.
KOEPPLINGERSBAKERY INC (15200 W 8 MILE RD; small business) : $2,364 in 2 contractsfrom 2004 to 2005
$2,044 with Defense Commissary Agency for Food Items For Resale. Signed on 2004-10-01. Completion date: 2005-02-28.
$320, same as above.Signed on 2005-01-01. Completion date: 2005-03-31.
H O TRERICE CO (12950 W 8 MILE RD; small business) : $105 in 3 contractsfrom 2003 to 2004
$4,249 with Navy for Switches. Signed on 2003-10-29. Completion date: 2003-10-30.
$105 with Army for Hose, Pipe, Tube, Lubrication, and Railing Fittings. Signed on 2004-04-13. Completion date: 2004-04-20.
-$4,249 with Navy for Electrical and Electronic assemblies, Boards, Cards, and Associated Hardware. Signed on 2004-07-19. Completion date: 2004-07-19.
NCOC, INC (21251 MEYERS ROAD)
$0 with Army for Oils and Greases: Cutting, Lubricating, and Hydraulic. Signed on 2001-12-03. Completion date: 2002-12-02.
Top industries in this zip code by the number of employees in 2005:
Administrative and Support and Waste Management and Remediation Services: Security Guards and Patrol Services (250-499 employees: 1 establishment, 100-249 employees: 1 establishment, 50-99 employees: 1 establishment, 20-49 employees: 1 establishment, 10-19 employees: 2 establishments, 5-9 employees: 1 establishment)
Health Care and Social Assistance: Home Health Care Services (250-499: 1, 20-49: 4, 10-19: 2, 5-9: 2, 1-4: 6)
Construction: Other Building Equipment Contractors (100-249: 2)
2002 - 2018 National Fire Incident Reporting System (NFIRS) incidents
According to the data from the years 2002 - 2018 the average number of fires per year is 93. The highest number of fires - 135 took place in 2008, and the least - 60 in 2015. The data has a growing trend.
When looking into fire subcategories, the most reports belonged to: Structure Fires (61.1%), and Mobile Property/Vehicle Fires (19.0%).
Fire incident types reported to NFIRS in Zip Code 48237
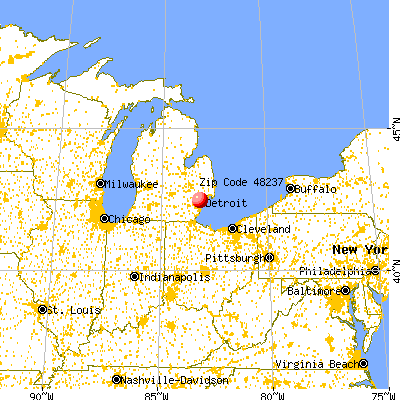


 Nearest zip codes: 48070, 48072, 48069, 48235, 48220, 48075.


 According to the data from the years 2002 - 2018 the average number of fires per year is 93. The highest number of fires - 135 took place in 2008, and the least - 60 in 2015. The data has a growing trend.
 When looking into fire subcategories, the most reports belonged to: Structure Fires (61.1%), and Mobile Property/Vehicle Fires (19.0%).