Estimated zip code population in 2022: 39,881 Zip code population in 2010: 39,415 Zip code population in 2000: 31,215
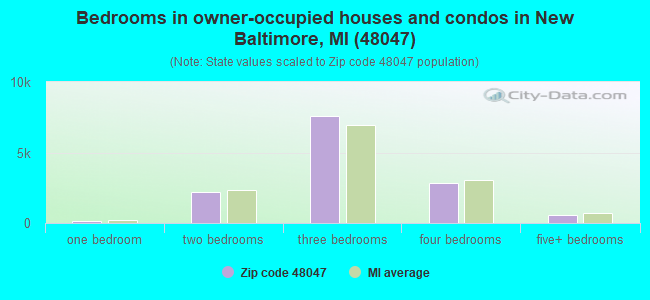
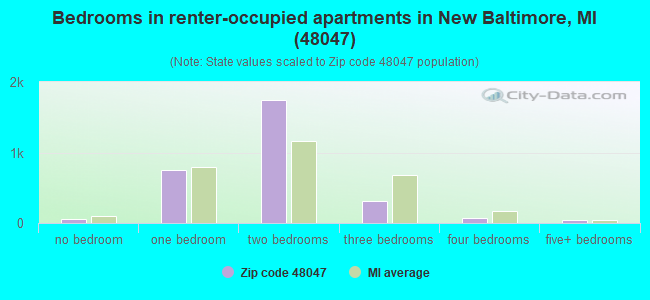
Houses and condos: 16,675 Renter-occupied apartments: 2,933
% of renters here:
18%
State:
27%
March 2022 cost of living index in zip code 48047: 95.8 (near average, U.S. average is 100)
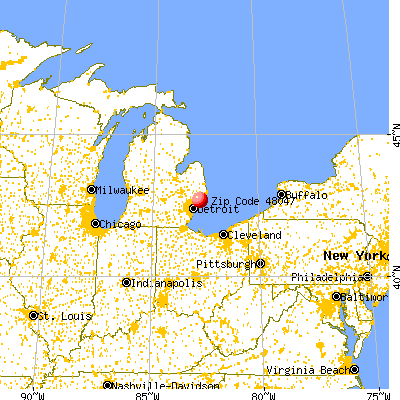
Land area: 18.0 sq. mi. Water area: 5.2 sq. mi.
Population density: 2,212 people per square mile
(low).
OSM Map
General Map
Google Map
MSN Map
OSM Map
General Map
Google Map
MSN Map
OSM Map
General Map
Google Map
MSN Map
OSM Map
General Map
Google Map
MSN Map
Please wait while loading the map...
Real estate property taxes paid for housing units in 2022:
This zip code:
1.2% ($3,710)
Michigan:
1.2% ($2,746)
Median real estate property taxes paid for housing units with mortgages in 2022: $3,801 (1.2%) Median real estate property taxes paid for housing units with no mortgage in 2022: $3,566 (1.2%)
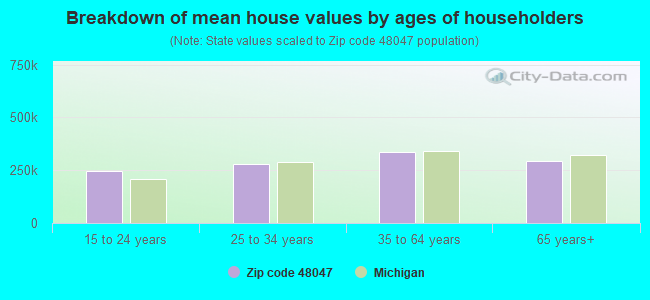
Estimated median house/condo value in 2022: $307,085
48047:
$307,085
Michigan:
$224,400
According to our research of Michigan and other state lists, there were 64 registered sex offenders living in 48047 zip code as of April 27, 2024. The ratio of all residents to sex offenders in zip code 48047 is 639 to 1. The ratio of registered sex offenders to all residents in this zip code is lower than the state average.
Median resident age:
This zip code:
42.6 years
Michigan median age:
40.3 years
Average household size:
This zip code:
2.4 people
Michigan:
2.4 people
Averages for the 2020 tax year for zip code 48047, filed in 2021:
Average Adjusted Gross Income (AGI) in 2020: $74,794 (Individual Income Tax Returns)
Here:
$74,794
State:
$68,945
Salary/wage: $64,288 (reported on 81.0% of returns)
Here:
$64,288
State:
$57,142
(% of AGI for various income ranges: 1011.9% for AGIs below $25k, 3157.1% for AGIs $25k-50k, 6134.9% for AGIs $50k-75k, 8934.0% for AGIs $75k-100k, 17218.5% for AGIs $100k-200k, 63450.7% for AGIs over 200k)
Taxable interest for individuals: $1,484 (reported on 32.0% of returns)
This zip code:
$1,484
Michigan:
$1,630
(% of AGI for various income ranges: 17.1% for AGIs below $25k, 22.5% for AGIs $25k-50k, 35.8% for AGIs $50k-75k, 52.7% for AGIs $75k-100k, 85.8% for AGIs $100k-200k, 1511.7% for AGIs over 200k)
Ordinary dividends: $3,584 (reported on 20.1% of returns)
Here:
$3,584
State:
$6,972
(% of AGI for various income ranges: 22.7% for AGIs below $25k, 37.1% for AGIs $25k-50k, 75.8% for AGIs $50k-75k, 89.6% for AGIs $75k-100k, 146.1% for AGIs $100k-200k, 1951.0% for AGIs over 200k)
Net capital gain/loss in AGI: +$10,950 (reported on 18.6% of returns)
Here:
+$10,950
State:
+$20,064
(% of AGI for various income ranges: 10.1% for AGIs below $25k, 24.9% for AGIs $25k-50k, 88.3% for AGIs $50k-75k, 130.7% for AGIs $75k-100k, 292.5% for AGIs $100k-200k, 9883.3% for AGIs over 200k)
Profit/loss from business: +$9,692 (reported on 13.5% of returns)
Here:
+$9,692
State:
+$11,172
(% of AGI for various income ranges: 72.0% for AGIs below $25k, 88.8% for AGIs $25k-50k, 148.9% for AGIs $50k-75k, 185.5% for AGIs $75k-100k, 243.8% for AGIs $100k-200k, 2840.0% for AGIs over 200k)
Taxable individual retirement arrangement distribution: $16,692 (reported on 10.2% of returns)
48047:
$16,692
Michigan:
$19,803
(% of AGI for various income ranges: 59.8% for AGIs below $25k, 122.9% for AGIs $25k-50k, 236.5% for AGIs $50k-75k, 317.8% for AGIs $75k-100k, 479.0% for AGIs $100k-200k, 1849.7% for AGIs over 200k)
Self-employed (Keogh) retirement plans: $19,500 (reported on 0.2% of returns)
48047:
$19,500
Michigan:
$25,132
(% of AGI for various income ranges: 15.6% for AGIs $100k-200k, 179.0% for AGIs over 200k)
Total itemized deductions: $26,641 (reported on 7.7% of returns)
Here:
$26,641
State:
$34,117
(% of AGI for various income ranges: 34.7% for AGIs below $25k, 82.1% for AGIs $25k-50k, 264.6% for AGIs $50k-75k, 417.4% for AGIs $75k-100k, 572.9% for AGIs $100k-200k, 3526.7% for AGIs over 200k)
Charity contributions: $7,243 (reported on 6.3% of returns)
Here:
$7,243
State:
$13,548
(% of AGI for various income ranges: 2.4% for AGIs below $25k, 10.1% for AGIs $25k-50k, 36.6% for AGIs $50k-75k, 60.4% for AGIs $75k-100k, 119.7% for AGIs $100k-200k, 1362.3% for AGIs over 200k)
Taxes paid: $8,291 (reported on 7.6% of returns)
48047:
$8,291
State:
$7,972
(% of AGI for various income ranges: 8.3% for AGIs below $25k, 23.7% for AGIs $25k-50k, 85.7% for AGIs $50k-75k, 139.8% for AGIs $75k-100k, 195.1% for AGIs $100k-200k, 834.7% for AGIs over 200k)
Earned income credit: $1,946 (reported on 8.0% of returns)
Here:
$1,946
State:
$2,251
(% of AGI for various income ranges: 44.6% for AGIs below $25k, 40.6% for AGIs $25k-50k, 0.5% for AGIs $50k-75k)
Percentage of individuals using paid preparers for their 2020 taxes: 93.7%
Here:
94%
State:
93%
(% for various income ranges: 92.6% for AGIs below $25k, 94.1% for AGIs $25k-50k, 94.3% for AGIs $50k-75k, 94.0% for AGIs $75k-100k, 94.3% for AGIs $100k-200k, 94.3% for AGIs over 200k)
Averages for the 2012 tax year for zip code 48047, filed in 2013:
Average Adjusted Gross Income (AGI) in 2012: $60,989 (Individual Income Tax Returns)
Here:
$60,989
State:
$55,609
Salary/wage: $54,744 (reported on 85.0% of returns)
Here:
$54,744
State:
$46,782
(% of AGI for various income ranges: 69.7% for AGIs below $25k, 73.5% for AGIs $25k-50k, 75.5% for AGIs $50k-75k, 81.6% for AGIs $75k-100k, 84.9% for AGIs $100k-200k, 53.8% for AGIs over 200k)
Taxable interest for individuals: $1,146 (reported on 35.2% of returns)
This zip code:
$1,146
Michigan:
$1,491
(% of AGI for various income ranges: 1.2% for AGIs below $25k, 0.8% for AGIs $25k-50k, 0.5% for AGIs $50k-75k, 0.4% for AGIs $75k-100k, 0.4% for AGIs $100k-200k, 1.5% for AGIs over 200k)
Ordinary dividends: $2,757 (reported on 20.8% of returns)
Here:
$2,757
State:
$6,225
(% of AGI for various income ranges: 1.6% for AGIs below $25k, 0.9% for AGIs $25k-50k, 0.7% for AGIs $50k-75k, 0.7% for AGIs $75k-100k, 0.5% for AGIs $100k-200k, 2.3% for AGIs over 200k)
Net capital gain/loss in AGI: +$2,732 (reported on 15.6% of returns)
Here:
+$2,732
State:
+$9,326
(% of AGI for various income ranges: 0.3% for AGIs $75k-100k, 0.4% for AGIs $100k-200k, 3.8% for AGIs over 200k)
Profit/loss from business: +$10,255 (reported on 12.9% of returns)
Here:
+$10,255
State:
+$11,523
(% of AGI for various income ranges: 6.4% for AGIs below $25k, 2.9% for AGIs $25k-50k, 2.1% for AGIs $50k-75k, 1.7% for AGIs $75k-100k, 1.5% for AGIs $100k-200k, 1.9% for AGIs over 200k)
Taxable individual retirement arrangement distribution: $13,496 (reported on 10.6% of returns)
48047:
$13,496
Michigan:
$15,298
(% of AGI for various income ranges: 3.3% for AGIs below $25k, 2.8% for AGIs $25k-50k, 2.5% for AGIs $50k-75k, 2.4% for AGIs $75k-100k, 2.1% for AGIs $100k-200k, 1.9% for AGIs over 200k)
Self-employment retirement plans: $18,100 (reported on 0.2% of returns)
48047:
$18,100
Michigan:
$20,834
(% of AGI for various income ranges: 0.2% for AGIs below $25k, 0.1% for AGIs $100k-200k)
Total itemized deductions: $19,793 (19% of AGI, reported on 42.3% of returns)
Here:
$19,793
State:
$21,628
Here:
19.4% of AGI
State:
18.4% of AGI
(% of AGI for various income ranges: 10.4% for AGIs below $25k, 11.4% for AGIs $25k-50k, 14.6% for AGIs $50k-75k, 15.1% for AGIs $75k-100k, 15.1% for AGIs $100k-200k, 11.0% for AGIs over 200k)
Charity contributions: $2,337 (reported on 37.1% of returns)
Here:
$2,337
State:
$4,225
(% of AGI for various income ranges: 0.7% for AGIs below $25k, 1.0% for AGIs $25k-50k, 1.5% for AGIs $50k-75k, 1.5% for AGIs $75k-100k, 1.7% for AGIs $100k-200k, 1.2% for AGIs over 200k)
Taxes paid: $7,644 (reported on 42.3% of returns)
48047:
$7,644
State:
$8,327
(% of AGI for various income ranges: 2.3% for AGIs below $25k, 3.4% for AGIs $25k-50k, 4.8% for AGIs $50k-75k, 5.6% for AGIs $75k-100k, 6.3% for AGIs $100k-200k, 5.7% for AGIs over 200k)
Earned income credit: $2,015 (reported on 11.1% of returns)
Here:
$2,015
State:
$2,306
(% of AGI for various income ranges: 4.2% for AGIs below $25k, 0.8% for AGIs $25k-50k)
Percentage of individuals using paid preparers for their 2012 taxes: 59.5%
Here:
60%
State:
57%
(% for various income ranges: 53.7% for AGIs below $25k, 58.3% for AGIs $25k-50k, 64.8% for AGIs $50k-75k, 64.2% for AGIs $75k-100k, 62.4% for AGIs $100k-200k, 83.8% for AGIs over 200k)
Averages for the 2004 tax year for zip code 48047, filed in 2005:
Average Adjusted Gross Income (AGI) in 2004: $56,938 (Individual Income Tax Returns)
Here:
$56,938
State:
$48,204
Salary/wage: $52,768 (reported on 88.8% of returns)
Here:
$52,768
State:
$42,791
(% of AGI for various income ranges: 100.7% for AGIs below $10k, 71.3% for AGIs $10k-25k, 77.6% for AGIs $25k-50k, 85.1% for AGIs $50k-75k, 90.7% for AGIs $75k-100k, 78.4% for AGIs over 100k)
Taxable interest for individuals: $1,318 (reported on 55.1% of returns)
This zip code:
$1,318
Michigan:
$1,725
(% of AGI for various income ranges: 5.5% for AGIs below $10k, 2.5% for AGIs $10k-25k, 1.4% for AGIs $25k-50k, 0.9% for AGIs $50k-75k, 0.5% for AGIs $75k-100k, 1.6% for AGIs over 100k)
Taxable dividends: $1,525 (reported on 27.2% of returns)
Here:
$1,525
State:
$3,420
(% of AGI for various income ranges: 3.7% for AGIs below $10k, 1.7% for AGIs $10k-25k, 1.0% for AGIs $25k-50k, 0.6% for AGIs $50k-75k, 0.4% for AGIs $75k-100k, 0.7% for AGIs over 100k)
Net capital gain/loss: +$5,139 (reported on 19.9% of returns)
Here:
+$5,139
State:
+$8,532
(% of AGI for various income ranges: -0.8% for AGIs below $10k, -0.3% for AGIs $10k-25k, 0.2% for AGIs $25k-50k, 0.2% for AGIs $50k-75k, 0.3% for AGIs $75k-100k, 4.3% for AGIs over 100k)
Profit/loss from business: +$9,262 (reported on 12.8% of returns)
Here:
+$9,262
State:
+$9,547
(% of AGI for various income ranges: 4.4% for AGIs below $10k, 4.6% for AGIs $10k-25k, 2.4% for AGIs $25k-50k, 2.0% for AGIs $50k-75k, 1.2% for AGIs $75k-100k, 2.2% for AGIs over 100k)
IRA payment deduction: $2,841 (reported on 2.3% of returns)
48047:
$2,841
Michigan:
$2,875
(% of AGI for various income ranges: 0.2% for AGIs below $10k, 0.1% for AGIs $10k-25k, 0.2% for AGIs $25k-50k, 0.1% for AGIs $50k-75k, 0.1% for AGIs $75k-100k, 0.1% for AGIs over 100k)
Self-employed pension: $10,845 (reported on 0.5% of returns)
Here:
$10,845
Michigan:
$13,826
(% of AGI for various income ranges: 0.0% for AGIs $25k-50k, 0.1% for AGIs $50k-75k, 0.1% for AGIs $75k-100k, 0.2% for AGIs over 100k)
Total itemized deductions: $18,716 (22% of AGI, reported on 54.0% of returns)
Here:
$18,716
State:
$18,509
Here:
22.0% of AGI
State:
20.7% of AGI
(% of AGI for various income ranges: 14.9% for AGIs below $10k, 13.2% for AGIs $10k-25k, 17.1% for AGIs $25k-50k, 20.8% for AGIs $50k-75k, 19.9% for AGIs $75k-100k, 15.9% for AGIs over 100k)
Charity contributions deductions: $2,185 (3% of AGI, reported on 50.1% of returns)
Here:
$2,185
State:
$3,365
Here:
2.5% of AGI
State:
3.6% of AGI
(% of AGI for various income ranges: 0.7% for AGIs below $10k, 1.2% for AGIs $10k-25k, 1.6% for AGIs $25k-50k, 2.0% for AGIs $50k-75k, 2.1% for AGIs $75k-100k, 2.0% for AGIs over 100k)
Total tax: $7,705 (reported on 82.3% of returns)
48047:
$7,705
State:
$7,691
(% of AGI for various income ranges: 2.7% for AGIs below $10k, 4.5% for AGIs $10k-25k, 7.1% for AGIs $25k-50k, 8.1% for AGIs $50k-75k, 9.3% for AGIs $75k-100k, 16.2% for AGIs over 100k)
Earned income credit: $1,540 (reported on 7.7% of returns)
Here:
$1,540
State:
$1,737
Percentage of individuals using paid preparers for their 2004 taxes: 62.0%
Here:
62%
State:
60%
(% for various income ranges: 51.7% for AGIs below $10k, 61.9% for AGIs $10k-25k, 62.8% for AGIs $25k-50k, 65.8% for AGIs $50k-75k, 63.4% for AGIs $75k-100k, 66.3% for AGIs over 100k)
Likely homosexual households (counted as self-reported same-sex unmarried-partner households)
Lesbian couples: 0.4% of all households
Gay men: 0.0% of all households
Household received Food Stamps/SNAP in the past 12 months: 1,091 Household did not receive Food Stamps/SNAP in the past 12 months: 15,066
Women who had a birth in the past 12 months: 488 (414 now married, 80 unmarried) Women who did not have a birth in the past 12 months: 8,601 (3,622 now married, 4,973 unmarried)
Housing units in zip code 48047 with a mortgage: 9,433 (1,279 second mortgage, 1,026 both second mortgage and home equity loan) Houses without a mortgage: 602
Median monthly owner costs for units with a mortgage: $1,681 Median monthly owner costs for units without a mortgage: $709
Residents with income below the poverty level in 2022:
This zip code:
5.8%
Whole state:
13.4%
Residents with income below 50% of the poverty level in 2022:
This zip code:
3.0%
Whole state:
6.9%
Median number of rooms in houses and condos:
Here:
6.4
State:
6.5
Median number of rooms in apartments:
Here:
3.9
State:
4.3
Notable locations in this zip code not listed on our city pages
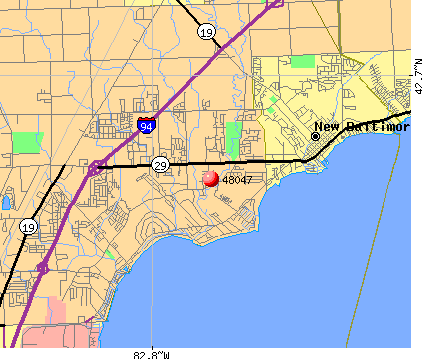
Notable locations in zip code 48047: Salt River Golf Course (A), New Baltimore Police Department (B), New Baltimore Library (C), New Baltimore Fire Department (D), Henry Ford Medical Center - New Baltimore (E), New Baltimore Fire Department (F), Chesterfield Township Fire Department Station 2 (G), Chesterfield Township Fire Department Station 3 (H). Display/hide their locations on the map
Churches in zip code 48047 include: Saint John's Lutheran Church (A), New Hope Full Gospel Church (B), First Congregational Church (C), First Baptist Church (D), Christ Lutheran Church (E), Bethel Temple Church (F), Saint Mary Queen of Creation Church (G). Display/hide their locations on the map
Streams, rivers, and creeks: Crapaud Creek (A), Fuller Drain (B), Wacker Drain (C), Marsac Creek (D), Peltier Drain (E), Harms Drain (F), Fish Creek (G), Sutherland Oemig Drain (H), Auvase Creek (I). Display/hide their locations on the map
Parks in zip code 48047 include: Grand Pacific House Historical Marker (1), Kolping Chapel Historical Marker (2), New Baltimore Historical Marker (3), Saint John's Lutheran Church Historical Marker (4), Walter and Mary Burke Park (5), Kolping Park (6). Display/hide their locations on the map
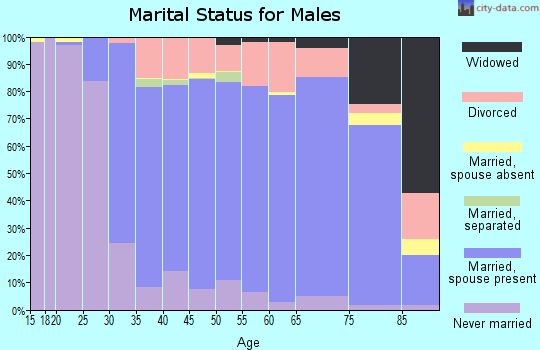
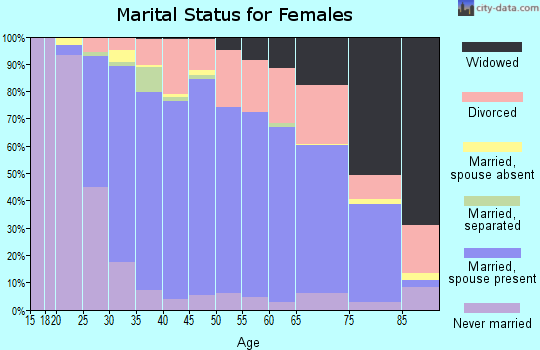
6,024 married couples with children.
1,475 single-parent households (266 men, 1,209 women).
96.0% of residents of 48047 zip code speak English at home.
1.0% of residents speak Spanish at home (70% very well, 25% well, 5% not well).
2.0% of residents speak other Indo-European language at home (69% very well, 21% well, 10% not well).
0.3% of residents speak Asian or Pacific Island language at home (69% very well, 27% well, 4% not well).
0.3% of residents speak other language at home (100% very well).
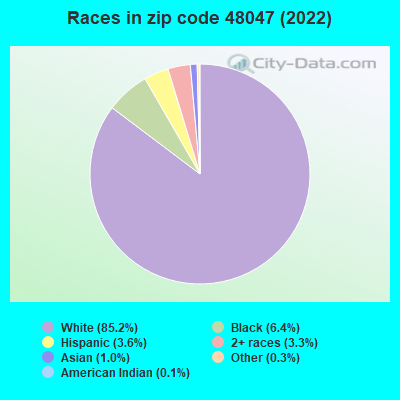
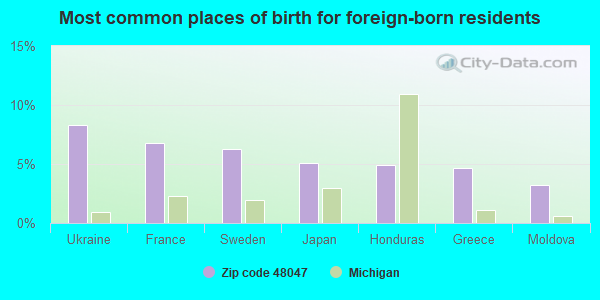
Foreign born population: 1,278 (3.2%) (73.1% of them are naturalized citizens)
This zip code:
3.2%
Whole state:
6.9%
8%Ukraine
7%France
6%Sweden
5%Japan
5%Honduras
5%Greece
3%Moldova
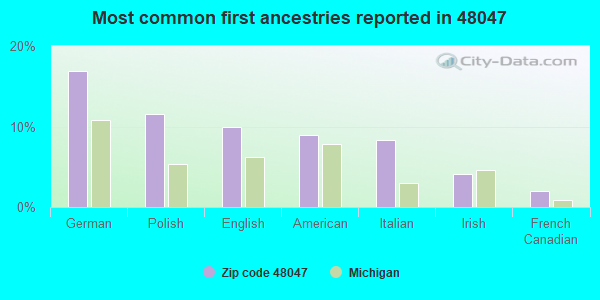
17%German
12%Polish
10%English
9%American
8%Italian
4%Irish
2%French Canadian
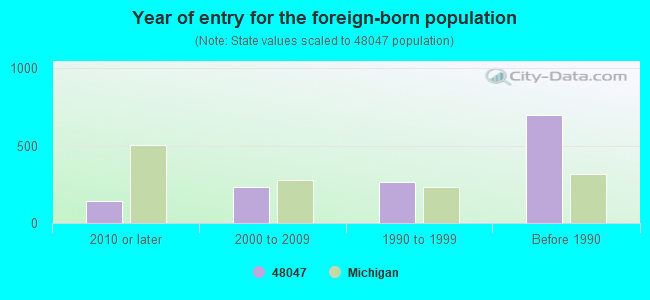
Year of entry for the foreign-born population
1432010 or later
2312000 to 2009
2661990 to 1999
698Before 1990
Major facilities with environmental interests located in this zip code:
ANCHOR BAY HIGH SCHOOL (48650 SUGARBUSH ROAD in NEW BALTIMORE, MI)
(Geographic Names Information System) (National Center for Education Statistics) - STATE ID-00089 Organizations: ANCHOR BAY SCHOOL DISTRICT (SCHOOL DISTRICT)
ANCHOR BAY LIGHTHOUSE MIDDLE SCHOOL (51880 WASHINGTON STREET in NEW BALTIMORE, MI)
(National Center for Education Statistics) - STATE ID-08710 Organizations: ANCHOR BAY SCHOOL DISTRICT (SCHOOL DISTRICT)
ANCHOR BAY MIDDLE SCHOOL (52805 ASHLEY STREET in NEW BALTIMORE, MI)
(National Center for Education Statistics) - STATE ID-00088 Organizations: ANCHOR BAY SCHOOL DISTRICT (SCHOOL DISTRICT)
ASHLEY ELEMENTARY SCHOOL (52347 ASHLEY STREET in NEW BALTIMORE, MI)
(National Center for Education Statistics) - STATE ID-00091 Organizations: ANCHOR BAY SCHOOL DISTRICT (SCHOOL DISTRICT)
GREAT OAKS ELEMENTARY SCHOOL (32900 24 MILE ROAD in NEW BALTIMORE, MI)
(National Center for Education Statistics) - STATE ID-06766 Organizations: ANCHOR BAY SCHOOL DISTRICT (SCHOOL DISTRICT)
GREEN ELEMENTARY SCHOOL (47260 SUGARBUSH ROAD in CHESTERFIELD, MI)
(National Center for Education Statistics) - STATE ID-05223 Organizations: L'ANSE CREUSE PUBLIC SCHOOLS (SCHOOL DISTRICT)
AMOCO OIL CO 3754 (29050 23 MILE RD in NEW BALTIMORE, MI)
(Resource Conservation and Recovery Act (tracking hazardous waste)) Organizations: AMOCO OIL COMPANY (CONTACT/OPERATOR)
FIBERGLASS REPAIRS INC (28255 KEHRIG DR in NEW BALTIMORE, MI)
(Resource Conservation and Recovery Act (tracking hazardous waste)) Organizations: BURT MICHAEL D (CONTACT/OWNER)
DETROIT TAPE AND LABEL (45200 JEFFERSON in NEW BALTIMORE, MI)
(Resource Conservation and Recovery Act (tracking hazardous waste)) Business NAICS classification: COATED AND LAMINATED PAPER MANUFACTURING.
DICKS FRIENDLY SERV INC (35574 23 MILE RD in NEW BALTIMORE, MI)
(Resource Conservation and Recovery Act (tracking hazardous waste))
EMRO PROPANE CO (51897 N GRATIOT in NEW BALTIMORE, MI)
(Resource Conservation and Recovery Act (tracking hazardous waste)) Organizations: EMRO PROPANE COMPANY (CONTACT/OWNER)
ANCARD INDUSTRIES LLC (46340 CONTINENTAL DR in CHESTERFIELD, MI)
(Resource Conservation and Recovery Act (tracking hazardous waste)) Business NAICS classification: ALL OTHER BUSINESS SUPPORT SERVICES.
ARGUS SERVICE CORPORATION (46410 CONTINENTAL DRIVE in CHESTERFIELD, MI)
Conditionally Exempt Small Quantity Generators, less than 100 kg/month of hazardous waste (Resource Conservation and Recovery Act (tracking hazardous waste)) Organizations: BRIAN MCEVOY (CONTACT/OPERATOR)
, CONTINENTAL REAL ESTATE (CONTACT/OWNER)
Housing units lacking complete plumbing facilities: 0.4% Housing units lacking complete kitchen facilities: 0.5%
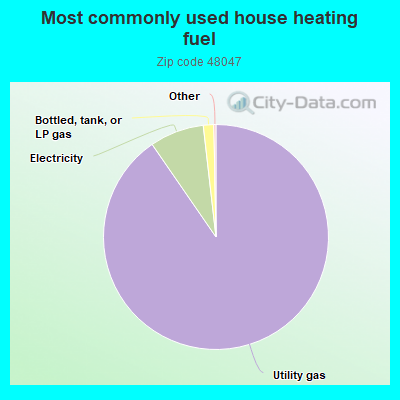
90.3%Utility gas
7.8%Electricity
1.5%Bottled, tank, or LP gas
Population in 1990: 22,480. Population change in the 1990s: +8,735 (+38.9%).
Place of birth for U.S.-born residents:
This state: 34,416
Northeast: 990
Midwest: 1,289
South: 1,299
West: 416
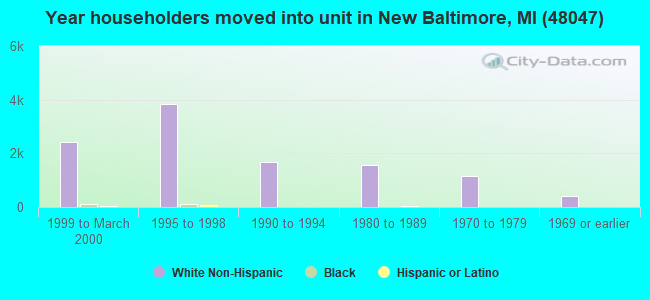
46% of the 48047 zip code residents lived in the same house 5 years ago. Out of people who lived in different houses, 64% lived in this county. Out of people who lived in different counties, 50% lived in Michigan.
92% of the 48047 zip code residents lived in the same house 1 year ago. Out of people who lived in different houses, 71% moved from this county. Out of people who lived in different houses, 14% moved from different county within same state. Out of people who lived in different houses, 14% moved from different state.
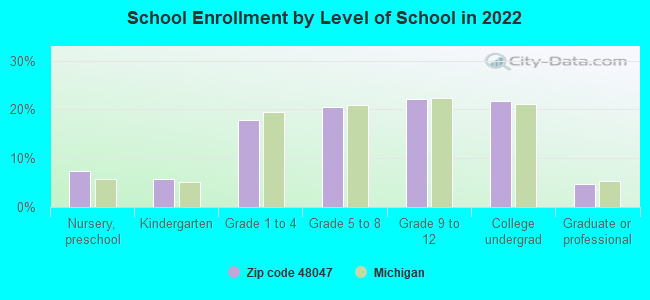
Private vs. public school enrollment:
Students in private schools in grades 1 to 8 (elementary and middle school): 193
Here:
5.7%
Michigan:
12.4%
Students in private schools in grades 9 to 12 (high school): 226
Here:
11.5%
Michigan:
9.8%
Students in private undergraduate colleges: 272
Here:
14.2%
Michigan:
14.9%
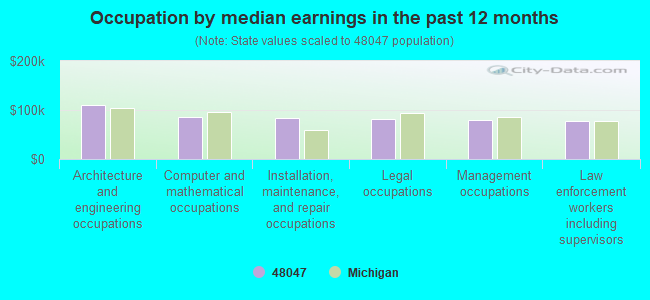
Occupation by median earnings in the past 12 months ($)
110,169Architecture and engineering occupations
86,277Computer and mathematical occupations
83,536Installation, maintenance, and repair occupations
81,819Legal occupations
79,053Management occupations
77,084Law enforcement workers including supervisors
Companies with biggest federal contracts located in this zip code:
SCHENA ROOFING & SHEET METAL C (28299 KEHRIG DRIVE in NEW BALTIMORE, MI; small business) : $1,088,761 in 13 contractsfrom 2000 to 2005
Contracts for Maintenance, Repair or Alteration of Real Property -- Other Airfield Structures, Maintenance, Repair or Alteration of Real Property -- Other Administrative Facilities and Service Buildings, Maintenance, Repair or Alteration of Real Property -- Recreational Buildings, Maintenance, Repair or Alteration of Real Property -- Maintenance Buildings by Army Signed by year:2000: $41,542; 2001: $0; 2002: $260,692; 2003: $641,947; 2004: $144,380; 2005: $200; 2006: $0.
Biggest contracts:
$340,646 with Army for Maintenance, Repair or Alteration of Real Property -- Other Airfield Structures. Signed on 2003-09-29. Completion date: 2004-04-30.
$301,301, same as above.Signed on 2003-09-29. Completion date: 2004-04-30.
$169,342 with Army for Maintenance, Repair or Alteration of Real Property -- Other Administrative Facilities and Service Buildings. Signed on 2002-09-29. Completion date: 2002-12-31.
$106,249 with Army for Maintenance, Repair or Alteration of Real Property -- Other Airfield Structures. Signed on 2004-11-30. Completion date: 2005-03-31.
INTERNATIONAL STAR CORPORATION (30845 23 MILE RD in NEW BALTIMORE, MI; small business) : $694,085 in 12 contractsfrom 2004 to 2006
Contracts for Safety and Rescue Equipment, Nuts and Washers, Vehicular Cab, Body, and Frame Structural Components, Vehicular Furniture and Accessories, and moreby Army, Defense Logistics Agency Signed by year:2000: $0; 2001: $0; 2002: $0; 2003: $0; 2004: $119,980; 2005: $25,629; 2006: $548,476.
Biggest contracts:
$436,195 with Army for Safety and Rescue Equipment. Signed on 2006-03-07. Completion date: 2007-08-02.
$104,219, same as above.Signed on 2006-06-28. Completion date: 2010-12-31.
$87,000 with Defense Logistics Agency for Nuts and Washers. Signed on 2004-05-17. Completion date: 2004-07-29.
$27,895 with Defense Logistics Agency for Vehicular Cab, Body, and Frame Structural Components. Signed on 2004-03-12. Completion date: 2004-06-05.
B&M MACHINE REBUILDERS INC. (51517 INDUSTRIAL DR. in NEW BALTIMORE, MI)
$244,000 with Army for Planers and Shapers. Signed on 2000-02-10. Completion date: 2000-12-29.
MOTOR CITY FLOOR COVERING (35223 23 MILE RD in NEW BALTIMORE, MI; small business) : $142,928 in 12 contractsfrom 2002 to 2005
Contracts for Floor Coverings by Army Signed by year:2000: $0; 2001: $0; 2002: $114,081; 2003: $11,874; 2004: $12,837; 2005: $4,136; 2006: $0.
Biggest contracts:
$71,972 with Army for Floor Coverings. Signed on 2002-09-30. Completion date: 2002-10-30.
$20,083, same as above.Signed on 2002-09-30. Completion date: 2002-10-30.
$12,837, same as above.Signed on 2004-09-27. Completion date: 2004-11-11.
$6,555, same as above.Signed on 2002-03-07. Completion date: 2002-03-19.
R S E INC (51529 BIRCH ST in NEW BALTIMORE, MI; small business)
$125,040 with Army for Safety and Rescue Equipment. Signed on 2006-06-05. Completion date: 2008-06-30.
PAMELA R HARRIS (53051 PINE CREEK DR in CHESTERFIELD, MI; small business) : $109,416 in 5 contractsfrom 2001 to 2005
Contracts for Other Management Support Services, Education -- Management and Support (R&D) by Army Signed by year:2000: $0; 2001: $40,000; 2002: $0; 2003: $43,050; 2004: $43,500; 2005: -$17,134; 2006: $0.
Biggest contracts:
$43,500 with Army for Other Management Support Services. Signed on 2004-06-04. Completion date: 2004-06-30.
$43,050, same as above.Signed on 2003-06-04. Completion date: 2004-06-30.
$40,000, same as above.Signed on 2001-06-20. Completion date: 2003-06-30.
-$6,259 with Army for Education -- Management and Support (R&D). Signed on 2005-07-25. Completion date: 2001-07-31.
ARGUS SUPPLY COMPANY (46400 CONTINENTAL DR in CHESTERFIELD, MI) : $95,922 in 8 contractsfrom 2001 to 2005
Contracts for Miscellaneous Special Industry Machinery, Safety and Rescue Equipment, Material Handling Equipment, Nonself-Propelled, Equipment and Materials Testing -- Miscellaneous, and moreby Army, Air Force, U.S. Army Corps of Engineers - civil program financing only Signed by year:2000: $0; 2001: $5,900; 2002: $15,905; 2003: $0; 2004: $49,107; 2005: $25,010; 2006: $0.
Biggest contracts:
$19,830 with Army for Miscellaneous Special Industry Machinery. Signed on 2004-04-23. Completion date: 2004-09-30.
$15,905 with Army for Safety and Rescue Equipment. Signed on 2002-09-30. Completion date: 2002-10-30.
$15,513 with Air Force for Material Handling Equipment, Nonself-Propelled. Taking place in AZ. Signed on 2005-09-16. Completion date: 2005-11-30.
$9,835 with Army for Equipment and Materials Testing -- Miscellaneous. Taking place in GA. Signed on 2004-08-25. Completion date: 2004-09-02.
ALLIANCE GAS SYSTEMS INC (46449 CONTINENTAL DR in CHESTERFIELD, MI; small business) : $79,434 in 2 contractsfrom 2003 to 2005
$80,200 with Air Force for Centrifugals, Separators, and Pressure and Vacuum Filters. Signed on 2003-09-29. Completion date: 2003-12-08.
-$766, same as above.Signed on 2005-02-14. Completion date: 2003-12-08.
FULLER, BRAD (37670 GREEN in NEW BALTIMORE, MI; small business)
$37,700 with Army for Miscellaneous Vehicular Components. Signed on 2004-09-24. Completion date: 2004-11-15.
I & G TOOL CO INC (51528 INDUSTRIAL DR in NEW BALTIMORE, MI; small business) : $15,880 in 2 contractsfrom 2004 to 2005
$12,096 with Defense Logistics Agency for Miscellaneous Power Transmission Equipment. Signed on 2005-10-17. Completion date: 2006-01-25.
$3,784, same as above.Signed on 2004-12-09. Completion date: 2005-02-06.
Top industries in this zip code by the number of employees in 2005:
Health Care and Social Assistance: Residential Mental Retardation Facilities (100-249 employees: 1 establishment, 50-99 employees: 1 establishment, 20-49 employees: 2 establishments, 10-19 employees: 6 establishments, 5-9 employees: 6 establishments)
Health Care and Social Assistance: Home Health Care Services (100-249: 2, 20-49: 1, 1-4: 1)
2002 - 2018 National Fire Incident Reporting System (NFIRS) incidents
Based on the data from the years 2002 - 2018 the average number of fires per year is 65. The highest number of fires - 131 took place in 2006, and the least - 21 in 2004. The data has a dropping trend.
When looking into fire subcategories, the most reports belonged to: Structure Fires (50.5%), and Other (21.8%).
Fire incident types reported to NFIRS in Zip Code 48047


 Nearest zip codes: 48051, 48048, 48045, 48050, 48023, 48043.
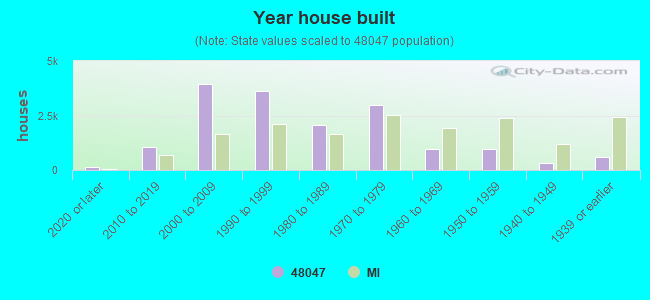


 Based on the data from the years 2002 - 2018 the average number of fires per year is 65. The highest number of fires - 131 took place in 2006, and the least - 21 in 2004. The data has a dropping trend.
 When looking into fire subcategories, the most reports belonged to: Structure Fires (50.5%), and Other (21.8%).