Estimated zip code population in 2022: 14,129 Zip code population in 2010: 13,785 Zip code population in 2000: 12,827
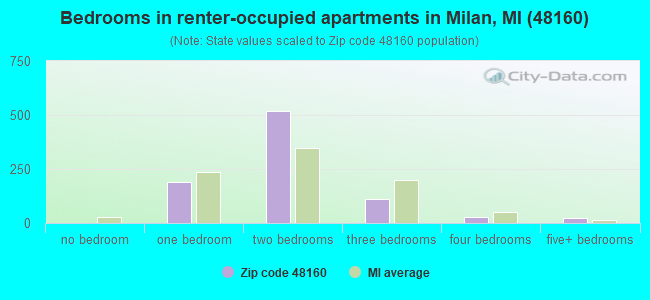
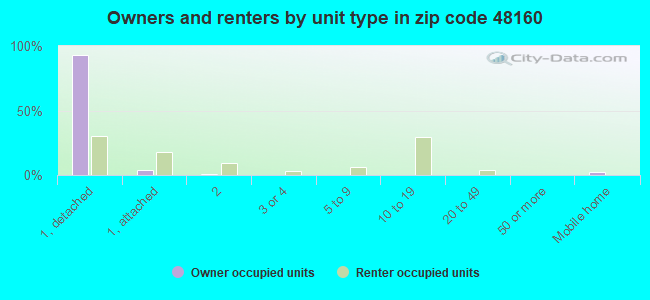
Houses and condos: 5,250 Renter-occupied apartments: 862
% of renters here:
17%
State:
27%
March 2022 cost of living index in zip code 48160: 95.3 (near average, U.S. average is 100)
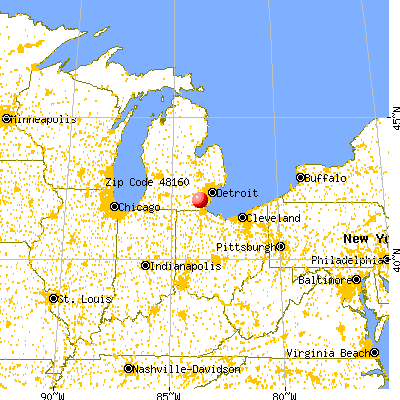
Land area: 80.5 sq. mi. Water area: 0.4 sq. mi.
Population density: 176 people per square mile
(very low).
OSM Map
General Map
Google Map
MSN Map
OSM Map
General Map
Google Map
MSN Map
OSM Map
General Map
Google Map
MSN Map
OSM Map
General Map
Google Map
MSN Map
Please wait while loading the map...
Real estate property taxes paid for housing units in 2022:
This zip code:
1.3% ($3,566)
Michigan:
1.2% ($2,746)
Median real estate property taxes paid for housing units with mortgages in 2022: $3,630 (1.4%) Median real estate property taxes paid for housing units with no mortgage in 2022: $3,482 (1.3%)
Business Search- 14 Million verified businesses
Males: 7,639
(54.1%)
Females: 6,489
(45.9%)
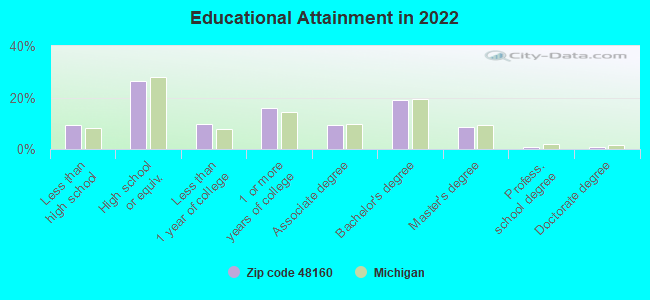
For population 25 years and over in 48160:
High school or higher: 90.5%
Bachelor's degree or higher: 29.3%
Graduate or professional degree: 10.4%
Unemployed: 3.9%
Mean travel time to work (commute): 27.5 minutes
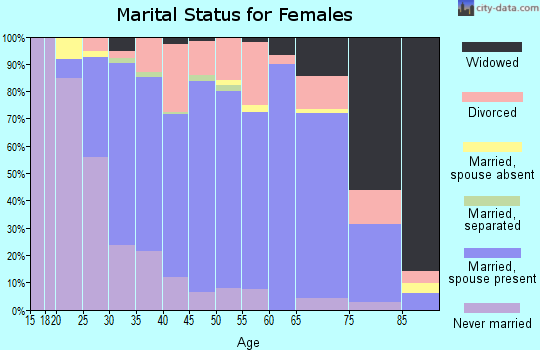
For population 15 years and over in 48160:
Never married: 32.8%
Now married: 46.3%
Separated: 1.2%
Widowed: 5.5%
Divorced: 14.3%
Zip code 48160 compared to state average:
Foreign-born population percentage below state average.
Renting percentage below state average.
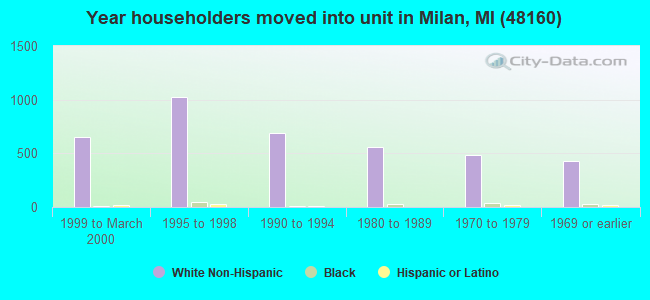
Length of stay since moving in above state average.
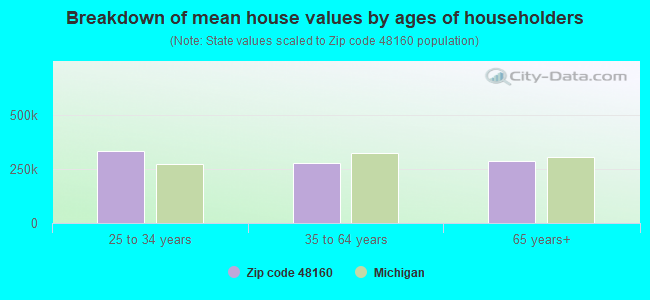
Estimated median house/condo value in 2022: $268,923
48160:
$268,923
Michigan:
$224,400
According to our research of Michigan and other state lists, there were 28 registered sex offenders living in 48160 zip code as of April 26, 2024. The ratio of all residents to sex offenders in zip code 48160 is 485 to 1. The ratio of registered sex offenders to all residents in this zip code is lower than the state average.
Median resident age:
This zip code:
41.3 years
Michigan median age:
40.3 years
Average household size:
This zip code:
2.5 people
Michigan:
2.4 people
Averages for the 2020 tax year for zip code 48160, filed in 2021:
Average Adjusted Gross Income (AGI) in 2020: $66,272 (Individual Income Tax Returns)
Here:
$66,272
State:
$68,945
Salary/wage: $59,351 (reported on 80.1% of returns)
Here:
$59,351
State:
$57,142
(% of AGI for various income ranges: 1011.8% for AGIs below $25k, 3290.3% for AGIs $25k-50k, 6115.5% for AGIs $50k-75k, 8781.0% for AGIs $75k-100k, 16698.3% for AGIs $100k-200k, 60173.7% for AGIs over 200k)
Taxable interest for individuals: $1,041 (reported on 31.5% of returns)
This zip code:
$1,041
Michigan:
$1,630
(% of AGI for various income ranges: 15.0% for AGIs below $25k, 18.3% for AGIs $25k-50k, 32.9% for AGIs $50k-75k, 54.0% for AGIs $75k-100k, 68.4% for AGIs $100k-200k, 885.0% for AGIs over 200k)
Ordinary dividends: $3,312 (reported on 19.6% of returns)
Here:
$3,312
State:
$6,972
(% of AGI for various income ranges: 23.0% for AGIs below $25k, 28.9% for AGIs $25k-50k, 64.7% for AGIs $50k-75k, 131.9% for AGIs $75k-100k, 186.6% for AGIs $100k-200k, 1366.2% for AGIs over 200k)
Net capital gain/loss in AGI: +$7,350 (reported on 16.8% of returns)
Here:
+$7,350
State:
+$20,064
(% of AGI for various income ranges: 9.8% for AGIs below $25k, 22.0% for AGIs $25k-50k, 61.9% for AGIs $50k-75k, 141.9% for AGIs $75k-100k, 326.6% for AGIs $100k-200k, 5110.0% for AGIs over 200k)
Profit/loss from business: +$11,737 (reported on 13.6% of returns)
Here:
+$11,737
State:
+$11,172
(% of AGI for various income ranges: 62.3% for AGIs below $25k, 102.8% for AGIs $25k-50k, 208.4% for AGIs $50k-75k, 276.9% for AGIs $75k-100k, 363.1% for AGIs $100k-200k, 3457.5% for AGIs over 200k)
Taxable individual retirement arrangement distribution: $19,179 (reported on 9.0% of returns)
48160:
$19,179
Michigan:
$19,803
(% of AGI for various income ranges: 42.7% for AGIs below $25k, 116.4% for AGIs $25k-50k, 190.0% for AGIs $50k-75k, 420.2% for AGIs $75k-100k, 509.6% for AGIs $100k-200k, 2680.0% for AGIs over 200k)
Self-employed (Keogh) retirement plans: $22,250 (reported on 0.3% of returns)
48160:
$22,250
Michigan:
$25,132
(% of AGI for various income ranges: 85.6% for AGIs $75k-100k)
Total itemized deductions: $28,888 (reported on 6.7% of returns)
Here:
$28,888
State:
$34,117
(% of AGI for various income ranges: 47.0% for AGIs below $25k, 69.9% for AGIs $25k-50k, 197.6% for AGIs $50k-75k, 348.1% for AGIs $75k-100k, 648.7% for AGIs $100k-200k, 4048.7% for AGIs over 200k)
Charity contributions: $8,803 (reported on 5.3% of returns)
Here:
$8,803
State:
$13,548
(% of AGI for various income ranges: 15.3% for AGIs $25k-50k, 32.3% for AGIs $50k-75k, 58.3% for AGIs $75k-100k, 165.1% for AGIs $100k-200k, 1406.2% for AGIs over 200k)
Taxes paid: $8,167 (reported on 6.7% of returns)
48160:
$8,167
State:
$7,972
(% of AGI for various income ranges: 8.4% for AGIs below $25k, 21.8% for AGIs $25k-50k, 56.8% for AGIs $50k-75k, 115.4% for AGIs $75k-100k, 202.0% for AGIs $100k-200k, 911.3% for AGIs over 200k)
Earned income credit: $1,814 (reported on 8.7% of returns)
Here:
$1,814
State:
$2,251
(% of AGI for various income ranges: 42.3% for AGIs below $25k, 44.7% for AGIs $25k-50k)
Percentage of individuals using paid preparers for their 2020 taxes: 93.0%
Here:
93%
State:
93%
(% for various income ranges: 89.8% for AGIs below $25k, 93.7% for AGIs $25k-50k, 94.2% for AGIs $50k-75k, 94.7% for AGIs $75k-100k, 95.5% for AGIs $100k-200k, 91.7% for AGIs over 200k)
Averages for the 2012 tax year for zip code 48160, filed in 2013:
Average Adjusted Gross Income (AGI) in 2012: $55,202 (Individual Income Tax Returns)
Here:
$55,202
State:
$55,609
Salary/wage: $48,446 (reported on 84.7% of returns)
Here:
$48,446
State:
$46,782
(% of AGI for various income ranges: 65.6% for AGIs below $25k, 71.5% for AGIs $25k-50k, 72.7% for AGIs $50k-75k, 76.5% for AGIs $75k-100k, 80.5% for AGIs $100k-200k, 65.5% for AGIs over 200k)
Taxable interest for individuals: $947 (reported on 36.3% of returns)
This zip code:
$947
Michigan:
$1,491
(% of AGI for various income ranges: 1.3% for AGIs below $25k, 0.7% for AGIs $25k-50k, 0.4% for AGIs $50k-75k, 0.4% for AGIs $75k-100k, 0.7% for AGIs $100k-200k, 0.5% for AGIs over 200k)
Ordinary dividends: $2,505 (reported on 19.1% of returns)
Here:
$2,505
State:
$6,225
(% of AGI for various income ranges: 1.5% for AGIs below $25k, 1.1% for AGIs $25k-50k, 0.8% for AGIs $50k-75k, 0.7% for AGIs $75k-100k, 0.6% for AGIs $100k-200k, 1.0% for AGIs over 200k)
Net capital gain/loss in AGI: +$2,770 (reported on 15.0% of returns)
Here:
+$2,770
State:
+$9,326
(% of AGI for various income ranges: 0.3% for AGIs $50k-75k, 0.3% for AGIs $75k-100k, 0.7% for AGIs $100k-200k, 4.5% for AGIs over 200k)
Profit/loss from business: +$10,085 (reported on 14.8% of returns)
Here:
+$10,085
State:
+$11,523
(% of AGI for various income ranges: 6.8% for AGIs below $25k, 2.6% for AGIs $25k-50k, 2.1% for AGIs $50k-75k, 1.9% for AGIs $75k-100k, 2.5% for AGIs $100k-200k, 2.9% for AGIs over 200k)
Taxable individual retirement arrangement distribution: $14,756 (reported on 10.5% of returns)
48160:
$14,756
Michigan:
$15,298
(% of AGI for various income ranges: 2.4% for AGIs below $25k, 2.5% for AGIs $25k-50k, 2.8% for AGIs $50k-75k, 2.5% for AGIs $75k-100k, 3.1% for AGIs $100k-200k, 3.1% for AGIs over 200k)
Self-employment retirement plans: $8,100 (reported on 0.5% of returns)
48160:
$8,100
Michigan:
$20,834
Total itemized deductions: $18,689 (20% of AGI, reported on 36.4% of returns)
Here:
$18,689
State:
$21,628
Here:
20.0% of AGI
State:
18.4% of AGI
(% of AGI for various income ranges: 10.2% for AGIs below $25k, 10.0% for AGIs $25k-50k, 11.7% for AGIs $50k-75k, 12.8% for AGIs $75k-100k, 14.1% for AGIs $100k-200k, 12.0% for AGIs over 200k)
Charity contributions: $2,963 (reported on 29.2% of returns)
Here:
$2,963
State:
$4,225
(% of AGI for various income ranges: 0.7% for AGIs below $25k, 1.0% for AGIs $25k-50k, 1.5% for AGIs $50k-75k, 1.5% for AGIs $75k-100k, 1.9% for AGIs $100k-200k, 2.1% for AGIs over 200k)
Taxes paid: $6,806 (reported on 36.3% of returns)
48160:
$6,806
State:
$8,327
(% of AGI for various income ranges: 2.0% for AGIs below $25k, 2.7% for AGIs $25k-50k, 3.8% for AGIs $50k-75k, 4.7% for AGIs $75k-100k, 5.8% for AGIs $100k-200k, 5.6% for AGIs over 200k)
Earned income credit: $1,985 (reported on 12.5% of returns)
Here:
$1,985
State:
$2,306
(% of AGI for various income ranges: 4.3% for AGIs below $25k, 0.9% for AGIs $25k-50k)
Percentage of individuals using paid preparers for their 2012 taxes: 56.3%
Here:
56%
State:
57%
(% for various income ranges: 53.3% for AGIs below $25k, 55.3% for AGIs $25k-50k, 58.3% for AGIs $50k-75k, 58.5% for AGIs $75k-100k, 58.2% for AGIs $100k-200k, 81.8% for AGIs over 200k)
Averages for the 2004 tax year for zip code 48160, filed in 2005:
Average Adjusted Gross Income (AGI) in 2004: $50,365 (Individual Income Tax Returns)
Here:
$50,365
State:
$48,204
Salary/wage: $47,090 (reported on 87.7% of returns)
Here:
$47,090
State:
$42,791
(% of AGI for various income ranges: 86.1% for AGIs below $10k, 67.8% for AGIs $10k-25k, 77.9% for AGIs $25k-50k, 84.5% for AGIs $50k-75k, 87.6% for AGIs $75k-100k, 81.4% for AGIs over 100k)
Taxable interest for individuals: $1,151 (reported on 51.0% of returns)
This zip code:
$1,151
Michigan:
$1,725
(% of AGI for various income ranges: 5.7% for AGIs below $10k, 2.7% for AGIs $10k-25k, 1.4% for AGIs $25k-50k, 0.9% for AGIs $50k-75k, 0.5% for AGIs $75k-100k, 1.1% for AGIs over 100k)
Taxable dividends: $1,493 (reported on 25.2% of returns)
Here:
$1,493
State:
$3,420
(% of AGI for various income ranges: 2.2% for AGIs below $10k, 1.6% for AGIs $10k-25k, 1.0% for AGIs $25k-50k, 0.5% for AGIs $50k-75k, 0.5% for AGIs $75k-100k, 0.8% for AGIs over 100k)
Net capital gain/loss: +$3,686 (reported on 18.8% of returns)
Here:
+$3,686
State:
+$8,532
(% of AGI for various income ranges: -2.2% for AGIs below $10k, -0.0% for AGIs $10k-25k, 0.6% for AGIs $25k-50k, 0.3% for AGIs $50k-75k, 0.7% for AGIs $75k-100k, 3.2% for AGIs over 100k)
Profit/loss from business: +$9,086 (reported on 14.2% of returns)
Here:
+$9,086
State:
+$9,547
(% of AGI for various income ranges: -2.0% for AGIs below $10k, 5.2% for AGIs $10k-25k, 3.1% for AGIs $25k-50k, 2.5% for AGIs $50k-75k, 1.9% for AGIs $75k-100k, 2.5% for AGIs over 100k)
IRA payment deduction: $2,838 (reported on 1.9% of returns)
48160:
$2,838
Michigan:
$2,875
(% of AGI for various income ranges: 0.2% for AGIs $10k-25k, 0.1% for AGIs $25k-50k, 0.2% for AGIs $50k-75k, 0.1% for AGIs $75k-100k, 0.1% for AGIs over 100k)
Self-employed pension: $12,581 (reported on 0.5% of returns)
Here:
$12,581
Michigan:
$13,826
Total itemized deductions: $17,648 (22% of AGI, reported on 43.6% of returns)
Here:
$17,648
State:
$18,509
Here:
22.3% of AGI
State:
20.7% of AGI
(% of AGI for various income ranges: 14.2% for AGIs below $10k, 12.2% for AGIs $10k-25k, 13.9% for AGIs $25k-50k, 15.7% for AGIs $50k-75k, 16.2% for AGIs $75k-100k, 15.7% for AGIs over 100k)
Charity contributions deductions: $2,555 (3% of AGI, reported on 37.0% of returns)
Here:
$2,555
State:
$3,365
Here:
3.1% of AGI
State:
3.6% of AGI
(% of AGI for various income ranges: 0.7% for AGIs below $10k, 1.0% for AGIs $10k-25k, 1.4% for AGIs $25k-50k, 1.6% for AGIs $50k-75k, 1.9% for AGIs $75k-100k, 2.5% for AGIs over 100k)
Total tax: $6,600 (reported on 80.8% of returns)
48160:
$6,600
State:
$7,691
(% of AGI for various income ranges: 2.4% for AGIs below $10k, 4.5% for AGIs $10k-25k, 7.3% for AGIs $25k-50k, 8.9% for AGIs $50k-75k, 10.1% for AGIs $75k-100k, 15.1% for AGIs over 100k)
Earned income credit: $1,534 (reported on 8.6% of returns)
Here:
$1,534
State:
$1,737
Percentage of individuals using paid preparers for their 2004 taxes: 57.1%
Here:
57%
State:
60%
(% for various income ranges: 45.6% for AGIs below $10k, 60.8% for AGIs $10k-25k, 58.1% for AGIs $25k-50k, 57.9% for AGIs $50k-75k, 59.3% for AGIs $75k-100k, 62.8% for AGIs over 100k)
Likely homosexual households (counted as self-reported same-sex unmarried-partner households)
Lesbian couples: 0.0% of all households
Gay men: 0.1% of all households
Household received Food Stamps/SNAP in the past 12 months: 504 Household did not receive Food Stamps/SNAP in the past 12 months: 4,543
Women who had a birth in the past 12 months: 101 (97 now married, 5 unmarried) Women who did not have a birth in the past 12 months: 2,831 (1,193 now married, 1,635 unmarried)
Housing units in zip code 48160 with a mortgage: 2,883 (197 second mortgage, 137 both second mortgage and home equity loan) Houses without a mortgage: 30
Median monthly owner costs for units with a mortgage: $1,590 Median monthly owner costs for units without a mortgage: $659
Residents with income below the poverty level in 2022:
This zip code:
5.4%
Whole state:
13.4%
Residents with income below 50% of the poverty level in 2022:
This zip code:
3.3%
Whole state:
6.9%
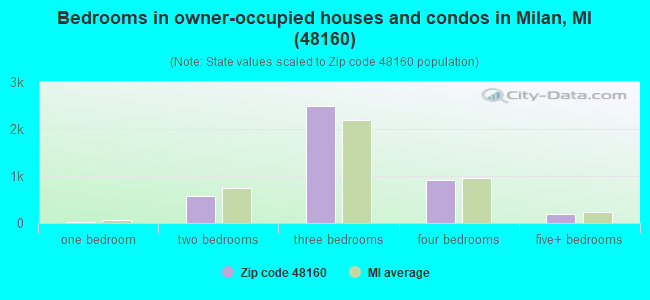
Median number of rooms in houses and condos:
Here:
6.6
State:
6.5
Median number of rooms in apartments:
Here:
4.1
State:
4.3
Notable locations in this zip code not listed on our city pages
Notable locations in zip code 48160: Federal Correctional Institution (A), KC Campgrounds (B), Milan Station (C), Milan Police Department (D), Milan Public Library (E), Milan Fire Department (F), Milan Area Fire Department (G). Display/hide their locations on the map
Churches in zip code 48160 include: London Church (A), Bethlehem Church (B), Midway Church (C), Calvary Baptist Church (D), Marble Memorial United Methodist Church (E), Saint Paul Missionary Baptist Church (F), Vineyard Church of Milan (G), Church of Christ (H), Peoples Presbyterian Church (I). Display/hide their locations on the map
Cemeteries: Marble Park Cemetery (1), County Line Cemetery (2), Rice Cemetery (3), Saint Josephs Cemetery (4), Saint Marys Cemetery (5), London Township Cemetery (6), Pool Cemetery (7). Display/hide their locations on the map
Streams, rivers, and creeks: Sugar Creek (A), Paint Creek (B), Buck Creek (C), Sherman Wilson Drain (D), Oakville Drain (E), Center Creek (F), Cone Drain (G), McIntyre Drain (H), Rice Drain (I). Display/hide their locations on the map
Parks in zip code 48160 include: Wilson Park (1), Sanford Road Park (2), Nature Park (3), Sandra Richardson Park (4). Display/hide their locations on the map
In group quarters: 1,536 (-1 institutionalized population)
Size of family households: 1,421 2-persons, 855 3-persons, 853 4-persons, 214 5-persons, 28 6-persons, 80 7-or-more-persons
Size of nonfamily households: 1,271 1-person, 299 2-persons, 14 3-persons
1,933 married couples with children.
605 single-parent households (202 men, 403 women).
95.1% of residents of 48160 zip code speak English at home.
2.7% of residents speak Spanish at home (56% very well, 27% well, 17% not well).
0.7% of residents speak other Indo-European language at home (86% very well, 14% well).
0.3% of residents speak Asian or Pacific Island language at home (51% very well, 49% well).
1.0% of residents speak other language at home (47% very well, 53% not well).
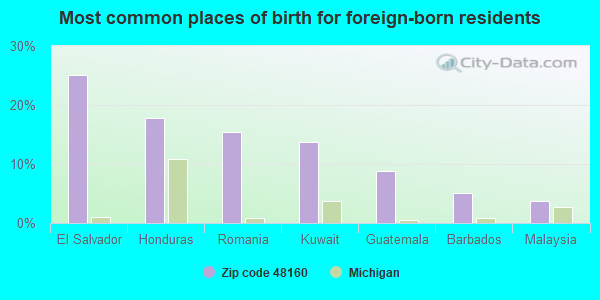
Foreign born population: 479 (3.4%) (60.1% of them are naturalized citizens)
This zip code:
3.4%
Whole state:
6.9%
25%El Salvador
18%Honduras
15%Romania
14%Kuwait
9%Guatemala
5%Barbados
4%Malaysia
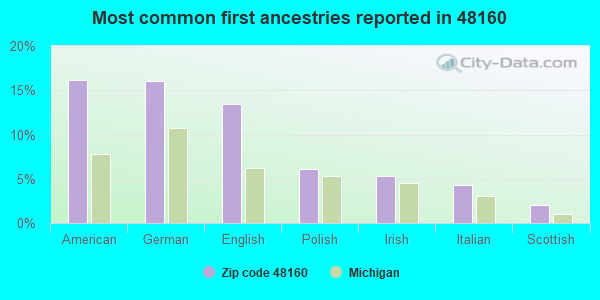
16%American
16%German
13%English
6%Polish
5%Irish
4%Italian
2%Scottish
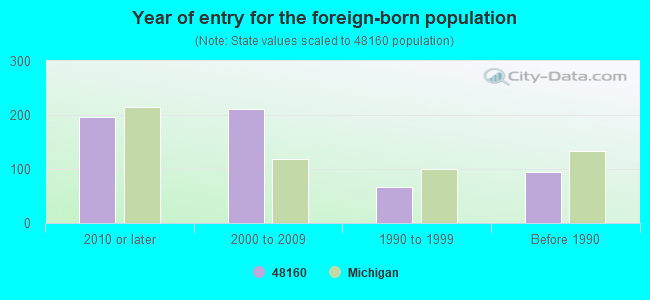
Year of entry for the foreign-born population
1962010 or later
2112000 to 2009
661990 to 1999
95Before 1990
Major facilities with environmental interests located in this zip code:
GEORGIA PACIFIC CORPORATION (951 COUNTY ST in MILAN, MI)
AIR MINOR (AIRS/AFS) CRITERIA AND HAZARDOUS AIR POLLUTANT INVENTORY (Inventory of air pollution sources) Conditionally Exempt Small Quantity Generators, less than 100 kg/month of hazardous waste (Resource Conservation and Recovery Act (tracking hazardous waste)) TRI REPORTER (Tracking of toxic chemicals releasing facilities) Business SIC classification: CORRUGATED AND SOLID FIBER BOXES Organizations: NEKOOSA PACKAGING (CONTACT/OPERATOR)
Alternative names: NEKOOSA PACKAGING, NEKOOSA PACKAGING MILAN BOX PLANT
AUTOLIGN MANUFACTURING GROUP INCORPORATED (620 SOUTH PLATT ROAD in MILAN, MI)
AIR MAJOR (AIRS/AFS) CRITERIA AND HAZARDOUS AIR POLLUTANT INVENTORY (Inventory of air pollution sources) Conditionally Exempt Small Quantity Generators, less than 100 kg/month of hazardous waste (Resource Conservation and Recovery Act (tracking hazardous waste)) USED OIL PROGRAM (Resource Conservation and Recovery Act (tracking hazardous waste)) TRI REPORTER (Tracking of toxic chemicals releasing facilities) Business SIC classification: MOTOR VEHICLE PARTS AND ACCESSORIES; TOP, BODY, AND UPHOLSTERY REPAIR SHOPS AND PAINT SHOPS Business NAICS classification: ALL OTHER MOTOR VEHICLE PARTS MANUFACTURING. Organizations: AUTOLIGN MFG GROUP INC (CONTACT/OWNER)
Alternative names: COLONEL'S INC..
FRUEHAUF CORP (620 S.PLATT RD in MILAN, MI)
AIR MINOR (AIRS/AFS) (Resource Conservation and Recovery Act (tracking hazardous waste)) Business SIC classification: NONCLASSIFIABLE ESTABLISHMENTS
ARKONA ROAD LANDFILL (5400 ARKONA RD in MILAN, MI)
HAZARDOUS WASTE BIENNIAL REPORTER (Resource Conservation and Recovery Act (tracking hazardous waste)) Large Quantity Generators, more that 1000 kg of hazardous waste/month (Resource Conservation and Recovery Act (tracking hazardous waste)) - notification Business NAICS classification: SOLID WASTE COLLECTION. Organizations: WAYNE DISPOSAL INC (CONTACT/OPERATOR)
Alternative names: AUGUSTA DEVT CORP ARKONA RD LANDFILL
MI DEPT/TRANSPORTATION BRIDGE B04-58033 (US-23 OVER MACON RIVER in MILAN TOWNSHIP, MI)
(Resource Conservation and Recovery Act (tracking hazardous waste)) Organizations: MICH DEPT OF TRANSPORTATION (CONTACT/OPERATOR)
Alternative names: MIDOT BRIDGE US-23 OVER MACON RIVER
BIMAC INC (345 E. MAIN ST. in MILAN, MI)
Conditionally Exempt Small Quantity Generators, less than 100 kg/month of hazardous waste (Resource Conservation and Recovery Act (tracking hazardous waste)) - notification TRI REPORTER (Tracking of toxic chemicals releasing facilities) Business SIC classification: MANUFACTURING INDUSTRIES Organizations: STAMBAUGH SALLY (CONTACT/OWNER)
MI DEPT/ENVIRONMENTAL QUALITY (12713 CALHOUN ROAD in MILAN, MI)
(Resource Conservation and Recovery Act (tracking hazardous waste)) Alternative names: MI DEPT/ENVIRONMENTAL QUALITY RRD
GIRAUD TRUCKING (12223 DARLING RD in MILAN, MI)
(Resource Conservation and Recovery Act (tracking hazardous waste))
BODY ALTERNATIVES (725 E MAIN ST in MILAN, MI)
Conditionally Exempt Small Quantity Generators, less than 100 kg/month of hazardous waste (Resource Conservation and Recovery Act (tracking hazardous waste)) Business NAICS classification: GENERAL AUTOMOTIVE REPAIR. Organizations: RICK D DEMICHELE (CONTACT/OPERATOR)
MI DEPT/TRANSPORTATION BRIDGE B03-58033 (US-23 0VER BEAR SWAMP CREEK in MILAN, MI)
Conditionally Exempt Small Quantity Generators, less than 100 kg/month of hazardous waste (Resource Conservation and Recovery Act (tracking hazardous waste)) Organizations: MICH DEPT OF TRANSPORTATION (CONTACT/OPERATOR)
MI DEPT/TRANSPORTATION BRIDGE B05-58033 (US-23 OVER SALINE RIVER in MILAN, MI)
Conditionally Exempt Small Quantity Generators, less than 100 kg/month of hazardous waste (Resource Conservation and Recovery Act (tracking hazardous waste)) Organizations: MICH DEPT OF TRANSPORTATION (CONTACT/OPERATOR)
CHEMTOOL INC (415 SQUIRES DR in MILAN, MI)
Small Quantity Generators, between 100 kg and 1000 kg of hazardous waste/month (Resource Conservation and Recovery Act (tracking hazardous waste)) - notification Organizations: JAMES ATMANS (CONTACT/OWNER)
EDWARD V GIRAUD TRUCKING (13901 TUTTLE HILL RD in MILAN, MI)
TRANSPORTER (Resource Conservation and Recovery Act (tracking hazardous waste)) Business NAICS classification: GENERAL FREIGHT TRUCKING, LONG-DISTANCE, TRUCKLOAD. Organizations: ED GIRAUD (CONTACT/OWNER)
Housing units lacking complete plumbing facilities: 1.5% Housing units lacking complete kitchen facilities: 1.8%
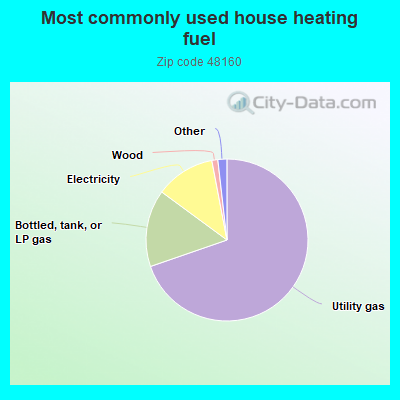
69.7%Utility gas
15.4%Bottled, tank, or LP gas
11.9%Electricity
1.2%Wood
0.8%Other fuel
0.6%No fuel used
0.5%Fuel oil, kerosene, etc.
Population in 1990: 12,411. Population change in the 1990s: +416 (+3.4%).
Place of birth for U.S.-born residents:
This state: 10,898
Northeast: 268
Midwest: 1,397
South: 692
West: 309
52% of the 48160 zip code residents lived in the same house 5 years ago. Out of people who lived in different houses, 32% lived in this county. Out of people who lived in different counties, 50% lived in Michigan.
87% of the 48160 zip code residents lived in the same house 1 year ago. Out of people who lived in different houses, 37% moved from this county. Out of people who lived in different houses, 44% moved from different county within same state. Out of people who lived in different houses, 15% moved from different state. Out of people who lived in different houses, 3% moved from abroad.
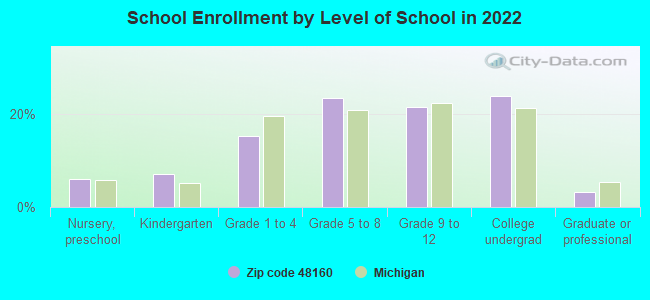
Private vs. public school enrollment:
Students in private schools in grades 1 to 8 (elementary and middle school): 138
Here:
11.2%
Michigan:
12.4%
Students in private schools in grades 9 to 12 (high school): 52
Here:
7.6%
Michigan:
9.8%
Students in private undergraduate colleges: 118
Here:
15.5%
Michigan:
14.9%
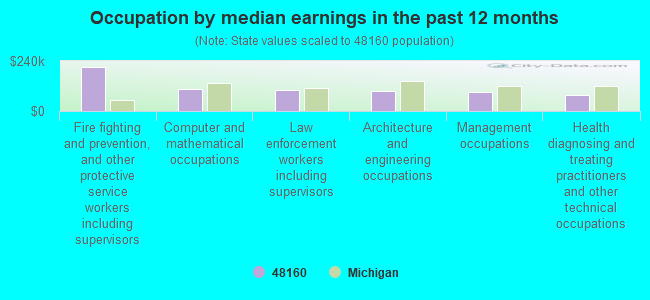
Occupation by median earnings in the past 12 months ($)
209,129Fire fighting and prevention, and other protective service workers including supervisors
104,358Computer and mathematical occupations
101,499Law enforcement workers including supervisors
94,485Architecture and engineering occupations
93,423Management occupations
76,151Health diagnosing and treating practitioners and other technical occupations
Companies with federal contracts located in this zip code:
PRECISION DEVICES INC (606 COUNTY STREET in MILAN, MI; small business) : $154,073 in 8 contractsfrom 2002 to 2006
Contracts for Maintenance, Repair and Rebuilding of Equipment -- Measuring Tools, Maintenance, Repair and Rebuilding of Equipment -- Instruments and Laboratory Equipment by Air Force Signed by year:2000: $0; 2001: $0; 2002: $36,279; 2003: $0; 2004: $43,200; 2005: $70,037; 2006: $4,557.
Biggest contracts:
$50,000 with Air Force for Maintenance, Repair and Rebuilding of Equipment -- Measuring Tools. Taking place in OK. Signed on 2005-09-28. Completion date: 2006-09-29.
$43,200 with Air Force for Maintenance, Repair and Rebuilding of Equipment -- Instruments and Laboratory Equipment. Taking place in OK. Signed on 2004-02-19. Completion date: 2005-02-28.
$36,279, same as above.Signed on 2002-12-16. Completion date: 2003-12-09.
$30,000 with Air Force for Maintenance, Repair and Rebuilding of Equipment -- Measuring Tools. Taking place in OK. Signed on 2006-06-16. Completion date: 2007-06-27.
BEL AIR RACING GROUP INC (10860 PLANK RD in MILAN, MI; small business)
$5,000 with Navy for Lease or Rental of Facilities -- Conference Space and Facilities. Signed on 2006-04-10. Completion date: 2006-10-07.
Top industries in this zip code by the number of employees in 2005:
Health Care and Social Assistance: Other Residential Care Facilities (250-499 employees: 1 establishment, 10-19 employees: 1 establishment)
2002 - 2018 National Fire Incident Reporting System (NFIRS) incidents
Based on the data from the years 2002 - 2018 the average number of fires per year is 38. The highest number of reported fire incidents - 56 took place in 2003, and the least - 7 in 2006. The data has a decreasing trend.
When looking into fire subcategories, the most reports belonged to: Structure Fires (38.7%), and Outside Fires (37.5%).
Fire incident types reported to NFIRS in Zip Code 48160


 Nearest zip codes: 48190, 48131, 48191, 48197, 48159, 48108.


 Based on the data from the years 2002 - 2018 the average number of fires per year is 38. The highest number of reported fire incidents - 56 took place in 2003, and the least - 7 in 2006. The data has a decreasing trend.
 When looking into fire subcategories, the most reports belonged to: Structure Fires (38.7%), and Outside Fires (37.5%).