Estimated zip code population in 2022: 23,185 Zip code population in 2010: 21,447 Zip code population in 2000: 18,354
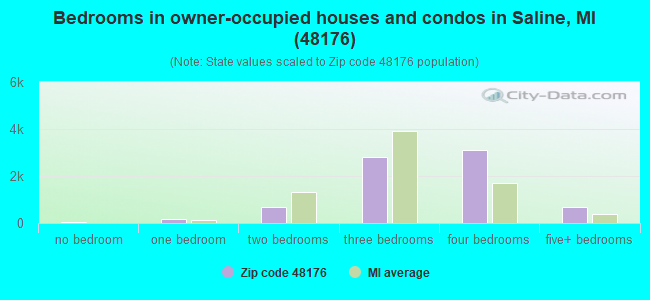
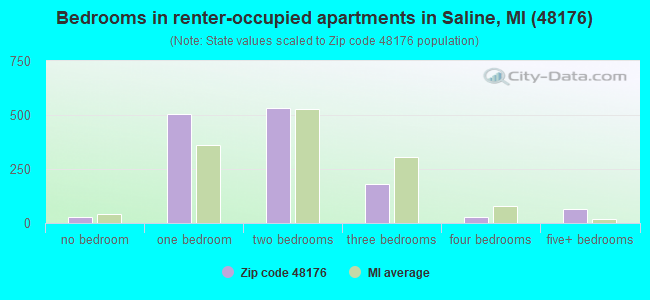
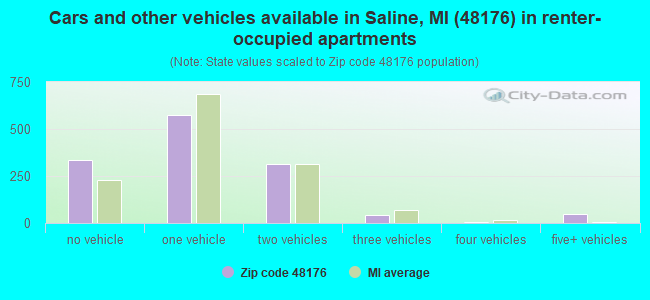
Houses and condos: 8,915 Renter-occupied apartments: 1,318
% of renters here:
15%
State:
27%
March 2022 cost of living index in zip code 48176: 99.8 (near average, U.S. average is 100)
Land area: 74.3 sq. mi. Water area: 0.4 sq. mi.
Population density: 312 people per square mile
(very low).
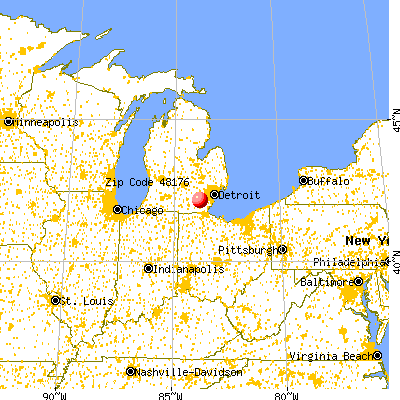
OSM Map
General Map
Google Map
MSN Map
OSM Map
General Map
Google Map
MSN Map
OSM Map
General Map
Google Map
MSN Map
OSM Map
General Map
Google Map
MSN Map
Please wait while loading the map...
Real estate property taxes paid for housing units in 2022:
This zip code:
1.3% ($5,702)
Michigan:
1.2% ($2,746)
Median real estate property taxes paid for housing units with mortgages in 2022: $5,709 (1.4%) Median real estate property taxes paid for housing units with no mortgage in 2022: $5,760 (1.3%)
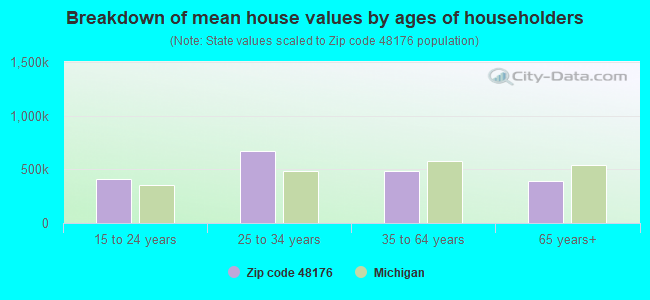
Estimated median house/condo value in 2022: $423,470
48176:
$423,470
Michigan:
$224,400
According to our research of Michigan and other state lists, there were 33 registered sex offenders living in 48176 zip code as of April 27, 2024. The ratio of all residents to sex offenders in zip code 48176 is 690 to 1. The ratio of registered sex offenders to all residents in this zip code is lower than the state average.
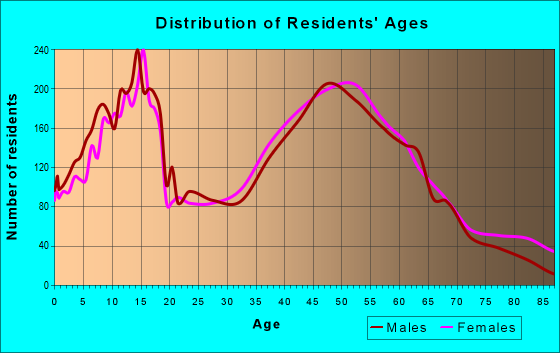
Median resident age:
This zip code:
44.4 years
Michigan median age:
40.3 years
Average household size:
This zip code:
2.6 people
Michigan:
2.4 people
Averages for the 2020 tax year for zip code 48176, filed in 2021:
Average Adjusted Gross Income (AGI) in 2020: $104,655 (Individual Income Tax Returns)
Here:
$104,655
State:
$68,945
Salary/wage: $92,824 (reported on 78.5% of returns)
Here:
$92,824
State:
$57,142
(% of AGI for various income ranges: 1022.7% for AGIs below $25k, 3118.6% for AGIs $25k-50k, 5804.5% for AGIs $50k-75k, 8471.0% for AGIs $75k-100k, 18279.8% for AGIs $100k-200k, 74405.3% for AGIs over 200k)
Taxable interest for individuals: $1,581 (reported on 47.5% of returns)
This zip code:
$1,581
Michigan:
$1,630
(% of AGI for various income ranges: 26.5% for AGIs below $25k, 43.4% for AGIs $25k-50k, 69.2% for AGIs $50k-75k, 101.8% for AGIs $75k-100k, 151.7% for AGIs $100k-200k, 756.7% for AGIs over 200k)
Ordinary dividends: $6,693 (reported on 36.8% of returns)
Here:
$6,693
State:
$6,972
(% of AGI for various income ranges: 44.9% for AGIs below $25k, 116.6% for AGIs $25k-50k, 230.0% for AGIs $50k-75k, 293.5% for AGIs $75k-100k, 520.8% for AGIs $100k-200k, 2675.1% for AGIs over 200k)
Net capital gain/loss in AGI: +$13,346 (reported on 32.4% of returns)
Here:
+$13,346
State:
+$20,064
(% of AGI for various income ranges: 24.3% for AGIs below $25k, 55.9% for AGIs $25k-50k, 146.4% for AGIs $50k-75k, 277.0% for AGIs $75k-100k, 555.9% for AGIs $100k-200k, 7192.4% for AGIs over 200k)
Profit/loss from business: +$17,484 (reported on 15.9% of returns)
Here:
+$17,484
State:
+$11,172
(% of AGI for various income ranges: 85.2% for AGIs below $25k, 156.7% for AGIs $25k-50k, 240.9% for AGIs $50k-75k, 349.9% for AGIs $75k-100k, 694.6% for AGIs $100k-200k, 2492.0% for AGIs over 200k)
Taxable individual retirement arrangement distribution: $26,916 (reported on 14.0% of returns)
48176:
$26,916
Michigan:
$19,803
(% of AGI for various income ranges: 72.8% for AGIs below $25k, 208.0% for AGIs $25k-50k, 435.9% for AGIs $50k-75k, 754.6% for AGIs $75k-100k, 1118.0% for AGIs $100k-200k, 2417.6% for AGIs over 200k)
Self-employed (Keogh) retirement plans: $19,975 (reported on 1.0% of returns)
48176:
$19,975
Michigan:
$25,132
(% of AGI for various income ranges: 61.5% for AGIs $100k-200k, 277.1% for AGIs over 200k)
Total itemized deductions: $31,709 (reported on 13.1% of returns)
Here:
$31,709
State:
$34,117
(% of AGI for various income ranges: 71.0% for AGIs below $25k, 176.9% for AGIs $25k-50k, 364.5% for AGIs $50k-75k, 606.6% for AGIs $75k-100k, 904.1% for AGIs $100k-200k, 4406.7% for AGIs over 200k)
Charity contributions: $10,523 (reported on 10.7% of returns)
Here:
$10,523
State:
$13,548
(% of AGI for various income ranges: 4.5% for AGIs below $25k, 16.0% for AGIs $25k-50k, 46.4% for AGIs $50k-75k, 86.9% for AGIs $75k-100k, 212.9% for AGIs $100k-200k, 1630.6% for AGIs over 200k)
Taxes paid: $8,843 (reported on 13.1% of returns)
48176:
$8,843
State:
$7,972
(% of AGI for various income ranges: 16.1% for AGIs below $25k, 38.4% for AGIs $25k-50k, 111.2% for AGIs $50k-75k, 204.6% for AGIs $75k-100k, 286.6% for AGIs $100k-200k, 1097.8% for AGIs over 200k)
Earned income credit: $1,737 (reported on 5.4% of returns)
Here:
$1,737
State:
$2,251
(% of AGI for various income ranges: 31.9% for AGIs below $25k, 35.7% for AGIs $25k-50k)
Percentage of individuals using paid preparers for their 2020 taxes: 92.1%
Here:
92%
State:
93%
(% for various income ranges: 90.3% for AGIs below $25k, 92.2% for AGIs $25k-50k, 90.8% for AGIs $50k-75k, 92.9% for AGIs $75k-100k, 93.4% for AGIs $100k-200k, 93.4% for AGIs over 200k)
Averages for the 2012 tax year for zip code 48176, filed in 2013:
Average Adjusted Gross Income (AGI) in 2012: $88,715 (Individual Income Tax Returns)
Here:
$88,715
State:
$55,609
Salary/wage: $78,071 (reported on 83.9% of returns)
Here:
$78,071
State:
$46,782
(% of AGI for various income ranges: 70.1% for AGIs below $25k, 68.7% for AGIs $25k-50k, 68.5% for AGIs $50k-75k, 70.5% for AGIs $75k-100k, 79.7% for AGIs $100k-200k, 71.2% for AGIs over 200k)
Taxable interest for individuals: $1,416 (reported on 49.3% of returns)
This zip code:
$1,416
Michigan:
$1,491
(% of AGI for various income ranges: 1.8% for AGIs below $25k, 1.1% for AGIs $25k-50k, 1.1% for AGIs $50k-75k, 0.9% for AGIs $75k-100k, 0.5% for AGIs $100k-200k, 0.8% for AGIs over 200k)
Ordinary dividends: $6,198 (reported on 34.7% of returns)
Here:
$6,198
State:
$6,225
(% of AGI for various income ranges: 3.4% for AGIs below $25k, 2.4% for AGIs $25k-50k, 2.4% for AGIs $50k-75k, 2.3% for AGIs $75k-100k, 1.5% for AGIs $100k-200k, 3.3% for AGIs over 200k)
Net capital gain/loss in AGI: +$7,024 (reported on 28.0% of returns)
Here:
+$7,024
State:
+$9,326
(% of AGI for various income ranges: 0.4% for AGIs $50k-75k, 0.6% for AGIs $75k-100k, 0.7% for AGIs $100k-200k, 5.2% for AGIs over 200k)
Profit/loss from business: +$18,104 (reported on 16.0% of returns)
Here:
+$18,104
State:
+$11,523
(% of AGI for various income ranges: 5.7% for AGIs below $25k, 4.7% for AGIs $25k-50k, 2.7% for AGIs $50k-75k, 1.6% for AGIs $75k-100k, 3.1% for AGIs $100k-200k, 3.5% for AGIs over 200k)
Taxable individual retirement arrangement distribution: $18,649 (reported on 13.5% of returns)
48176:
$18,649
Michigan:
$15,298
(% of AGI for various income ranges: 4.1% for AGIs below $25k, 4.1% for AGIs $25k-50k, 3.6% for AGIs $50k-75k, 4.3% for AGIs $75k-100k, 2.9% for AGIs $100k-200k, 1.8% for AGIs over 200k)
Self-employment retirement plans: $15,142 (reported on 1.1% of returns)
48176:
$15,142
Michigan:
$20,834
(% of AGI for various income ranges: 0.5% for AGIs below $25k, 0.2% for AGIs $100k-200k, 0.3% for AGIs over 200k)
Total itemized deductions: $24,956 (17% of AGI, reported on 48.4% of returns)
Here:
$24,956
State:
$21,628
Here:
16.9% of AGI
State:
18.4% of AGI
(% of AGI for various income ranges: 13.8% for AGIs below $25k, 12.4% for AGIs $25k-50k, 14.7% for AGIs $50k-75k, 16.0% for AGIs $75k-100k, 15.5% for AGIs $100k-200k, 11.0% for AGIs over 200k)
Charity contributions: $3,920 (reported on 42.4% of returns)
Here:
$3,920
State:
$4,225
(% of AGI for various income ranges: 0.9% for AGIs below $25k, 1.4% for AGIs $25k-50k, 1.5% for AGIs $50k-75k, 2.1% for AGIs $75k-100k, 2.1% for AGIs $100k-200k, 1.8% for AGIs over 200k)
Taxes paid: $10,895 (reported on 48.4% of returns)
48176:
$10,895
State:
$8,327
(% of AGI for various income ranges: 3.1% for AGIs below $25k, 3.6% for AGIs $25k-50k, 5.1% for AGIs $50k-75k, 6.1% for AGIs $75k-100k, 6.8% for AGIs $100k-200k, 6.0% for AGIs over 200k)
Earned income credit: $1,756 (reported on 6.8% of returns)
Here:
$1,756
State:
$2,306
(% of AGI for various income ranges: 2.6% for AGIs below $25k, 0.7% for AGIs $25k-50k)
Percentage of individuals using paid preparers for their 2012 taxes: 51.3%
Here:
51%
State:
57%
(% for various income ranges: 45.1% for AGIs below $25k, 50.9% for AGIs $25k-50k, 56.8% for AGIs $50k-75k, 54.1% for AGIs $75k-100k, 49.6% for AGIs $100k-200k, 68.2% for AGIs over 200k)
Averages for the 2004 tax year for zip code 48176, filed in 2005:
Average Adjusted Gross Income (AGI) in 2004: $75,421 (Individual Income Tax Returns)
Here:
$75,421
State:
$48,204
Salary/wage: $66,688 (reported on 86.2% of returns)
Here:
$66,688
State:
$42,791
(% of AGI for various income ranges: 162.4% for AGIs below $10k, 67.9% for AGIs $10k-25k, 74.7% for AGIs $25k-50k, 78.6% for AGIs $50k-75k, 82.7% for AGIs $75k-100k, 74.0% for AGIs over 100k)
Taxable interest for individuals: $1,687 (reported on 62.5% of returns)
This zip code:
$1,687
Michigan:
$1,725
(% of AGI for various income ranges: 16.0% for AGIs below $10k, 3.9% for AGIs $10k-25k, 2.0% for AGIs $25k-50k, 1.5% for AGIs $50k-75k, 1.1% for AGIs $75k-100k, 1.1% for AGIs over 100k)
Taxable dividends: $3,374 (reported on 41.3% of returns)
Here:
$3,374
State:
$3,420
(% of AGI for various income ranges: 14.1% for AGIs below $10k, 3.5% for AGIs $10k-25k, 1.9% for AGIs $25k-50k, 1.6% for AGIs $50k-75k, 1.5% for AGIs $75k-100k, 1.8% for AGIs over 100k)
Net capital gain/loss: +$9,404 (reported on 32.7% of returns)
Here:
+$9,404
State:
+$8,532
(% of AGI for various income ranges: -7.6% for AGIs below $10k, 0.7% for AGIs $10k-25k, 0.6% for AGIs $25k-50k, 0.7% for AGIs $50k-75k, 0.6% for AGIs $75k-100k, 6.3% for AGIs over 100k)
Profit/loss from business: +$14,943 (reported on 16.0% of returns)
Here:
+$14,943
State:
+$9,547
(% of AGI for various income ranges: 8.9% for AGIs below $10k, 3.6% for AGIs $10k-25k, 3.5% for AGIs $25k-50k, 2.6% for AGIs $50k-75k, 2.0% for AGIs $75k-100k, 3.4% for AGIs over 100k)
IRA payment deduction: $3,161 (reported on 2.6% of returns)
48176:
$3,161
Michigan:
$2,875
(% of AGI for various income ranges: 0.5% for AGIs below $10k, 0.2% for AGIs $10k-25k, 0.2% for AGIs $25k-50k, 0.2% for AGIs $50k-75k, 0.1% for AGIs $75k-100k, 0.1% for AGIs over 100k)
Self-employed pension: $15,083 (reported on 1.5% of returns)
Here:
$15,083
Michigan:
$13,826
(% of AGI for various income ranges: 0.1% for AGIs $50k-75k, 0.1% for AGIs $75k-100k, 0.4% for AGIs over 100k)
Total itemized deductions: $22,312 (19% of AGI, reported on 53.5% of returns)
Here:
$22,312
State:
$18,509
Here:
18.6% of AGI
State:
20.7% of AGI
(% of AGI for various income ranges: 24.6% for AGIs below $10k, 13.2% for AGIs $10k-25k, 15.9% for AGIs $25k-50k, 19.3% for AGIs $50k-75k, 19.6% for AGIs $75k-100k, 14.4% for AGIs over 100k)
Charity contributions deductions: $3,259 (3% of AGI, reported on 49.3% of returns)
Here:
$3,259
State:
$3,365
Here:
2.6% of AGI
State:
3.6% of AGI
(% of AGI for various income ranges: 1.0% for AGIs below $10k, 1.2% for AGIs $10k-25k, 1.7% for AGIs $25k-50k, 2.2% for AGIs $50k-75k, 2.4% for AGIs $75k-100k, 2.2% for AGIs over 100k)
Total tax: $13,116 (reported on 83.0% of returns)
48176:
$13,116
State:
$7,691
(% of AGI for various income ranges: 4.5% for AGIs below $10k, 4.9% for AGIs $10k-25k, 7.8% for AGIs $25k-50k, 8.8% for AGIs $50k-75k, 9.6% for AGIs $75k-100k, 18.0% for AGIs over 100k)
Earned income credit: $1,385 (reported on 4.7% of returns)
Here:
$1,385
State:
$1,737
Percentage of individuals using paid preparers for their 2004 taxes: 51.5%
Here:
52%
State:
60%
(% for various income ranges: 41.9% for AGIs below $10k, 53.0% for AGIs $10k-25k, 55.5% for AGIs $25k-50k, 54.9% for AGIs $50k-75k, 51.6% for AGIs $75k-100k, 53.8% for AGIs over 100k)
Likely homosexual households (counted as self-reported same-sex unmarried-partner households)
Lesbian couples: 0.1% of all households
Gay men: 0.0% of all households
Household received Food Stamps/SNAP in the past 12 months: 232 Household did not receive Food Stamps/SNAP in the past 12 months: 8,411
Women who had a birth in the past 12 months: 212 (217 now married, 0 unmarried) Women who did not have a birth in the past 12 months: 4,150 (2,076 now married, 2,064 unmarried)
Housing units in zip code 48176 with a mortgage: 4,790 (582 second mortgage, 8 home equity loan, 557 both second mortgage and home equity loan) Houses without a mortgage: 21
Median monthly owner costs for units with a mortgage: $2,081 Median monthly owner costs for units without a mortgage: $876
Residents with income below the poverty level in 2022:
This zip code:
5.1%
Whole state:
13.4%
Residents with income below 50% of the poverty level in 2022:
This zip code:
2.2%
Whole state:
6.9%
Median number of rooms in houses and condos:
Here:
7.5
State:
6.5
Median number of rooms in apartments:
Here:
3.9
State:
4.3
Notable locations in this zip code not listed on our city pages
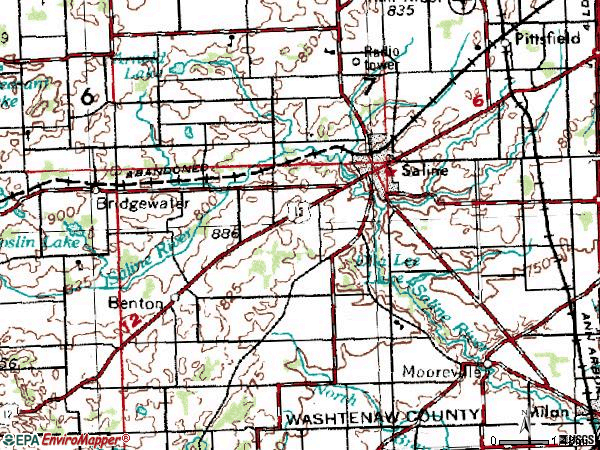
Notable locations in zip code 48176: Saline Station (A), Rustic Glen Golf Course (B), Travis Pointe Country Club (C), Brookside Golf Course (D), Toyota Technical Center (E), Depot Musuem (F), Rentschler Farm Museum (G), Saline Police Department (H), Saline District Library (I), Huron Valley Ambulance Saline (J), Saline Health Center (K), Saline Professional Office Building (L), Saline Area Fire Department (M), Pittsfield Charter Township Fire Department Station 1 Headquarters (N). Display/hide their locations on the map
Churches in zip code 48176 include: Church of Christ (A), Fellowship Baptist Church (B), Saline First Assembly of God Church (C), Saint Andrew's Catholic Church (D), First Presbyterian Church (E), Trinity Lutheran Church (F), New Life Tabernacle Church (G), Saline Baptist Church (H), Oakwood Baptist Church (I). Display/hide their locations on the map
Cemeteries: Union Cemetery (1), Saint James Cemetery (2), Benton Cemetery (3), Lodi Cemetery (4), Oakwood Cemetery (5), Judd Cemetery (6), Saint John's Lutheran Cemetery (7). Display/hide their locations on the map
Parks in zip code 48176 include: Davenport House Historical Marker (1), Saline Presbyterian Church Historical Marker (2), Mary J McCann Park (3), Marsh View Meadows (4), Prairie Park (5), Stonecliff Park (6), Marlpool Tot Lot (7), Risdon Park (8), Peoples Park (9). Display/hide their locations on the map
4,323 married couples with children.
423 single-parent households (164 men, 259 women).
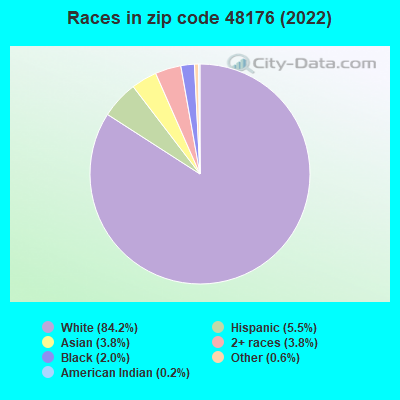
90.0% of residents of 48176 zip code speak English at home.
2.0% of residents speak Spanish at home (86% very well, 8% well, 5% not well).
4.3% of residents speak other Indo-European language at home (80% very well, 11% well, 8% not well, 1% not at all).
3.2% of residents speak Asian or Pacific Island language at home (58% very well, 35% well, 7% not well).
0.7% of residents speak other language at home (90% very well, 7% well, 2% not well).
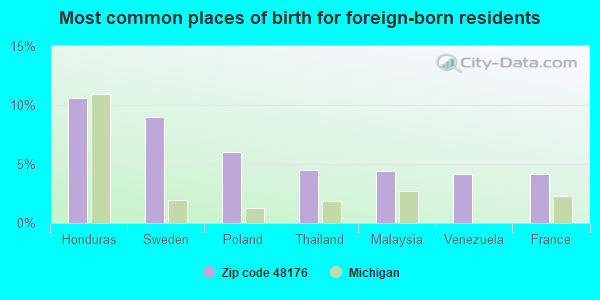
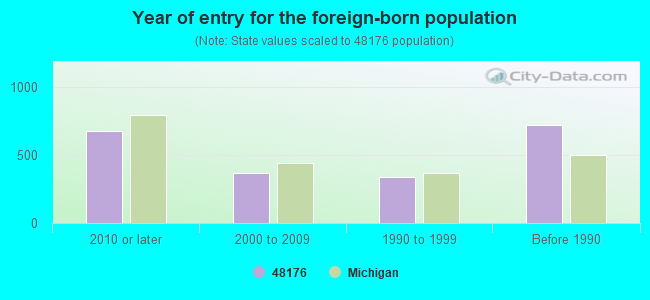
Foreign born population: 1,912 (8.2%) (60.7% of them are naturalized citizens)
This zip code:
8.2%
Whole state:
6.9%
11%Honduras
9%Sweden
6%Poland
4%Thailand
4%Malaysia
4%Venezuela
4%France
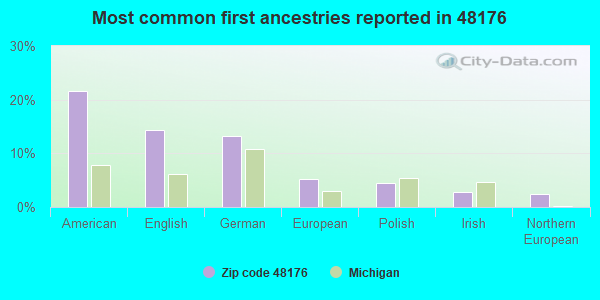
22%American
14%English
13%German
5%European
4%Polish
3%Irish
2%Northern European
Year of entry for the foreign-born population
6782010 or later
3652000 to 2009
3421990 to 1999
721Before 1990
Major facilities with environmental interests located in this zip code:
AIR MAJOR (AIRS/AFS) CRITERIA AND HAZARDOUS AIR POLLUTANT INVENTORY (Inventory of air pollution sources) AIR MAJOR ("Best Available" air pollution technologies tracking) HAZARDOUS WASTE BIENNIAL REPORTER (Resource Conservation and Recovery Act (tracking hazardous waste)) Large Quantity Generators, more that 1000 kg of hazardous waste/month (Resource Conservation and Recovery Act (tracking hazardous waste)) - notification TSD (Resource Conservation and Recovery Act (tracking hazardous waste)) - notification TRI REPORTER (Tracking of toxic chemicals releasing facilities) Business SIC classification: ELECTRONIC COMPONENTS; MOTOR VEHICLE PARTS AND ACCESSORIES Alternative names: FORD MOTOR CO., FORD MOTOR CO SALINE PLT, FORD MOTOR CO., VISTEON CORPoration, VISTEON CORP. SALINE PLANT
AMERICAN SOY PRODUCTS, INC. (1474 WOODLAND DR in SALINE, MI)
(Integrated Compliance Information System) - ICIS-05-1997-0254, FORMAL ENFORCEMENT ACTION
AMOCO OIL CO (924 E MICHIGAN in SALINE, MI)
(Resource Conservation and Recovery Act (tracking hazardous waste)) Organizations: AMOCO OIL COMPANY (CONTACT/OWNER)
, BP PRODUCTS NORTH AMERICA INC (CONTACT/OWNER)
Alternative names: AMOCO OIL CO 3681
BEMIS FARMS INC (77 BEMIS ROAD in SALINE, MI)
(Resource Conservation and Recovery Act (tracking hazardous waste)) Organizations: PRISCILLA KING (CONTACT/OWNER)
MI DEPT/TRANSPORTATION BRIDGE B01-81031 (US-12 OVER SALINE RIVER in SALINE, MI)
(Resource Conservation and Recovery Act (tracking hazardous waste)) Organizations: MICH DEPT OF TRANSPORTATION (CONTACT/OPERATOR)
Alternative names: MIDOT BRIDGE US-12 OVER SALINE RIVER
CHELSEA INDUSTRIES INC (151 SOUTH INDUSTRIAL in SALINE, MI)
(Resource Conservation and Recovery Act (tracking hazardous waste)) Business NAICS classification: STEEL WIRE DRAWING. Organizations: STONEBRIDGE INDUSTRIES INC (CONTACT/OWNER)
ASSOCIATED SPRING SALINE (1445 BARNES CT. in SALINE, MI)
Conditionally Exempt Small Quantity Generators, less than 100 kg/month of hazardous waste (Resource Conservation and Recovery Act (tracking hazardous waste)) TRI REPORTER (Tracking of toxic chemicals releasing facilities) Business SIC classification: WIRE SPRINGS Business NAICS classification: MACHINE TOOL (METAL FORMING TYPES) MANUFACTURING. Organizations: ASSOCIATED SPRING BARNES GROUP (CONTACT/OWNER)
Alternative names: ASSOCIATED SPRING BARNES GROUP
MCNAUGHTON AND GUNN INC (960 WOODLAND DR in SALINE, MI)
Small Quantity Generators, between 100 kg and 1000 kg of hazardous waste/month (Resource Conservation and Recovery Act (tracking hazardous waste)) Business NAICS classification: BOOKS PRINTING.; PREPRESS SERVICES. Organizations: JAL ASSOCIATES (CONTACT/OWNER)
MI DEPT/ENVIRONMENTAL QUALITY (199 & 201 W MICHIGAN AVE in SALINE, MI)
(Resource Conservation and Recovery Act (tracking hazardous waste)) Alternative names: MI DEPT/ENVIRONMENTAL QUALITY RRD
MI DEPT/NATURAL RESOURCES (8910 SALINE MILAN RD in SALINE, MI)
(Resource Conservation and Recovery Act (tracking hazardous waste)) Alternative names: MIDNR SALINE FISHERIES STATION
FENDER MENDER THE (202 W BENNETT in SALINE, MI)
(Resource Conservation and Recovery Act (tracking hazardous waste))
GORDONS FARMS (4620 WILLOW ROAD in SALINE, MI)
National Pollutant Discharge Elimination System NON-MAJOR (Tracking pollutant discharge elimination systems) - permit
Housing units lacking complete plumbing facilities: 0.3% Housing units lacking complete kitchen facilities: 2.5%
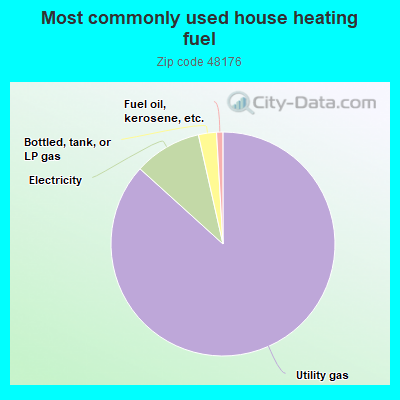
86.2%Utility gas
9.7%Electricity
2.6%Bottled, tank, or LP gas
0.9%Fuel oil, kerosene, etc.
Population in 1990: 13,356. Population change in the 1990s: +4,998 (+37.4%).
Place of birth for U.S.-born residents:
This state: 15,007
Northeast: 1,223
Midwest: 2,797
South: 1,602
West: 475
57% of the 48176 zip code residents lived in the same house 5 years ago. Out of people who lived in different houses, 58% lived in this county. Out of people who lived in different counties, 50% lived in Michigan.
93% of the 48176 zip code residents lived in the same house 1 year ago. Out of people who lived in different houses, 54% moved from this county. Out of people who lived in different houses, 31% moved from different county within same state. Out of people who lived in different houses, 14% moved from different state. Out of people who lived in different houses, 2% moved from abroad.
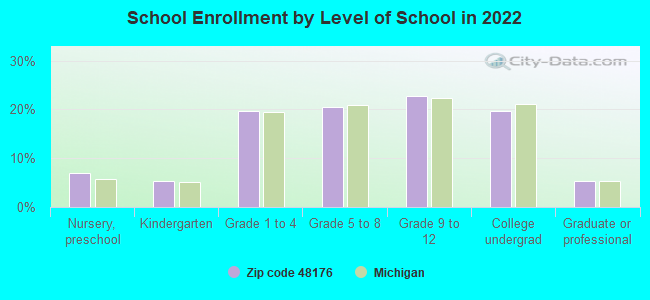
Private vs. public school enrollment:
Students in private schools in grades 1 to 8 (elementary and middle school): 215
Here:
9.5%
Michigan:
12.4%
Students in private schools in grades 9 to 12 (high school): 52
Here:
4.1%
Michigan:
9.8%
Students in private undergraduate colleges: 95
Here:
8.6%
Michigan:
14.9%
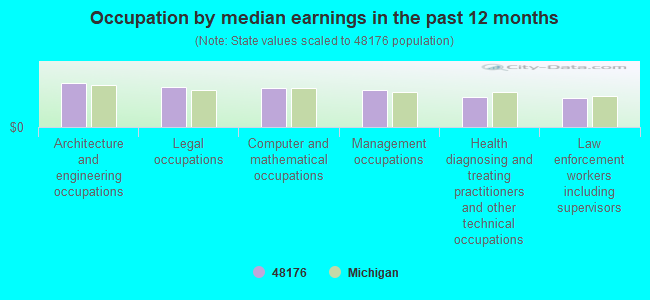
Occupation by median earnings in the past 12 months ($)
123,601Architecture and engineering occupations
111,879Legal occupations
109,795Computer and mathematical occupations
105,065Management occupations
85,219Health diagnosing and treating practitioners and other technical occupations
80,143Law enforcement workers including supervisors
Companies with federal contracts located in this zip code (SALINE, MI):
MIDWEST MICROWAVE, INC (6564 SOUTH STATE RD; small business) : $1,584,158 in 105 contractsfrom 2000 to 2006
Contracts for Miscellaneous Communication Equipment, Antennas, Waveguides, and Related Equipment, Connectors, Electrical, Other Defense -- Applied Research and Exploratory Development (R&D), and moreby Defense Logistics Agency, Air Force, Navy, Army, and others Signed by year:2000: $147,235; 2001: $0; 2002: $176,503; 2003: $115,842; 2004: $341,103; 2005: $612,235; 2006: $191,240.
Biggest contracts:
$98,350 with Defense Logistics Agency for Miscellaneous Communication Equipment. Signed on 2000-11-21. Completion date: 2001-05-20.
$96,419, same as above.Signed on 2006-05-25. Completion date: 2006-10-27.
$95,800 with Defense Logistics Agency for Antennas, Waveguides, and Related Equipment. Signed on 2004-01-06. Completion date: 2004-05-11.
$87,017 with Defense Logistics Agency for Miscellaneous Communication Equipment. Signed on 2005-06-11. Completion date: 2005-12-08.
MUNROE PROCESS TECHNOLOGIES (118 E MICHIGAN AVE; small business) : $123,199 in 21 contractsfrom 2003 to 2004
Contracts for Phonographs, Radio and Television Sets: Home Type, Motors, Electrical, Relays and Solenoids, Headsets, Handsets, Microphones and Speakers, and moreby Army Signed by year:2000: $0; 2001: $0; 2002: $0; 2003: $21,101; 2004: $102,098; 2005: $0; 2006: $0.
Biggest contracts:
$15,859 with Army for Phonographs, Radio and Television Sets: Home Type. Taking place in NY. Signed on 2003-11-17. Completion date: 2003-12-14.
$13,165 with Army for Motors, Electrical. Taking place in NY. Signed on 2004-07-13. Completion date: 2004-10-19.
$9,855 with Army for Relays and Solenoids. Taking place in NY. Signed on 2004-04-13. Completion date: 2004-06-01.
$9,103 with Army for Headsets, Handsets, Microphones and Speakers. Taking place in NY. Signed on 2004-04-27. Completion date: 2004-06-04.
SCRUB-A-HOME INC (10400 MOOREVILLE RD; small business)
$69,500 with Air Force for Miscellaneous Service and Trade Equipment. Taking place in SC. Signed on 2004-03-12. Completion date: 2004-03-29.
ESK CERAMICS USA (1201 N INDUSTRIAL DR; small business)
$7,832 with Army for Chemicals. Signed on 2005-09-06. Completion date: 2005-10-05.
Top industries in this zip code by the number of employees in 2005:
Health Care and Social Assistance: Nursing Care Facilities (250-499 employees: 1 establishment, 20-49 employees: 1 establishment)
Health Care and Social Assistance: General Medical and Surgical Hospitals (250-499: 1)
2002 - 2018 National Fire Incident Reporting System (NFIRS) incidents
According to the data from the years 2002 - 2018 the average number of fire incidents per year is 31. The highest number of fire incidents - 63 took place in 2017, and the least - 8 in 2013. The data has an increasing trend.
When looking into fire subcategories, the most incidents belonged to: Structure Fires (39.0%), and Outside Fires (33.1%).
Fire incident types reported to NFIRS in Zip Code 48176


 Nearest zip codes: 48103, 49236, 48108, 49229, 49286, 48160.


 According to the data from the years 2002 - 2018 the average number of fire incidents per year is 31. The highest number of fire incidents - 63 took place in 2017, and the least - 8 in 2013. The data has an increasing trend.
 When looking into fire subcategories, the most incidents belonged to: Structure Fires (39.0%), and Outside Fires (33.1%).