Estimated zip code population in 2022: 3,370 Zip code population in 2010: 3,245 Zip code population in 2000: 3,085
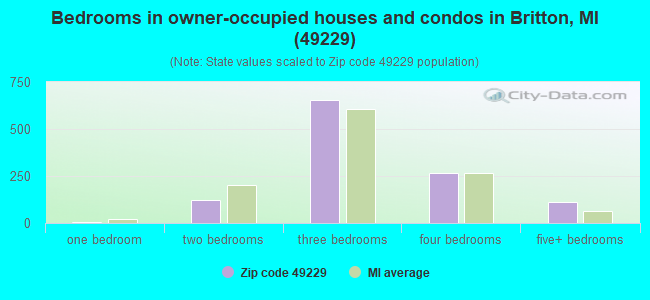
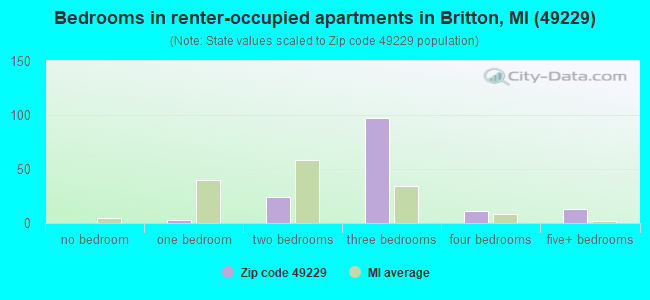
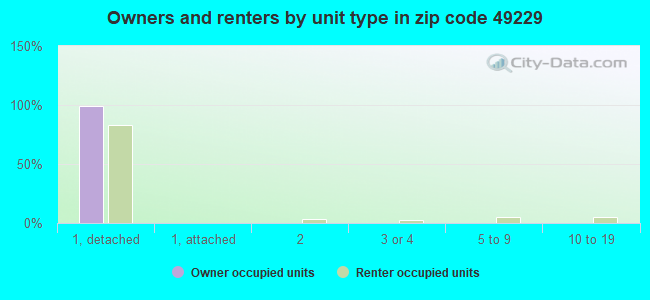
Houses and condos: 1,457 Renter-occupied apartments: 150
% of renters here:
11%
State:
27%
March 2022 cost of living index in zip code 49229: 90.4 (less than average, U.S. average is 100)
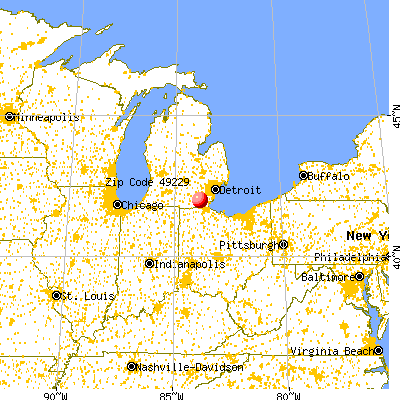
Land area: 55.1 sq. mi. Water area: 0.0 sq. mi.
Population density: 61 people per square mile
(very low).
OSM Map
General Map
Google Map
MSN Map
OSM Map
General Map
Google Map
MSN Map
OSM Map
General Map
Google Map
MSN Map
OSM Map
General Map
Google Map
MSN Map
Please wait while loading the map...
Real estate property taxes paid for housing units in 2022:
This zip code:
1.1% ($2,658)
Michigan:
1.2% ($2,746)
Median real estate property taxes paid for housing units with mortgages in 2022: $2,873 (1.2%) Median real estate property taxes paid for housing units with no mortgage in 2022: $2,229 (1.2%)
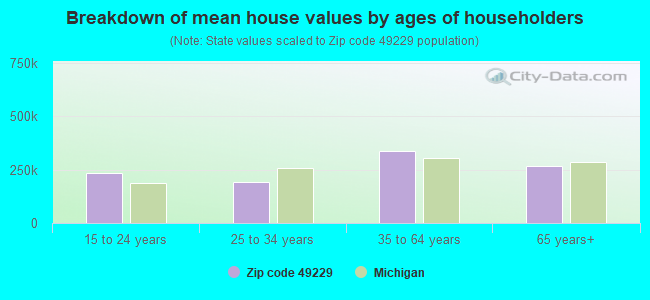
Estimated median house/condo value in 2022: $234,889
49229:
$234,889
Michigan:
$224,400
According to our research of Michigan and other state lists, there were 7 registered sex offenders living in 49229 zip code as of April 27, 2024. The ratio of all residents to sex offenders in zip code 49229 is 487 to 1. The ratio of registered sex offenders to all residents in this zip code is lower than the state average.
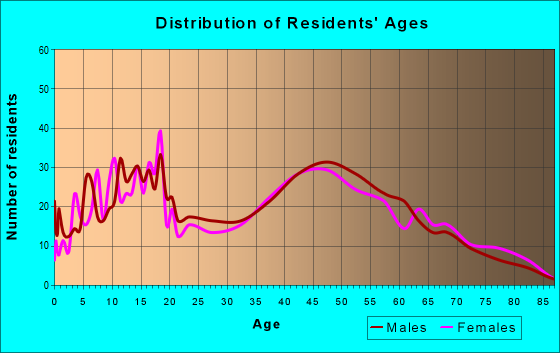
Median resident age:
This zip code:
45.4 years
Michigan median age:
40.3 years
Average household size:
This zip code:
2.6 people
Michigan:
2.4 people
Averages for the 2020 tax year for zip code 49229, filed in 2021:
Average Adjusted Gross Income (AGI) in 2020: $62,905 (Individual Income Tax Returns)
Here:
$62,905
State:
$68,945
Salary/wage: $59,473 (reported on 80.1% of returns)
Here:
$59,473
State:
$57,142
(% of AGI for various income ranges: 966.0% for AGIs below $25k, 3261.0% for AGIs $25k-50k, 6117.2% for AGIs $50k-75k, 9145.8% for AGIs $75k-100k, 15689.5% for AGIs $100k-200k)
Taxable interest for individuals: $596 (reported on 29.5% of returns)
This zip code:
$596
Michigan:
$1,630
(% of AGI for various income ranges: 9.7% for AGIs below $25k, 18.0% for AGIs $25k-50k, 33.3% for AGIs $50k-75k, 41.7% for AGIs $75k-100k, 38.6% for AGIs $100k-200k)
Ordinary dividends: $2,983 (reported on 19.2% of returns)
Here:
$2,983
State:
$6,972
(% of AGI for various income ranges: 15.7% for AGIs below $25k, 37.7% for AGIs $25k-50k, 48.3% for AGIs $50k-75k, 70.0% for AGIs $75k-100k, 201.4% for AGIs $100k-200k)
Net capital gain/loss in AGI: +$4,923 (reported on 16.7% of returns)
Here:
+$4,923
State:
+$20,064
(% of AGI for various income ranges: 14.7% for AGIs below $25k, 15.7% for AGIs $25k-50k, 58.3% for AGIs $50k-75k, 68.3% for AGIs $75k-100k, 477.1% for AGIs $100k-200k)
Profit/loss from business: +$6,555 (reported on 12.8% of returns)
Here:
+$6,555
State:
+$11,172
(% of AGI for various income ranges: 63.7% for AGIs below $25k, 87.7% for AGIs $25k-50k, 141.1% for AGIs $50k-75k, 309.2% for AGIs $75k-100k, 110.5% for AGIs $100k-200k)
Taxable individual retirement arrangement distribution: $15,167 (reported on 9.6% of returns)
49229:
$15,167
Michigan:
$19,803
(% of AGI for various income ranges: 79.0% for AGIs below $25k, 97.3% for AGIs $25k-50k, 517.8% for AGIs $50k-75k, 387.6% for AGIs $100k-200k)
Total itemized deductions: $24,500 (reported on 3.2% of returns)
Here:
$24,500
State:
$34,117
(% of AGI for various income ranges: 140.3% for AGIs $25k-50k, 382.9% for AGIs $100k-200k)
Charity contributions: $10,900 (reported on 1.9% of returns)
Here:
$10,900
State:
$13,548
(% of AGI for various income ranges: 155.7% for AGIs $100k-200k)
Taxes paid: $7,760 (reported on 3.2% of returns)
49229:
$7,760
State:
$7,972
(% of AGI for various income ranges: 45.3% for AGIs $25k-50k, 120.0% for AGIs $100k-200k)
Earned income credit: $1,780 (reported on 9.6% of returns)
Here:
$1,780
State:
$2,251
(% of AGI for various income ranges: 39.7% for AGIs below $25k, 49.3% for AGIs $25k-50k)
Percentage of individuals using paid preparers for their 2020 taxes: 94.9%
Here:
95%
State:
93%
(% for various income ranges: 93.0% for AGIs below $25k, 97.3% for AGIs $25k-50k, 92.0% for AGIs $50k-75k, 94.1% for AGIs $75k-100k, 96.8% for AGIs $100k-200k, 100.0% for AGIs over 200k)
Averages for the 2012 tax year for zip code 49229, filed in 2013:
Average Adjusted Gross Income (AGI) in 2012: $54,354 (Individual Income Tax Returns)
Here:
$54,354
State:
$55,609
Salary/wage: $48,627 (reported on 85.5% of returns)
Here:
$48,627
State:
$46,782
(% of AGI for various income ranges: 65.4% for AGIs below $25k, 74.0% for AGIs $25k-50k, 76.2% for AGIs $50k-75k, 77.5% for AGIs $75k-100k, 100.7% for AGIs $100k-200k)
Taxable interest for individuals: $696 (reported on 34.2% of returns)
This zip code:
$696
Michigan:
$1,491
(% of AGI for various income ranges: 1.0% for AGIs below $25k, 0.7% for AGIs $25k-50k, 0.7% for AGIs $50k-75k, 0.2% for AGIs $75k-100k, 0.3% for AGIs $100k-200k)
Ordinary dividends: $2,348 (reported on 17.8% of returns)
Here:
$2,348
State:
$6,225
(% of AGI for various income ranges: 2.5% for AGIs below $25k, 0.9% for AGIs $25k-50k, 0.7% for AGIs $50k-75k, 0.8% for AGIs $75k-100k, 0.5% for AGIs $100k-200k)
Net capital gain/loss in AGI: +$47 (reported on 12.5% of returns)
Here:
+$47
State:
+$9,326
(% of AGI for various income ranges: 0.2% for AGIs $100k-200k)
Profit/loss from business: +$5,347 (reported on 12.5% of returns)
Here:
+$5,347
State:
+$11,523
(% of AGI for various income ranges: 1.8% for AGIs below $25k, 1.2% for AGIs $25k-50k, 0.7% for AGIs $50k-75k, 0.6% for AGIs $75k-100k, 2.0% for AGIs $100k-200k)
Taxable individual retirement arrangement distribution: $10,031 (reported on 10.5% of returns)
49229:
$10,031
Michigan:
$15,298
(% of AGI for various income ranges: 3.6% for AGIs below $25k, 1.9% for AGIs $25k-50k, 2.1% for AGIs $50k-75k, 2.2% for AGIs $75k-100k, 1.9% for AGIs $100k-200k)
Total itemized deductions: $18,273 (19% of AGI, reported on 33.6% of returns)
Here:
$18,273
State:
$21,628
Here:
19.3% of AGI
State:
18.4% of AGI
(% of AGI for various income ranges: 11.8% for AGIs below $25k, 8.4% for AGIs $25k-50k, 10.4% for AGIs $50k-75k, 13.1% for AGIs $75k-100k, 12.5% for AGIs $100k-200k, 8.9% for AGIs over 200k)
Charity contributions: $2,251 (reported on 27.0% of returns)
Here:
$2,251
State:
$4,225
(% of AGI for various income ranges: 0.8% for AGIs below $25k, 0.8% for AGIs $25k-50k, 0.8% for AGIs $50k-75k, 1.5% for AGIs $75k-100k, 1.6% for AGIs $100k-200k)
Taxes paid: $6,837 (reported on 33.6% of returns)
49229:
$6,837
State:
$8,327
(% of AGI for various income ranges: 1.9% for AGIs below $25k, 2.0% for AGIs $25k-50k, 3.7% for AGIs $50k-75k, 4.5% for AGIs $75k-100k, 5.7% for AGIs $100k-200k, 5.2% for AGIs over 200k)
Earned income credit: $2,211 (reported on 12.5% of returns)
Here:
$2,211
State:
$2,306
(% of AGI for various income ranges: 4.3% for AGIs below $25k, 1.1% for AGIs $25k-50k)
Percentage of individuals using paid preparers for their 2012 taxes: 59.2%
Here:
59%
State:
57%
(% for various income ranges: 54.5% for AGIs below $25k, 60.0% for AGIs $25k-50k, 61.9% for AGIs $50k-75k, 61.1% for AGIs $75k-100k, 61.9% for AGIs $100k-200k, 100.0% for AGIs over 200k)
Averages for the 2004 tax year for zip code 49229, filed in 2005:
Average Adjusted Gross Income (AGI) in 2004: $47,937 (Individual Income Tax Returns)
Here:
$47,937
State:
$48,204
Salary/wage: $45,969 (reported on 87.5% of returns)
Here:
$45,969
State:
$42,791
(% of AGI for various income ranges: 89.8% for AGIs below $10k, 65.1% for AGIs $10k-25k, 77.4% for AGIs $25k-50k, 85.7% for AGIs $50k-75k, 93.0% for AGIs $75k-100k, 82.1% for AGIs over 100k)
Taxable interest for individuals: $910 (reported on 50.8% of returns)
This zip code:
$910
Michigan:
$1,725
(% of AGI for various income ranges: 4.8% for AGIs below $10k, 3.2% for AGIs $10k-25k, 1.3% for AGIs $25k-50k, 0.6% for AGIs $50k-75k, 0.5% for AGIs $75k-100k, 0.7% for AGIs over 100k)
Taxable dividends: $1,154 (reported on 24.1% of returns)
Here:
$1,154
State:
$3,420
(% of AGI for various income ranges: 1.8% for AGIs below $10k, 1.5% for AGIs $10k-25k, 0.7% for AGIs $25k-50k, 0.2% for AGIs $50k-75k, 0.3% for AGIs $75k-100k, 0.7% for AGIs over 100k)
Net capital gain/loss: +$3,918 (reported on 17.4% of returns)
Here:
+$3,918
State:
+$8,532
(% of AGI for various income ranges: -0.8% for AGIs below $10k, -0.1% for AGIs $10k-25k, 0.5% for AGIs $25k-50k, 1.4% for AGIs $50k-75k, 0.8% for AGIs $75k-100k, 3.1% for AGIs over 100k)
Profit/loss from business: +$6,031 (reported on 12.5% of returns)
Here:
+$6,031
State:
+$9,547
(% of AGI for various income ranges: -1.7% for AGIs below $10k, 4.8% for AGIs $10k-25k, 2.9% for AGIs $25k-50k, -0.1% for AGIs $50k-75k, -0.1% for AGIs $75k-100k, 3.1% for AGIs over 100k)
IRA payment deduction: $2,231 (reported on 0.8% of returns)
49229:
$2,231
Michigan:
$2,875
Total itemized deductions: $15,372 (20% of AGI, reported on 41.6% of returns)
Here:
$15,372
State:
$18,509
Here:
20.4% of AGI
State:
20.7% of AGI
(% of AGI for various income ranges: 12.1% for AGIs $10k-25k, 11.6% for AGIs $25k-50k, 14.9% for AGIs $50k-75k, 15.0% for AGIs $75k-100k, 12.6% for AGIs over 100k)
Charity contributions deductions: $1,896 (2% of AGI, reported on 36.8% of returns)
Here:
$1,896
State:
$3,365
Here:
2.4% of AGI
State:
3.6% of AGI
(% of AGI for various income ranges: 0.8% for AGIs $10k-25k, 1.5% for AGIs $25k-50k, 1.5% for AGIs $50k-75k, 1.4% for AGIs $75k-100k, 1.7% for AGIs over 100k)
Total tax: $5,908 (reported on 79.6% of returns)
49229:
$5,908
State:
$7,691
(% of AGI for various income ranges: 2.5% for AGIs below $10k, 4.6% for AGIs $10k-25k, 6.5% for AGIs $25k-50k, 8.3% for AGIs $50k-75k, 9.5% for AGIs $75k-100k, 15.0% for AGIs over 100k)
Earned income credit: $1,738 (reported on 7.0% of returns)
Here:
$1,738
State:
$1,737
Percentage of individuals using paid preparers for their 2004 taxes: 62.9%
Here:
63%
State:
60%
(% for various income ranges: 54.4% for AGIs below $10k, 64.8% for AGIs $10k-25k, 65.0% for AGIs $25k-50k, 60.2% for AGIs $50k-75k, 64.5% for AGIs $75k-100k, 72.3% for AGIs over 100k)
Household received Food Stamps/SNAP in the past 12 months: 138 Household did not receive Food Stamps/SNAP in the past 12 months: 1,162
Women who had a birth in the past 12 months: 19 (15 now married, 3 unmarried) Women who did not have a birth in the past 12 months: 725 (352 now married, 371 unmarried)
Housing units in zip code 49229 with a mortgage: 783 (80 second mortgage, 64 both second mortgage and home equity loan) Houses without a mortgage: 3
Median monthly owner costs for units with a mortgage: $1,494 Median monthly owner costs for units without a mortgage: $583
Residents with income below the poverty level in 2022:
This zip code:
5.4%
Whole state:
13.4%
Residents with income below 50% of the poverty level in 2022:
This zip code:
3.4%
Whole state:
6.9%
Median number of rooms in houses and condos:
Here:
6.7
State:
6.5
Median number of rooms in apartments:
Here:
5.8
State:
4.3
Notable locations in this zip code not listed on our city pages
Notable locations in zip code 49229: Britton Station (A), Holloway Station (B), Britton Fire Department (C), Britton Library (D), Ridgeway Township Hall (E), Ridgeway Township Fire Department (F), Raisin Township Fire Department Annex (G). Display/hide their locations on the map
Churches in zip code 49229 include: Emmanuel Church (A), Grace Church (B), Congregational Christian Church (C), Britton Bethel Baptist Church (D), Ridgeway Church of the Nazarene (E), Raisin Presbyterian Church (F). Display/hide their locations on the map
Size of family households: 450 2-persons, 207 3-persons, 246 4-persons, 63 5-persons, 13 6-persons, 4 7-or-more-persons
Size of nonfamily households: 246 1-person, 61 2-persons, 4 3-persons
529 married couples with children.
77 single-parent households (8 men, 69 women).
97.5% of residents of 49229 zip code speak English at home.
0.7% of residents speak Spanish at home (100% very well).
0.7% of residents speak other Indo-European language at home (70% very well, 30% well).
0.2% of residents speak Asian or Pacific Island language at home (100% very well).
0.2% of residents speak other language at home (100% very well).
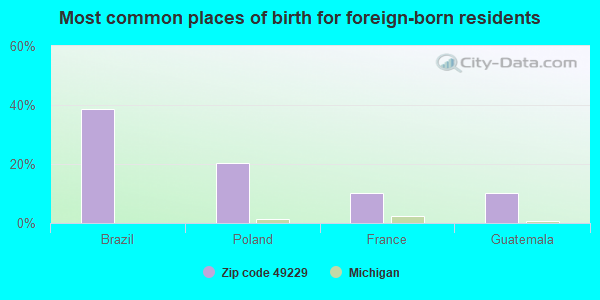
Foreign born population: 49 (1.5%) (64.5% of them are naturalized citizens)
This zip code:
1.5%
Whole state:
6.9%
39%Brazil
20%Poland
10%France
10%Guatemala
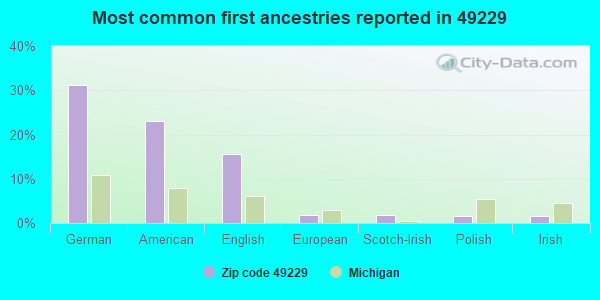
31%German
23%American
16%English
2%European
2%Scotch-Irish
2%Polish
1%Irish
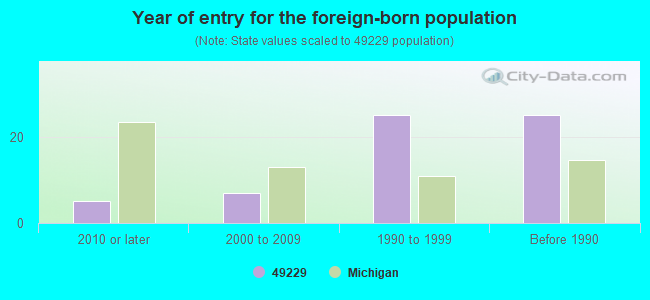
Year of entry for the foreign-born population
52010 or later
72000 to 2009
251990 to 1999
25Before 1990
Facilities with environmental interests located in this zip code:
MI DEPT/ENVIRONMENTAL QUALITY (2420 PALMER HWY in BRITTON, MI)
(Resource Conservation and Recovery Act (tracking hazardous waste)) Alternative names: MI DEPT/DEQ
Housing units lacking complete plumbing facilities: 5.0% Housing units lacking complete kitchen facilities: 2.3%
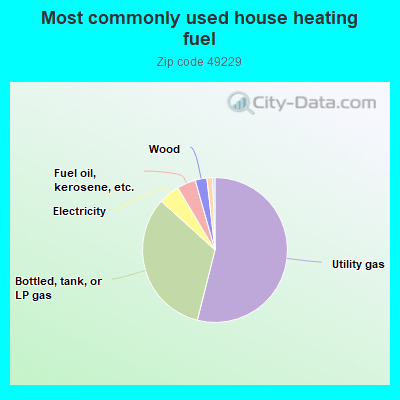
54.1%Utility gas
32.9%Bottled, tank, or LP gas
4.7%Electricity
4.2%Fuel oil, kerosene, etc.
2.6%Wood
1.3%Other fuel
0.5%No fuel used
Population in 1990: 2,553. Population change in the 1990s: +532 (+20.8%).
Place of birth for U.S.-born residents:
This state: 2,777
Northeast: 33
Midwest: 328
South: 76
West: 86
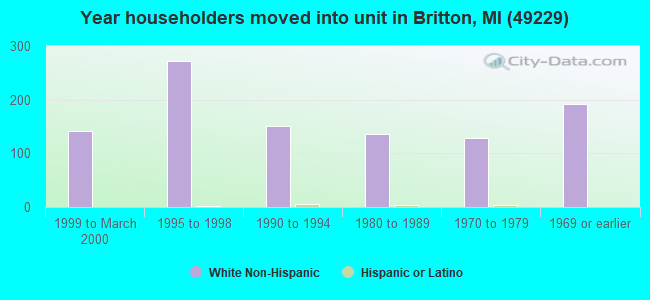
65% of the 49229 zip code residents lived in the same house 5 years ago. Out of people who lived in different houses, 53% lived in this county. Out of people who lived in different counties, 50% lived in Michigan.
96% of the 49229 zip code residents lived in the same house 1 year ago. Out of people who lived in different houses, 24% moved from this county. Out of people who lived in different houses, 54% moved from different county within same state. Out of people who lived in different houses, 31% moved from different state.
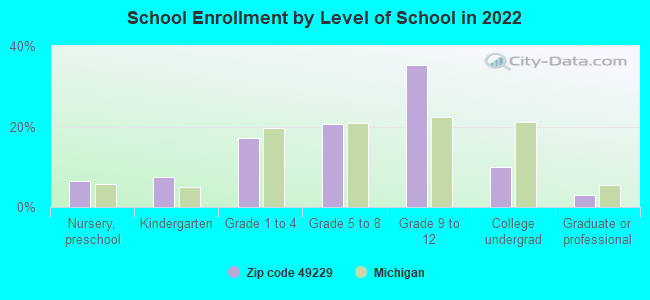
Private vs. public school enrollment:
Students in private schools in grades 1 to 8 (elementary and middle school): 25
Here:
9.8%
Michigan:
12.4%
Students in private schools in grades 9 to 12 (high school): 10
Here:
4.2%
Michigan:
9.8%
Students in private undergraduate colleges: 16
Here:
24.3%
Michigan:
14.9%
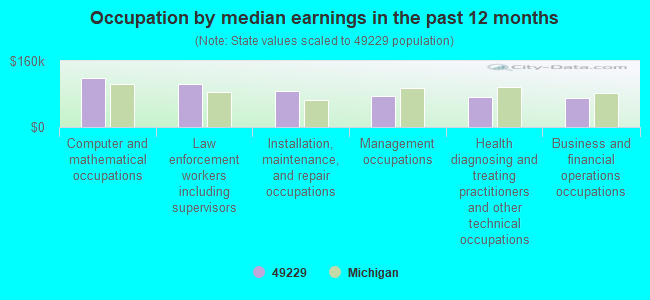
Occupation by median earnings in the past 12 months ($)
119,802Computer and mathematical occupations
104,002Law enforcement workers including supervisors
88,100Installation, maintenance, and repair occupations
75,202Management occupations
71,599Health diagnosing and treating practitioners and other technical occupations
69,365Business and financial operations occupations
Top industries in this zip code by the number of employees in 2005:
Construction: New Single-Family Housing Construction (except Operative Builders) (5-9 employees: 3 establishments, 1-4 employees: 3 establishments)
Wholesale Trade: Grain and Field Bean Merchant Wholesalers (10-19: 1)
Construction: Site Preparation Contractors (10-19: 1)
Other Services (except Public Administration): Religious Organizations (5-9: 1, 1-4: 2)
Accommodation and Food Services: Drinking Places (Alcoholic Beverages) (5-9: 1)
Wholesale Trade: Other Miscellaneous Durable Goods Merchant Wholesalers (5-9: 1)
Health Care and Social Assistance: Child Day Care Services (5-9: 1)
Wholesale Trade: Industrial Machinery and Equipment Merchant Wholesalers (5-9: 1)
Construction: Framing Contractors (1-4: 2)
People in group quarters in 2000:
11 people in homes or halfway houses for drug/alcohol abuse
6 people in other group homes
Fatal accident statistics in 2011:
Fatal accident count: 1
Vehicles involved in fatal accidents: 1
Fatal accidents caused by drunken drivers: 0
Fatalities: 1
Persons involved in fatal accidents: 1
Pedestrians involved in fatal accidents: 0
Fatal accident statistics in 2010:
Fatal accident count: 1
Vehicles involved in fatal accidents: 1
Fatal accidents caused by drunken drivers: 0
Fatalities: 1
Persons involved in fatal accidents: 1
Pedestrians involved in fatal accidents: 1
Home Mortgage Disclosure Act Aggregated Statistics For Year 2003 (Based on 6 partial tracts)
A) FHA, FSA/RHS & VA Home Purchase Loans
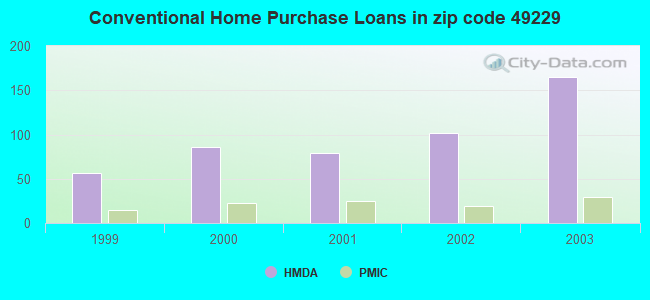
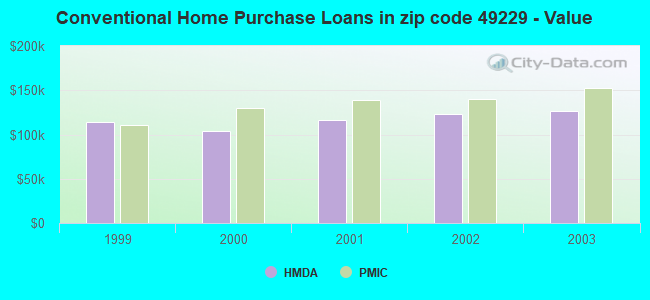
B) Conventional Home Purchase Loans
C) Refinancings
D) Home Improvement Loans
F) Non-occupant Loans on < 5 Family Dwellings (A B C & D)
Number
Average Value
Number
Average Value
Number
Average Value
Number
Average Value
Number
Average Value
LOANS ORIGINATED
12
$146,072
165
$126,653
570
$124,902
24
$24,655
18
$115,815
APPLICATIONS APPROVED, NOT ACCEPTED
1
$163,010
14
$168,770
54
$121,411
4
$17,228
2
$124,035
APPLICATIONS DENIED
5
$127,628
28
$90,861
190
$126,304
25
$49,602
7
$132,751
APPLICATIONS WITHDRAWN
3
$107,557
9
$123,529
70
$136,434
1
$16,200
3
$121,470
FILES CLOSED FOR INCOMPLETENESS
0
$0
1
$257,500
25
$168,198
4
$25,988
1
$257,500
Aggregated Statistics For Year 2002 (Based on 6 partial tracts)
A) FHA, FSA/RHS & VA Home Purchase Loans
B) Conventional Home Purchase Loans
C) Refinancings
D) Home Improvement Loans
F) Non-occupant Loans on < 5 Family Dwellings (A B C & D)
Number
Average Value
Number
Average Value
Number
Average Value
Number
Average Value
Number
Average Value
LOANS ORIGINATED
17
$133,494
102
$123,724
504
$117,381
25
$19,454
13
$75,646
APPLICATIONS APPROVED, NOT ACCEPTED
1
$90,630
14
$104,924
57
$108,091
7
$30,483
2
$74,420
APPLICATIONS DENIED
2
$148,230
20
$76,770
91
$115,614
14
$22,981
2
$63,380
APPLICATIONS WITHDRAWN
1
$151,190
10
$128,132
54
$110,309
1
$63,060
0
$0
FILES CLOSED FOR INCOMPLETENESS
0
$0
2
$152,555
60
$142,623
1
$75,470
1
$165,370
Aggregated Statistics For Year 2001 (Based on 6 partial tracts)
A) FHA, FSA/RHS & VA Home Purchase Loans
B) Conventional Home Purchase Loans
C) Refinancings
D) Home Improvement Loans
F) Non-occupant Loans on < 5 Family Dwellings (A B C & D)
Number
Average Value
Number
Average Value
Number
Average Value
Number
Average Value
Number
Average Value
LOANS ORIGINATED
19
$127,268
79
$115,913
361
$114,180
40
$19,615
7
$102,571
APPLICATIONS APPROVED, NOT ACCEPTED
0
$0
7
$62,449
26
$93,973
9
$14,334
1
$88,590
APPLICATIONS DENIED
3
$107,457
19
$53,752
101
$100,499
23
$15,851
0
$0
APPLICATIONS WITHDRAWN
2
$115,100
5
$109,620
39
$123,035
2
$27,125
0
$0
FILES CLOSED FOR INCOMPLETENESS
0
$0
1
$112,680
11
$107,497
0
$0
0
$0
Aggregated Statistics For Year 2000 (Based on 6 partial tracts)
A) FHA, FSA/RHS & VA Home Purchase Loans
B) Conventional Home Purchase Loans
C) Refinancings
D) Home Improvement Loans
F) Non-occupant Loans on < 5 Family Dwellings (A B C & D)
Number
Average Value
Number
Average Value
Number
Average Value
Number
Average Value
Number
Average Value
LOANS ORIGINATED
18
$119,225
86
$104,289
98
$112,076
30
$28,777
4
$82,670
APPLICATIONS APPROVED, NOT ACCEPTED
1
$142,930
16
$57,323
25
$104,617
13
$26,292
4
$50,215
APPLICATIONS DENIED
6
$109,655
107
$50,026
67
$80,967
15
$14,040
3
$10,403
APPLICATIONS WITHDRAWN
0
$0
6
$71,433
35
$99,415
2
$101,620
2
$102,765
FILES CLOSED FOR INCOMPLETENESS
0
$0
1
$21,710
16
$105,419
0
$0
0
$0
Aggregated Statistics For Year 1999 (Based on 3 partial tracts)
A) FHA, FSA/RHS & VA Home Purchase Loans
B) Conventional Home Purchase Loans
C) Refinancings
D) Home Improvement Loans
F) Non-occupant Loans on < 5 Family Dwellings (A B C & D)
Detailed PMIC statistics for the following Tracts:0601.00
, 0607.00
2002 - 2018 National Fire Incident Reporting System (NFIRS) incidents
According to the data from the years 2002 - 2018 the average number of fire incidents per year is 13. The highest number of reported fire incidents - 34 took place in 2003, and the least - 0 in 2013. The data has an increasing trend.
When looking into fire subcategories, the most reports belonged to: Outside Fires (46.6%), and Structure Fires (41.1%).
Fire incident types reported to NFIRS in Zip Code 49229


 Nearest zip codes: 49238, 49286, 49236, 48176, 49268, 48131.
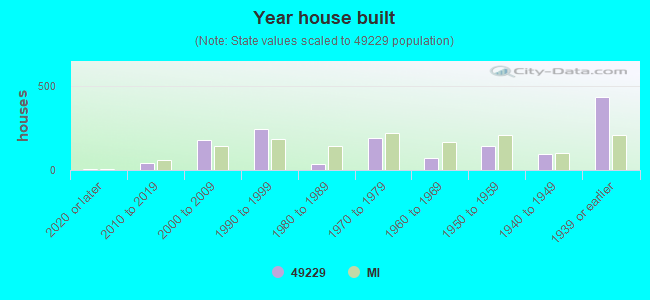


 According to the data from the years 2002 - 2018 the average number of fire incidents per year is 13. The highest number of reported fire incidents - 34 took place in 2003, and the least - 0 in 2013. The data has an increasing trend.
 When looking into fire subcategories, the most reports belonged to: Outside Fires (46.6%), and Structure Fires (41.1%).