Estimated zip code population in 2022: 33,923 Zip code population in 2010: 33,952 Zip code population in 2000: 33,549
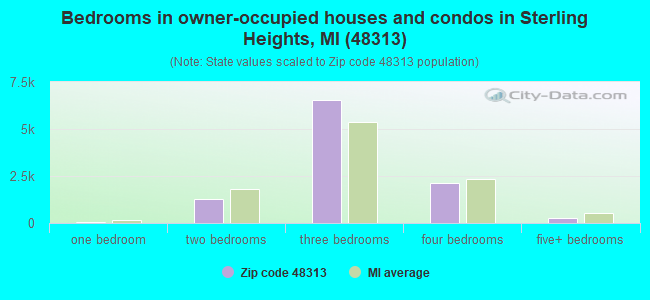
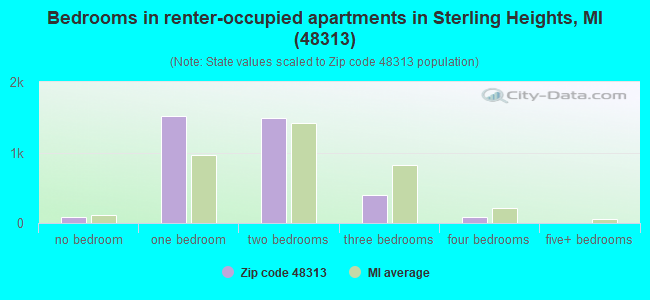
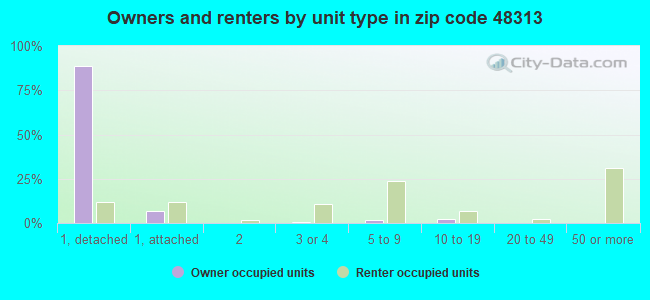
Houses and condos: 14,324 Renter-occupied apartments: 3,545
% of renters here:
26%
State:
27%
March 2022 cost of living index in zip code 48313: 96.2 (near average, U.S. average is 100)
Land area: 9.1 sq. mi. Water area: 0.2 sq. mi.
Population density: 3,738 people per square mile
(average).
OSM Map
General Map
Google Map
MSN Map
OSM Map
General Map
Google Map
MSN Map
OSM Map
General Map
Google Map
MSN Map
OSM Map
General Map
Google Map
MSN Map
Please wait while loading the map...
Real estate property taxes paid for housing units in 2022:
This zip code:
1.2% ($3,151)
Michigan:
1.2% ($2,746)
Median real estate property taxes paid for housing units with mortgages in 2022: $3,310 (1.3%) Median real estate property taxes paid for housing units with no mortgage in 2022: $2,891 (1.1%)
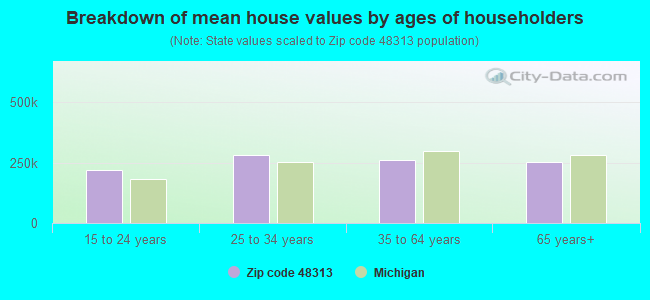
Estimated median house/condo value in 2022: $263,455
48313:
$263,455
Michigan:
$224,400
According to our research of Michigan and other state lists, there were 36 registered sex offenders living in 48313 zip code as of April 27, 2024. The ratio of all residents to sex offenders in zip code 48313 is 947 to 1. The ratio of registered sex offenders to all residents in this zip code is much lower than the state average.
Median resident age:
This zip code:
41.6 years
Michigan median age:
40.3 years
Average household size:
This zip code:
2.4 people
Michigan:
2.4 people
Averages for the 2020 tax year for zip code 48313, filed in 2021:
Average Adjusted Gross Income (AGI) in 2020: $62,804 (Individual Income Tax Returns)
Here:
$62,804
State:
$68,945
Salary/wage: $55,460 (reported on 76.5% of returns)
Here:
$55,460
State:
$57,142
(% of AGI for various income ranges: 975.9% for AGIs below $25k, 3282.0% for AGIs $25k-50k, 6122.0% for AGIs $50k-75k, 8857.7% for AGIs $75k-100k, 16806.4% for AGIs $100k-200k, 58566.2% for AGIs over 200k)
Taxable interest for individuals: $1,041 (reported on 30.9% of returns)
This zip code:
$1,041
Michigan:
$1,630
(% of AGI for various income ranges: 18.5% for AGIs below $25k, 23.2% for AGIs $25k-50k, 49.0% for AGIs $50k-75k, 64.6% for AGIs $75k-100k, 91.0% for AGIs $100k-200k, 664.6% for AGIs over 200k)
Ordinary dividends: $2,956 (reported on 19.1% of returns)
Here:
$2,956
State:
$6,972
(% of AGI for various income ranges: 23.4% for AGIs below $25k, 37.6% for AGIs $25k-50k, 71.4% for AGIs $50k-75k, 93.8% for AGIs $75k-100k, 172.2% for AGIs $100k-200k, 1764.6% for AGIs over 200k)
Net capital gain/loss in AGI: +$6,140 (reported on 17.7% of returns)
Here:
+$6,140
State:
+$20,064
(% of AGI for various income ranges: 6.5% for AGIs below $25k, 26.5% for AGIs $25k-50k, 55.3% for AGIs $50k-75k, 111.5% for AGIs $75k-100k, 371.7% for AGIs $100k-200k, 6945.4% for AGIs over 200k)
Profit/loss from business: +$9,903 (reported on 14.7% of returns)
Here:
+$9,903
State:
+$11,172
(% of AGI for various income ranges: 92.0% for AGIs below $25k, 175.7% for AGIs $25k-50k, 185.9% for AGIs $50k-75k, 148.6% for AGIs $75k-100k, 329.4% for AGIs $100k-200k, 4392.3% for AGIs over 200k)
Taxable individual retirement arrangement distribution: $15,678 (reported on 10.5% of returns)
48313:
$15,678
Michigan:
$19,803
(% of AGI for various income ranges: 74.9% for AGIs below $25k, 122.6% for AGIs $25k-50k, 245.8% for AGIs $50k-75k, 368.0% for AGIs $75k-100k, 568.6% for AGIs $100k-200k, 2116.9% for AGIs over 200k)
Self-employed (Keogh) retirement plans: $16,000 (reported on 0.2% of returns)
48313:
$16,000
Michigan:
$25,132
(% of AGI for various income ranges: 36.4% for AGIs $100k-200k)
Total itemized deductions: $26,817 (reported on 5.2% of returns)
Here:
$26,817
State:
$34,117
(% of AGI for various income ranges: 46.0% for AGIs below $25k, 73.3% for AGIs $25k-50k, 202.1% for AGIs $50k-75k, 336.6% for AGIs $75k-100k, 474.7% for AGIs $100k-200k, 3077.7% for AGIs over 200k)
Charity contributions: $7,162 (reported on 4.0% of returns)
Here:
$7,162
State:
$13,548
(% of AGI for various income ranges: 2.6% for AGIs below $25k, 9.9% for AGIs $25k-50k, 32.5% for AGIs $50k-75k, 49.7% for AGIs $75k-100k, 120.6% for AGIs $100k-200k, 941.5% for AGIs over 200k)
Taxes paid: $7,301 (reported on 5.2% of returns)
48313:
$7,301
State:
$7,972
(% of AGI for various income ranges: 7.7% for AGIs below $25k, 16.9% for AGIs $25k-50k, 56.0% for AGIs $50k-75k, 99.9% for AGIs $75k-100k, 145.1% for AGIs $100k-200k, 664.6% for AGIs over 200k)
Earned income credit: $2,127 (reported on 11.0% of returns)
Here:
$2,127
State:
$2,251
(% of AGI for various income ranges: 64.5% for AGIs below $25k, 62.1% for AGIs $25k-50k, 0.8% for AGIs $50k-75k)
Percentage of individuals using paid preparers for their 2020 taxes: 92.7%
Here:
93%
State:
93%
(% for various income ranges: 91.9% for AGIs below $25k, 92.8% for AGIs $25k-50k, 93.0% for AGIs $50k-75k, 93.0% for AGIs $75k-100k, 93.7% for AGIs $100k-200k, 92.3% for AGIs over 200k)
Averages for the 2012 tax year for zip code 48313, filed in 2013:
Average Adjusted Gross Income (AGI) in 2012: $51,903 (Individual Income Tax Returns)
Here:
$51,903
State:
$55,609
Salary/wage: $48,640 (reported on 83.1% of returns)
Here:
$48,640
State:
$46,782
(% of AGI for various income ranges: 69.1% for AGIs below $25k, 72.0% for AGIs $25k-50k, 76.2% for AGIs $50k-75k, 79.9% for AGIs $75k-100k, 82.1% for AGIs $100k-200k, 78.7% for AGIs over 200k)
Taxable interest for individuals: $933 (reported on 36.5% of returns)
This zip code:
$933
Michigan:
$1,491
(% of AGI for various income ranges: 1.2% for AGIs below $25k, 0.8% for AGIs $25k-50k, 0.6% for AGIs $50k-75k, 0.6% for AGIs $75k-100k, 0.5% for AGIs $100k-200k, 0.8% for AGIs over 200k)
Ordinary dividends: $2,567 (reported on 21.0% of returns)
Here:
$2,567
State:
$6,225
(% of AGI for various income ranges: 1.4% for AGIs below $25k, 1.1% for AGIs $25k-50k, 0.8% for AGIs $50k-75k, 0.6% for AGIs $75k-100k, 0.7% for AGIs $100k-200k, 3.6% for AGIs over 200k)
Net capital gain/loss in AGI: +$803 (reported on 15.6% of returns)
Here:
+$803
State:
+$9,326
(% of AGI for various income ranges: 0.3% for AGIs $100k-200k, 2.0% for AGIs over 200k)
Profit/loss from business: +$8,655 (reported on 12.6% of returns)
Here:
+$8,655
State:
+$11,523
(% of AGI for various income ranges: 7.5% for AGIs below $25k, 3.5% for AGIs $25k-50k, 1.3% for AGIs $50k-75k, 0.9% for AGIs $75k-100k, 1.2% for AGIs $100k-200k, 2.4% for AGIs over 200k)
Taxable individual retirement arrangement distribution: $12,598 (reported on 11.4% of returns)
48313:
$12,598
Michigan:
$15,298
(% of AGI for various income ranges: 3.5% for AGIs below $25k, 3.1% for AGIs $25k-50k, 2.8% for AGIs $50k-75k, 2.7% for AGIs $75k-100k, 2.6% for AGIs $100k-200k, 2.3% for AGIs over 200k)
Self-employment retirement plans: $10,150 (reported on 0.2% of returns)
48313:
$10,150
Michigan:
$20,834
Total itemized deductions: $18,163 (20% of AGI, reported on 33.1% of returns)
Here:
$18,163
State:
$21,628
Here:
19.9% of AGI
State:
18.4% of AGI
(% of AGI for various income ranges: 8.7% for AGIs below $25k, 9.1% for AGIs $25k-50k, 11.6% for AGIs $50k-75k, 12.0% for AGIs $75k-100k, 12.6% for AGIs $100k-200k, 14.1% for AGIs over 200k)
Charity contributions: $2,766 (reported on 28.5% of returns)
Here:
$2,766
State:
$4,225
(% of AGI for various income ranges: 0.6% for AGIs below $25k, 1.1% for AGIs $25k-50k, 1.4% for AGIs $50k-75k, 1.6% for AGIs $75k-100k, 1.9% for AGIs $100k-200k, 1.7% for AGIs over 200k)
Taxes paid: $6,578 (reported on 33.1% of returns)
48313:
$6,578
State:
$8,327
(% of AGI for various income ranges: 1.6% for AGIs below $25k, 2.4% for AGIs $25k-50k, 3.5% for AGIs $50k-75k, 4.3% for AGIs $75k-100k, 5.2% for AGIs $100k-200k, 7.3% for AGIs over 200k)
Earned income credit: $2,082 (reported on 13.0% of returns)
Here:
$2,082
State:
$2,306
(% of AGI for various income ranges: 4.8% for AGIs below $25k, 0.9% for AGIs $25k-50k)
Percentage of individuals using paid preparers for their 2012 taxes: 57.3%
Here:
57%
State:
57%
(% for various income ranges: 56.4% for AGIs below $25k, 58.9% for AGIs $25k-50k, 58.5% for AGIs $50k-75k, 56.8% for AGIs $75k-100k, 55.7% for AGIs $100k-200k, 63.2% for AGIs over 200k)
Averages for the 2004 tax year for zip code 48313, filed in 2005:
Average Adjusted Gross Income (AGI) in 2004: $50,049 (Individual Income Tax Returns)
Here:
$50,049
State:
$48,204
Salary/wage: $46,852 (reported on 88.1% of returns)
Here:
$46,852
State:
$42,791
(% of AGI for various income ranges: 113.3% for AGIs below $10k, 68.9% for AGIs $10k-25k, 78.1% for AGIs $25k-50k, 86.0% for AGIs $50k-75k, 89.9% for AGIs $75k-100k, 79.0% for AGIs over 100k)
Taxable interest for individuals: $1,184 (reported on 55.7% of returns)
This zip code:
$1,184
Michigan:
$1,725
(% of AGI for various income ranges: 6.6% for AGIs below $10k, 2.9% for AGIs $10k-25k, 1.7% for AGIs $25k-50k, 1.0% for AGIs $50k-75k, 0.6% for AGIs $75k-100k, 1.2% for AGIs over 100k)
Taxable dividends: $1,390 (reported on 27.2% of returns)
Here:
$1,390
State:
$3,420
(% of AGI for various income ranges: 3.2% for AGIs below $10k, 1.8% for AGIs $10k-25k, 1.0% for AGIs $25k-50k, 0.6% for AGIs $50k-75k, 0.5% for AGIs $75k-100k, 0.7% for AGIs over 100k)
Net capital gain/loss: +$1,003 (reported on 19.7% of returns)
Here:
+$1,003
State:
+$8,532
(% of AGI for various income ranges: -1.9% for AGIs below $10k, -0.0% for AGIs $10k-25k, 0.1% for AGIs $25k-50k, 0.2% for AGIs $50k-75k, 0.1% for AGIs $75k-100k, 1.0% for AGIs over 100k)
Profit/loss from business: +$8,086 (reported on 11.1% of returns)
Here:
+$8,086
State:
+$9,547
(% of AGI for various income ranges: 5.7% for AGIs below $10k, 4.9% for AGIs $10k-25k, 2.4% for AGIs $25k-50k, 1.5% for AGIs $50k-75k, 1.3% for AGIs $75k-100k, 1.3% for AGIs over 100k)
IRA payment deduction: $2,886 (reported on 2.3% of returns)
48313:
$2,886
Michigan:
$2,875
(% of AGI for various income ranges: 0.2% for AGIs below $10k, 0.2% for AGIs $10k-25k, 0.2% for AGIs $25k-50k, 0.2% for AGIs $50k-75k, 0.1% for AGIs $75k-100k, 0.1% for AGIs over 100k)
Self-employed pension: $9,452 (reported on 0.4% of returns)
Here:
$9,452
Michigan:
$13,826
(% of AGI for various income ranges: 0.1% for AGIs $10k-25k, 0.1% for AGIs $50k-75k, 0.1% for AGIs $75k-100k, 0.1% for AGIs over 100k)
Total itemized deductions: $16,447 (20% of AGI, reported on 44.6% of returns)
Here:
$16,447
State:
$18,509
Here:
20.2% of AGI
State:
20.7% of AGI
(% of AGI for various income ranges: 12.5% for AGIs below $10k, 14.0% for AGIs $10k-25k, 14.7% for AGIs $25k-50k, 16.5% for AGIs $50k-75k, 15.8% for AGIs $75k-100k, 13.0% for AGIs over 100k)
Charity contributions deductions: $2,357 (3% of AGI, reported on 41.3% of returns)
Here:
$2,357
State:
$3,365
Here:
2.8% of AGI
State:
3.6% of AGI
(% of AGI for various income ranges: 0.9% for AGIs below $10k, 1.0% for AGIs $10k-25k, 1.8% for AGIs $25k-50k, 2.0% for AGIs $50k-75k, 2.2% for AGIs $75k-100k, 2.0% for AGIs over 100k)
Total tax: $7,114 (reported on 80.4% of returns)
48313:
$7,114
State:
$7,691
(% of AGI for various income ranges: 3.1% for AGIs below $10k, 4.5% for AGIs $10k-25k, 7.5% for AGIs $25k-50k, 9.0% for AGIs $50k-75k, 10.2% for AGIs $75k-100k, 17.0% for AGIs over 100k)
Earned income credit: $1,549 (reported on 8.2% of returns)
Here:
$1,549
State:
$1,737
Percentage of individuals using paid preparers for their 2004 taxes: 55.3%
Here:
55%
State:
60%
(% for various income ranges: 48.7% for AGIs below $10k, 55.5% for AGIs $10k-25k, 56.4% for AGIs $25k-50k, 58.3% for AGIs $50k-75k, 57.0% for AGIs $75k-100k, 57.9% for AGIs over 100k)
Likely homosexual households (counted as self-reported same-sex unmarried-partner households)
Lesbian couples: 0.2% of all households
Gay men: 0.0% of all households
Household received Food Stamps/SNAP in the past 12 months: 1,530 Household did not receive Food Stamps/SNAP in the past 12 months: 12,289
Women who had a birth in the past 12 months: 372 (334 now married, 44 unmarried) Women who did not have a birth in the past 12 months: 7,506 (3,523 now married, 3,969 unmarried)
Housing units in zip code 48313 with a mortgage: 7,164 (634 second mortgage, 46 home equity loan, 495 both second mortgage and home equity loan) Houses without a mortgage: 382
Median monthly owner costs for units with a mortgage: $1,488 Median monthly owner costs for units without a mortgage: $589
Residents with income below the poverty level in 2022:
This zip code:
8.2%
Whole state:
13.4%
Residents with income below 50% of the poverty level in 2022:
This zip code:
4.8%
Whole state:
6.9%
Median number of rooms in houses and condos:
Here:
6.1
State:
6.5
Median number of rooms in apartments:
Here:
3.7
State:
4.3
Notable locations in this zip code not listed on our city pages
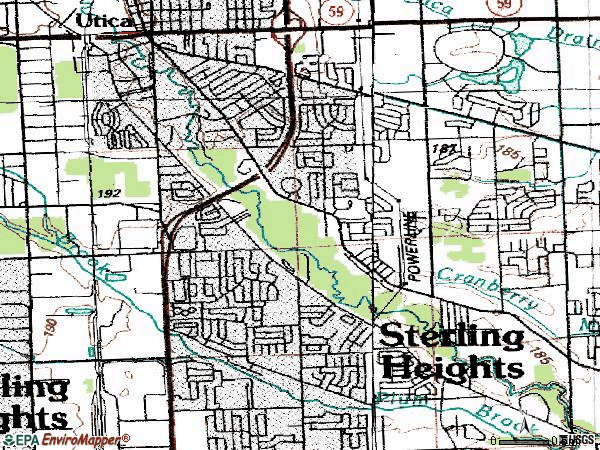
Notable locations in zip code 48313: Sunnybrook Country Club (A), Sterling Heights Library (B), Sterling Heights Police Department (C), Kirkwood Professional Building (D), Sterling Heights Fire Department Station 2 (E). Display/hide their locations on the map
Shopping Centers: Lakeview Square Shopping Center (1), Lakeshore Center Shopping Center (2), Clinton Valley Mall Shopping Center (3), Eastlake Commons Shopping Center (4), Sterling Center Shopping Center (5). Display/hide their locations on the map
Churches in zip code 48313 include: Saint Michael's Catholic Church (A), Lakeside Bible Church (B), Hope Community Baptist Church (C), Saint Matthias Catholic Church (D), Memorial Baptist Church (E), Christ Lutheran Church (F), Bethany Church of God (G), Riverwood Community Church (H), Church of Christ Metro (I). Display/hide their locations on the map
Parks in zip code 48313 include: Tiger Land Park (1), Dodge Brothers State Park Number 8 (2), Upton House Historical Marker (3), Fairview Park (4), College Park (5), Jaycees Park (6). Display/hide their locations on the map
In group quarters: 221 (-1 institutionalized population)
Size of family households: 4,538 2-persons, 2,042 3-persons, 1,899 4-persons, 811 5-persons, 203 6-persons, 83 7-or-more-persons
Size of nonfamily households: 3,721 1-person, 491 2-persons, 9 3-persons
4,887 married couples with children.
859 single-parent households (196 men, 663 women).
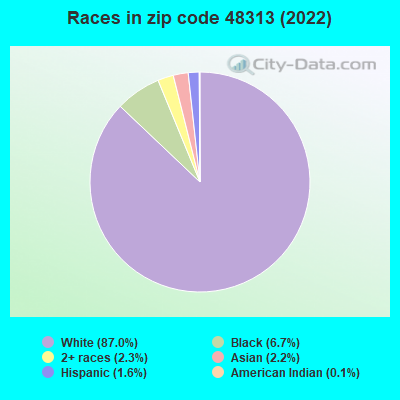
81.9% of residents of 48313 zip code speak English at home.
1.1% of residents speak Spanish at home (86% very well, 14% well).
6.9% of residents speak other Indo-European language at home (61% very well, 24% well, 10% not well, 5% not at all).
1.5% of residents speak Asian or Pacific Island language at home (79% very well, 15% well, 5% not well).
8.5% of residents speak other language at home (49% very well, 36% well, 9% not well, 6% not at all).
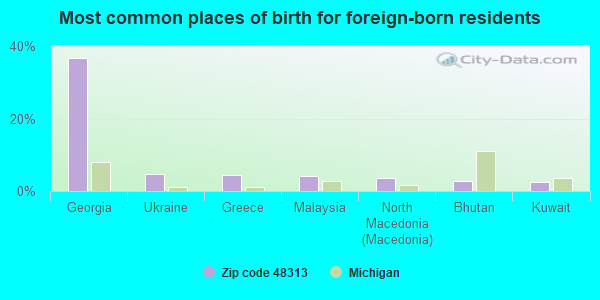
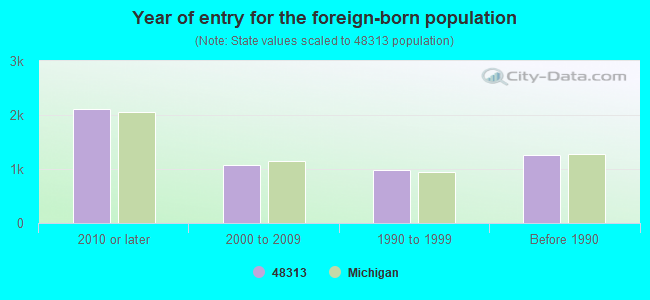
Foreign born population: 5,201 (15.3%) (72.6% of them are naturalized citizens)
Major facilities with environmental interests located in this zip code:
ADLAI STEVENSON HIGH SCHOOL (39701 DODGE PARK ROAD in STERLING HEIGHTS, MI)
(National Center for Education Statistics) - STATE ID-04931 (Resource Conservation and Recovery Act (tracking hazardous waste)) Organizations: UTICA COMMUNITY SCHOOLS (CONTACT/OWNER)
Alternative names: STEVENSON HS
BEMIS JUNIOR HIGH SCHOOL (12500 19 MILE ROAD in STERLING HEIGHTS, MI)
(National Center for Education Statistics) - STATE ID-04069 (Resource Conservation and Recovery Act (tracking hazardous waste)) Organizations: UTICA COMMUNITY SCHOOLS (CONTACT/OWNER)
Alternative names: BEMIS JR HS
GRAEBNER ELEMENTARY SCHOOL (41875 SAAL ROAD in STERLING HEIGHTS, MI)
(National Center for Education Statistics) - STATE ID-06263 Organizations: UTICA COMMUNITY SCHOOLS (SCHOOL DISTRICT)
AMOCO OIL CO 5414 IS VAN DYKE (34972 VAN DYKE in STERLING HEIGHTS, MI)
(Resource Conservation and Recovery Act (tracking hazardous waste)) Organizations: AMOCO OIL COMPANY (CONTACT/OWNER)
AMOCO OIL CO 5901 RICKS (39025 VANDYKE in STERLING HEIGHTS, MI)
(Resource Conservation and Recovery Act (tracking hazardous waste)) Organizations: AMOCO OIL COMPANY (CONTACT/OWNER)
DVM UTILITIES INC (6045 SIMS RD in STERLING HEIGHTS, MI)
(Resource Conservation and Recovery Act (tracking hazardous waste))
7-ELEVEN INC (39725 17 1/2 MILE RD in STERLING HEIGHTS, MI)
Small Quantity Generators, between 100 kg and 1000 kg of hazardous waste/month (Resource Conservation and Recovery Act (tracking hazardous waste)) Organizations: CONVENIENCE STATUTORY TRUST-2001 (CONTACT/OWNER)
AMOCO OIL CO (15150 HALL in STERLING HEIGHTS, MI)
(Resource Conservation and Recovery Act (tracking hazardous waste)) Alternative names: AMOCO OIL CO 15905
GAYLEE CORP & BITNER TOOLING TECH INC (6501 SIMS DR in STERLING HEIGHTS, MI)
Small Quantity Generators, between 100 kg and 1000 kg of hazardous waste/month (Resource Conservation and Recovery Act (tracking hazardous waste)) - notification Organizations: QUADRATE DEVELOPMENT LLC (PROP OWNER) (CONTACT/OWNER)
, NORTH AMERICAN TOOL CORP (CONTACT/OWNER)
BELLE TIRE DISRIBUTORS INC (39999 VAN DYKE in STERLING HEIGHTS, MI)
Small Quantity Generators, between 100 kg and 1000 kg of hazardous waste/month (Resource Conservation and Recovery Act (tracking hazardous waste)) - notification Organizations: BARNES DON (CONTACT/OPERATOR)
Alternative names: BELLE TIRE DIST INC
BORMANS INC (39070 VAN DYKE in STERLING HEIGHTS, MI)
Conditionally Exempt Small Quantity Generators, less than 100 kg/month of hazardous waste (Resource Conservation and Recovery Act (tracking hazardous waste))
FRITO LAY (6600 17 MILE in STERLING HEIGHTS, MI)
Conditionally Exempt Small Quantity Generators, less than 100 kg/month of hazardous waste (Resource Conservation and Recovery Act (tracking hazardous waste)) Organizations: FRITO LAT INC (CONTACT/OWNER)
Housing units lacking complete plumbing facilities: 0.3% Housing units lacking complete kitchen facilities: 1.4%
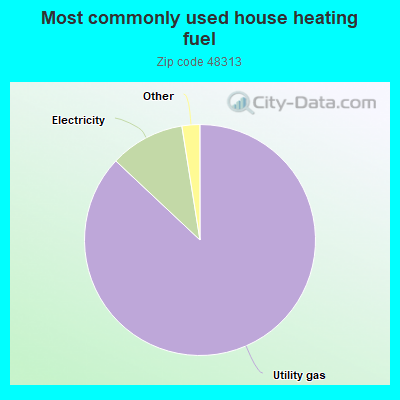
87.0%Utility gas
10.5%Electricity
1.0%No fuel used
0.8%Bottled, tank, or LP gas
0.7%Other fuel
Population in 1990: 33,890.
Place of birth for U.S.-born residents:
This state: 24,954
Northeast: 703
Midwest: 1,206
South: 1,219
West: 371
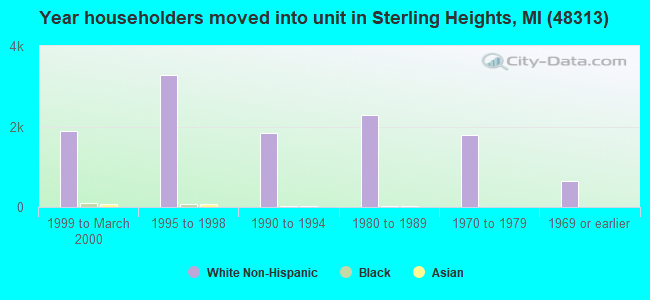
62% of the 48313 zip code residents lived in the same house 5 years ago. Out of people who lived in different houses, 65% lived in this county. Out of people who lived in different counties, 50% lived in Michigan.
91% of the 48313 zip code residents lived in the same house 1 year ago. Out of people who lived in different houses, 68% moved from this county. Out of people who lived in different houses, 22% moved from different county within same state. Out of people who lived in different houses, 7% moved from different state. Out of people who lived in different houses, 3% moved from abroad.
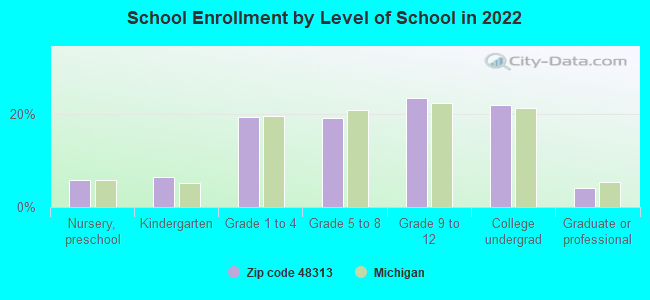
Private vs. public school enrollment:
Students in private schools in grades 1 to 8 (elementary and middle school): 383
Here:
14.6%
Michigan:
12.4%
Students in private schools in grades 9 to 12 (high school): 193
Here:
12.1%
Michigan:
9.8%
Students in private undergraduate colleges: 168
Here:
11.2%
Michigan:
14.9%
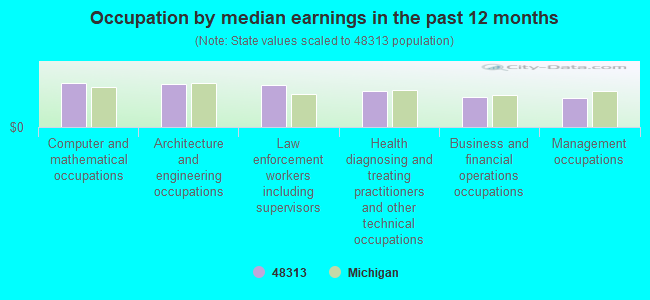
Occupation by median earnings in the past 12 months ($)
104,487Computer and mathematical occupations
102,606Architecture and engineering occupations
99,860Law enforcement workers including supervisors
85,851Health diagnosing and treating practitioners and other technical occupations
70,491Business and financial operations occupations
68,631Management occupations
Companies with federal contracts located in this zip code (STERLING HEIGH, MI):
A G DAVIS GAGE & ENGINEERING (6533 SIMS DR; small business) : $1,139,426 in 21 contractsfrom 2000 to 2006
Contracts for Miscellaneous Items, Inspection Gages and Precision Layout Tools, Miscellaneous Machine Tools, Centrifugals, Separators, and Pressure and Vacuum Filters, and moreby Army, Air Force, Navy Signed by year:2000: $75,150; 2001: $29,950; 2002: $0; 2003: $176,830; 2004: $247,060; 2005: $527,939; 2006: $82,497.
Biggest contracts:
$247,600 with Army for Miscellaneous Items. Signed on 2005-08-30. Completion date: 2005-12-20.
$186,970 with Air Force for Inspection Gages and Precision Layout Tools. Signed on 2004-12-29. Completion date: 2005-06-13.
$176,950, same as above.Signed on 2005-09-19. Completion date: 2006-08-29.
$75,150, same as above.Signed on 2000-08-31. Completion date: 2001-01-31.
GENERAL DYNAMICS LAND SYSTEMS (6000 17 MILE RD)
$717,444 with Army for Miscellaneous Vehicular Components. Signed on 2001-06-21. Completion date: 1998-09-30.
CSM CORPORATION (14800 LAKESIDE CIRCLE; small business) : $121,981 in 4 contractsin 2003
$53,190 with Army for Lodging - Hotel/Motel. Signed on 2003-02-12. Completion date: 2003-03-13.
$32,661, same as above.Signed on 2003-03-19. Completion date: 2003-03-31.
$27,450 with Army for Lease or Rental of Facilities -- Conference Space and Facilities. Signed on 2003-06-09. Completion date: 2003-07-09.
$8,680 with Army for Lodging - Hotel/Motel. Signed on 2003-05-21. Completion date: 2003-06-04.
MC CLAIN INDUSTRIES INC (6200 ELMRIDGE DR; small business)
$29,061 with Navy for Specialized Shipping and Storage Containers. Taking place in CA. Signed on 2002-03-22. Completion date: 2002-05-03.
Top industries in this zip code by the number of employees in 2005:
Administrative and Support and Waste Management and Remediation Services: Professional Employer Organizations (100-249 employees: 7 establishments, 20-49 employees: 1 establishment, 10-19 employees: 1 establishment)
2002 - 2018 National Fire Incident Reporting System (NFIRS) incidents
According to the data from the years 2002 - 2018 the average number of fires per year is 73. The highest number of fires - 97 took place in 2007, and the least - 47 in 2018. The data has a declining trend.
When looking into fire subcategories, the most reports belonged to: Structure Fires (49.0%), and Outside Fires (30.1%).
Fire incident types reported to NFIRS in Zip Code 48313


 Nearest zip codes: 48312, 48314, 48038, 48317, 48315, 48310.


 According to the data from the years 2002 - 2018 the average number of fires per year is 73. The highest number of fires - 97 took place in 2007, and the least - 47 in 2018. The data has a declining trend.
 When looking into fire subcategories, the most reports belonged to: Structure Fires (49.0%), and Outside Fires (30.1%).