Estimated zip code population in 2022: 5,981 Zip code population in 2010: 6,491 Zip code population in 2000: 6,209
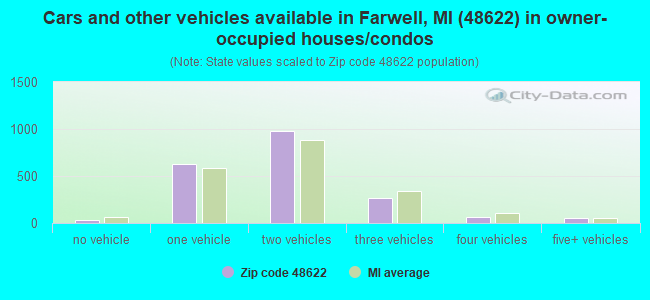
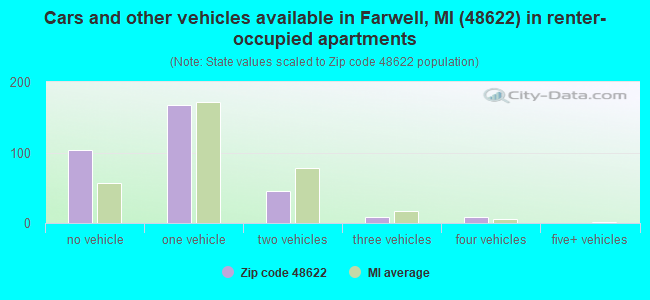
Houses and condos: 3,233 Renter-occupied apartments: 331
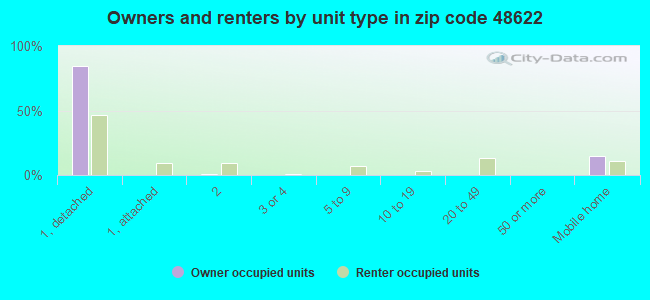
% of renters here:
14%
State:
27%
March 2022 cost of living index in zip code 48622: 80.7 (low, U.S. average is 100)
Land area: 95.1 sq. mi. Water area: 1.2 sq. mi.
Population density: 63 people per square mile
(very low).
OSM Map
General Map
Google Map
MSN Map
OSM Map
General Map
Google Map
MSN Map
OSM Map
General Map
Google Map
MSN Map
OSM Map
General Map
Google Map
MSN Map
Please wait while loading the map...
Real estate property taxes paid for housing units in 2022:
This zip code:
1.1% ($1,459)
Michigan:
1.2% ($2,746)
Median real estate property taxes paid for housing units with mortgages in 2022: $1,490 (1.0%) Median real estate property taxes paid for housing units with no mortgage in 2022: $1,430 (1.1%)
Business Search- 14 Million verified businesses
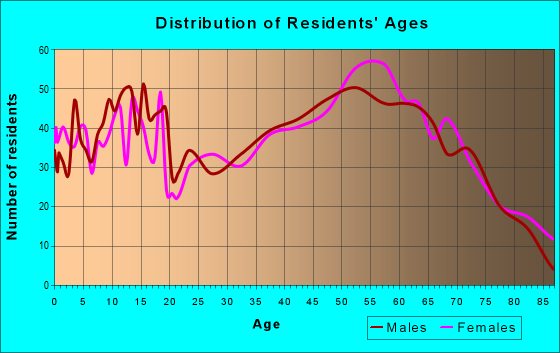
Males: 2,908
(48.6%)
Females: 3,073
(51.4%)
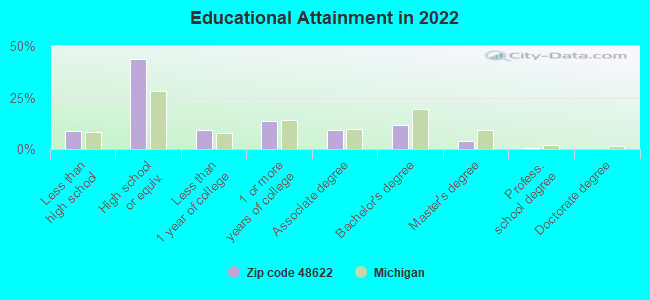
For population 25 years and over in 48622:
High school or higher: 90.7%
Bachelor's degree or higher: 15.9%
Graduate or professional degree: 4.3%
Unemployed: 5.6%
Mean travel time to work (commute): 22.6 minutes
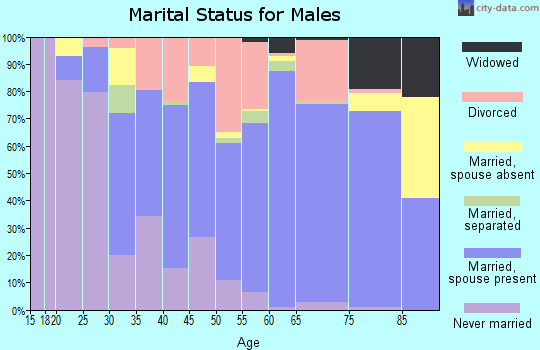
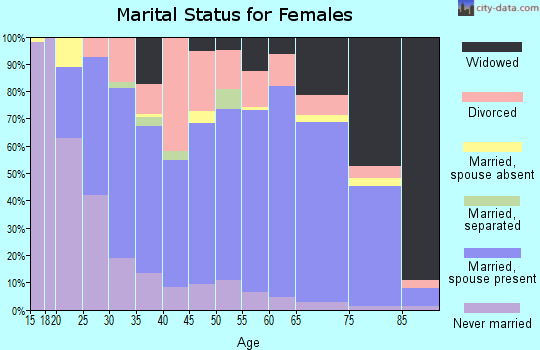
For population 15 years and over in 48622:
Never married: 28.2%
Now married: 52.5%
Separated: 1.7%
Widowed: 8.4%
Divorced: 9.2%
Zip code 48622 compared to state average:
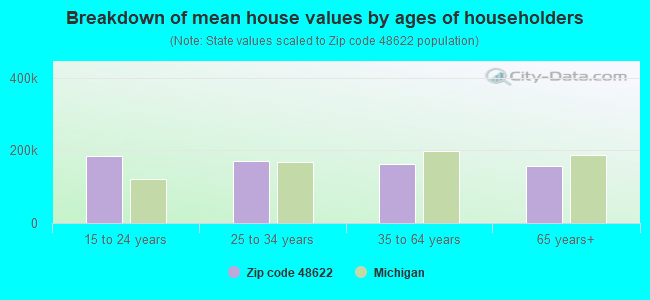
Median house value below state average.
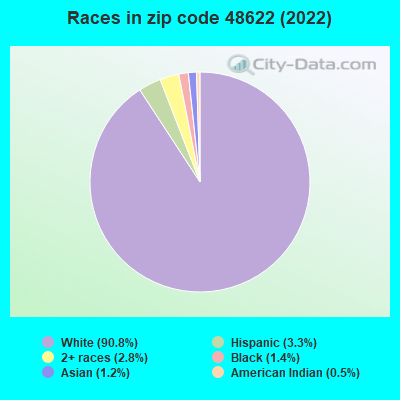
Black race population percentage significantly below state average.
Median age above state average.
Foreign-born population percentage significantly below state average.
Renting percentage below state average.
Length of stay since moving in significantly above state average.
House age below state average.
Number of college students below state average.
Percentage of population with a bachelor's degree or higher below state average.
Averages for the 2020 tax year for zip code 48622, filed in 2021:
Average Adjusted Gross Income (AGI) in 2020: $50,939 (Individual Income Tax Returns)
Here:
$50,939
State:
$68,945
Salary/wage: $41,153 (reported on 76.3% of returns)
Here:
$41,153
State:
$57,142
(% of AGI for various income ranges: 946.9% for AGIs below $25k, 2837.8% for AGIs $25k-50k, 5635.9% for AGIs $50k-75k, 8289.5% for AGIs $75k-100k, 14426.3% for AGIs $100k-200k)
Taxable interest for individuals: $1,188 (reported on 26.3% of returns)
This zip code:
$1,188
Michigan:
$1,630
(% of AGI for various income ranges: 10.2% for AGIs below $25k, 19.7% for AGIs $25k-50k, 47.5% for AGIs $50k-75k, 16.3% for AGIs $75k-100k, 110.5% for AGIs $100k-200k)
Ordinary dividends: $4,113 (reported on 12.8% of returns)
Here:
$4,113
State:
$6,972
(% of AGI for various income ranges: 16.4% for AGIs below $25k, 34.6% for AGIs $25k-50k, 60.3% for AGIs $50k-75k, 54.2% for AGIs $75k-100k, 241.6% for AGIs $100k-200k)
Net capital gain/loss in AGI: +$7,061 (reported on 10.9% of returns)
Here:
+$7,061
State:
+$20,064
(% of AGI for various income ranges: 4.4% for AGIs below $25k, 23.1% for AGIs $25k-50k, 59.7% for AGIs $50k-75k, 75.3% for AGIs $75k-100k, 407.4% for AGIs $100k-200k)
Profit/loss from business: +$12,215 (reported on 12.8% of returns)
Here:
+$12,215
State:
+$11,172
(% of AGI for various income ranges: 82.7% for AGIs below $25k, 126.2% for AGIs $25k-50k, 270.0% for AGIs $50k-75k, 506.3% for AGIs $75k-100k, 748.9% for AGIs $100k-200k)
Taxable individual retirement arrangement distribution: $15,032 (reported on 10.2% of returns)
48622:
$15,032
Michigan:
$19,803
(% of AGI for various income ranges: 70.0% for AGIs below $25k, 98.2% for AGIs $25k-50k, 227.5% for AGIs $50k-75k, 366.3% for AGIs $75k-100k, 1057.9% for AGIs $100k-200k)
Total itemized deductions: $39,467 (reported on 2.0% of returns)
Here:
$39,467
State:
$34,117
(% of AGI for various income ranges: 333.8% for AGIs $50k-75k, 684.2% for AGIs $100k-200k)
Charity contributions: $6,880 (reported on 1.6% of returns)
Here:
$6,880
State:
$13,548
(% of AGI for various income ranges: 16.6% for AGIs $25k-50k, 124.2% for AGIs $100k-200k)
Taxes paid: $8,567 (reported on 2.0% of returns)
48622:
$8,567
State:
$7,972
(% of AGI for various income ranges: 52.5% for AGIs $50k-75k, 182.1% for AGIs $100k-200k)
Earned income credit: $2,102 (reported on 17.1% of returns)
Here:
$2,102
State:
$2,251
(% of AGI for various income ranges: 84.0% for AGIs below $25k, 59.5% for AGIs $25k-50k)
Percentage of individuals using paid preparers for their 2020 taxes: 95.4%
Here:
95%
State:
93%
(% for various income ranges: 94.0% for AGIs below $25k, 96.4% for AGIs $25k-50k, 95.5% for AGIs $50k-75k, 96.3% for AGIs $75k-100k, 96.6% for AGIs $100k-200k, 100.0% for AGIs over 200k)
Averages for the 2012 tax year for zip code 48622, filed in 2013:
Average Adjusted Gross Income (AGI) in 2012: $41,707 (Individual Income Tax Returns)
Here:
$41,707
State:
$55,609
Salary/wage: $35,949 (reported on 78.9% of returns)
Here:
$35,949
State:
$46,782
(% of AGI for various income ranges: 62.9% for AGIs below $25k, 70.2% for AGIs $25k-50k, 71.8% for AGIs $50k-75k, 72.4% for AGIs $75k-100k, 69.0% for AGIs $100k-200k, 51.5% for AGIs over 200k)
Taxable interest for individuals: $1,114 (reported on 29.5% of returns)
This zip code:
$1,114
Michigan:
$1,491
(% of AGI for various income ranges: 1.6% for AGIs below $25k, 0.8% for AGIs $25k-50k, 0.5% for AGIs $50k-75k, 0.7% for AGIs $75k-100k, 0.6% for AGIs $100k-200k, 0.8% for AGIs over 200k)
Ordinary dividends: $2,811 (reported on 13.5% of returns)
Here:
$2,811
State:
$6,225
(% of AGI for various income ranges: 1.0% for AGIs below $25k, 0.8% for AGIs $25k-50k, 0.6% for AGIs $50k-75k, 0.6% for AGIs $75k-100k, 2.2% for AGIs $100k-200k)
Net capital gain/loss in AGI: +$2,680 (reported on 9.1% of returns)
Here:
+$2,680
State:
+$9,326
(% of AGI for various income ranges: 0.7% for AGIs $50k-75k, 0.6% for AGIs $75k-100k, 2.1% for AGIs $100k-200k)
Profit/loss from business: +$8,580 (reported on 14.5% of returns)
Here:
+$8,580
State:
+$11,523
(% of AGI for various income ranges: 6.0% for AGIs below $25k, 3.0% for AGIs $25k-50k, 1.6% for AGIs $50k-75k, 1.8% for AGIs $75k-100k, 5.8% for AGIs $100k-200k)
Taxable individual retirement arrangement distribution: $11,300 (reported on 10.5% of returns)
48622:
$11,300
Michigan:
$15,298
(% of AGI for various income ranges: 3.5% for AGIs below $25k, 2.9% for AGIs $25k-50k, 2.0% for AGIs $50k-75k, 3.2% for AGIs $75k-100k, 4.8% for AGIs $100k-200k)
Total itemized deductions: $19,396 (24% of AGI, reported on 18.2% of returns)
Here:
$19,396
State:
$21,628
Here:
23.6% of AGI
State:
18.4% of AGI
(% of AGI for various income ranges: 6.5% for AGIs below $25k, 6.3% for AGIs $25k-50k, 7.0% for AGIs $50k-75k, 9.4% for AGIs $75k-100k, 12.4% for AGIs $100k-200k, 11.2% for AGIs over 200k)
Charity contributions: $2,811 (reported on 12.7% of returns)
Here:
$2,811
State:
$4,225
(% of AGI for various income ranges: 0.4% for AGIs below $25k, 0.6% for AGIs $25k-50k, 0.7% for AGIs $50k-75k, 0.8% for AGIs $75k-100k, 1.6% for AGIs $100k-200k, 1.1% for AGIs over 200k)
Taxes paid: $5,965 (reported on 17.8% of returns)
48622:
$5,965
State:
$8,327
(% of AGI for various income ranges: 0.8% for AGIs below $25k, 1.6% for AGIs $25k-50k, 1.9% for AGIs $50k-75k, 2.7% for AGIs $75k-100k, 4.6% for AGIs $100k-200k, 4.7% for AGIs over 200k)
Earned income credit: $2,272 (reported on 20.7% of returns)
Here:
$2,272
State:
$2,306
(% of AGI for various income ranges: 6.9% for AGIs below $25k, 1.2% for AGIs $25k-50k)
Percentage of individuals using paid preparers for their 2012 taxes: 65.5%
Here:
65%
State:
57%
(% for various income ranges: 60.7% for AGIs below $25k, 66.2% for AGIs $25k-50k, 70.7% for AGIs $50k-75k, 69.6% for AGIs $75k-100k, 73.3% for AGIs $100k-200k, 100.0% for AGIs over 200k)
Averages for the 2004 tax year for zip code 48622, filed in 2005:
Average Adjusted Gross Income (AGI) in 2004: $36,080 (Individual Income Tax Returns)
Here:
$36,080
State:
$48,204
Salary/wage: $29,787 (reported on 81.8% of returns)
Here:
$29,787
State:
$42,791
(% of AGI for various income ranges: 77.9% for AGIs below $10k, 63.9% for AGIs $10k-25k, 76.1% for AGIs $25k-50k, 75.0% for AGIs $50k-75k, 76.8% for AGIs $75k-100k, 41.2% for AGIs over 100k)
Taxable interest for individuals: $1,636 (reported on 42.2% of returns)
This zip code:
$1,636
Michigan:
$1,725
(% of AGI for various income ranges: 5.7% for AGIs below $10k, 2.6% for AGIs $10k-25k, 1.3% for AGIs $25k-50k, 1.1% for AGIs $50k-75k, 1.1% for AGIs $75k-100k, 3.3% for AGIs over 100k)
Taxable dividends: $3,251 (reported on 16.6% of returns)
Here:
$3,251
State:
$3,420
(% of AGI for various income ranges: 1.8% for AGIs below $10k, 1.0% for AGIs $10k-25k, 0.8% for AGIs $25k-50k, 0.8% for AGIs $50k-75k, 1.0% for AGIs $75k-100k, 3.9% for AGIs over 100k)
Net capital gain/loss: +$3,793 (reported on 12.0% of returns)
Here:
+$3,793
State:
+$8,532
(% of AGI for various income ranges: -1.3% for AGIs below $10k, 0.8% for AGIs $10k-25k, 0.6% for AGIs $25k-50k, 0.7% for AGIs $50k-75k, 4.3% for AGIs $75k-100k, 1.4% for AGIs over 100k)
Profit/loss from business: +$6,774 (reported on 15.5% of returns)
Here:
+$6,774
State:
+$9,547
(% of AGI for various income ranges: 4.7% for AGIs below $10k, 5.1% for AGIs $10k-25k, 2.2% for AGIs $25k-50k, 1.4% for AGIs $50k-75k, 3.3% for AGIs $75k-100k, 3.8% for AGIs over 100k)
IRA payment deduction: $3,209 (reported on 1.6% of returns)
48622:
$3,209
Michigan:
$2,875
Total itemized deductions: $14,719 (21% of AGI, reported on 22.1% of returns)
Here:
$14,719
State:
$18,509
Here:
21.4% of AGI
State:
20.7% of AGI
(% of AGI for various income ranges: 6.4% for AGIs below $10k, 6.6% for AGIs $10k-25k, 9.3% for AGIs $25k-50k, 10.7% for AGIs $50k-75k, 10.2% for AGIs $75k-100k, 7.9% for AGIs over 100k)
Charity contributions deductions: $2,375 (3% of AGI, reported on 16.5% of returns)
Here:
$2,375
State:
$3,365
Here:
3.0% of AGI
State:
3.6% of AGI
(% of AGI for various income ranges: 0.6% for AGIs $10k-25k, 0.8% for AGIs $25k-50k, 1.1% for AGIs $50k-75k, 1.3% for AGIs $75k-100k, 1.7% for AGIs over 100k)
Total tax: $4,735 (reported on 71.2% of returns)
48622:
$4,735
State:
$7,691
(% of AGI for various income ranges: 2.3% for AGIs below $10k, 3.8% for AGIs $10k-25k, 5.8% for AGIs $25k-50k, 8.2% for AGIs $50k-75k, 10.5% for AGIs $75k-100k, 19.2% for AGIs over 100k)
Earned income credit: $1,717 (reported on 17.3% of returns)
Here:
$1,717
State:
$1,737
Percentage of individuals using paid preparers for their 2004 taxes: 65.9%
Here:
66%
State:
60%
(% for various income ranges: 56.1% for AGIs below $10k, 64.4% for AGIs $10k-25k, 70.7% for AGIs $25k-50k, 67.6% for AGIs $50k-75k, 70.7% for AGIs $75k-100k, 89.0% for AGIs over 100k)
Likely homosexual households (counted as self-reported same-sex unmarried-partner households)
Lesbian couples: 0.3% of all households
Gay men: 0.0% of all households
Household received Food Stamps/SNAP in the past 12 months: 336 Household did not receive Food Stamps/SNAP in the past 12 months: 2,010
Women who had a birth in the past 12 months: 57 (42 now married, 15 unmarried) Women who did not have a birth in the past 12 months: 1,059 (479 now married, 578 unmarried)
Housing units in zip code 48622 with a mortgage: 1,071 (68 second mortgage, 67 both second mortgage and home equity loan) Houses without a mortgage: 116
Median monthly owner costs for units with a mortgage: $1,004 Median monthly owner costs for units without a mortgage: $442
Residents with income below the poverty level in 2022:
This zip code:
20.9%
Whole state:
13.4%
Residents with income below 50% of the poverty level in 2022:
This zip code:
11.5%
Whole state:
6.9%
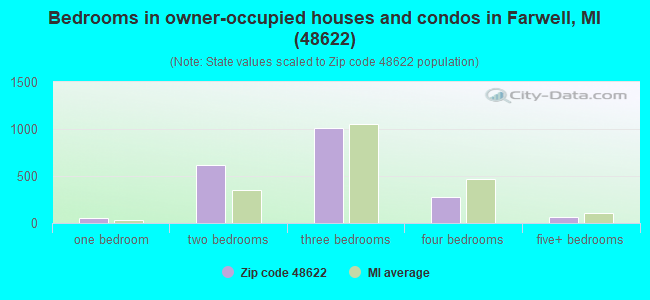
Median number of rooms in houses and condos:
Here:
6.0
State:
6.5
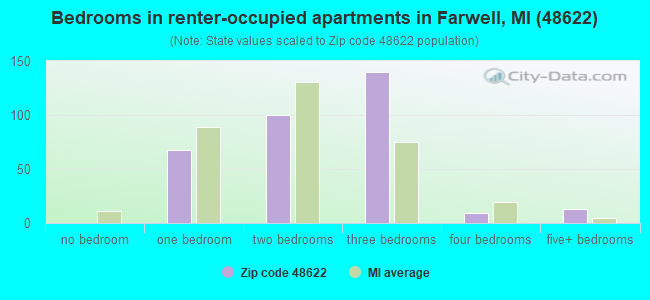
Median number of rooms in apartments:
Here:
4.9
State:
4.3
Notable locations in this zip code not listed on our city pages
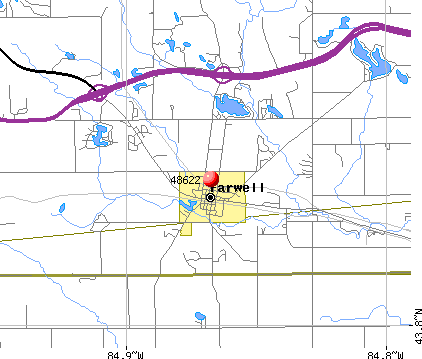
Notable locations in zip code 48622: Eagle Glen Golf Course (A), Farwell Station (B), Surrey Township Public Library (C), Farwell Historical Museum (D), Surrey Township Fire Department (E). Display/hide their locations on the map
Churches in zip code 48622 include: Trinity Baptist Church (A), Living Hope Lutheran Church (B), Farwell United Methodist Church (C), Farwell Community Church (D), Community of Christ Church (E), Farwell Church of Christ (F), Gilmore Church (G), Maple Grove Church (H). Display/hide their locations on the map
Lakes and swamps: Mabel Lake (A), Lost Lake (B), Loon Lake (C), Wahl Lake (D), Little Loon Lake (E), Lake Pauline (F), We-E Lake (G), Otter Lake (H). Display/hide their locations on the map
Creeks: Elm Creek (A), Overton Creek (B), White Sand Creek (C), Schofield Creek (D), Loon Lake Creek (E), Harden Creek (F), Runyon Creek (G), Newton Creek (H). Display/hide their locations on the map
663 married couples with children.
333 single-parent households (14 men, 319 women).
97.1% of residents of 48622 zip code speak English at home.
0.9% of residents speak Spanish at home (100% very well).
1.8% of residents speak other Indo-European language at home (78% very well, 22% well).
0.3% of residents speak Asian or Pacific Island language at home (32% very well, 68% well).
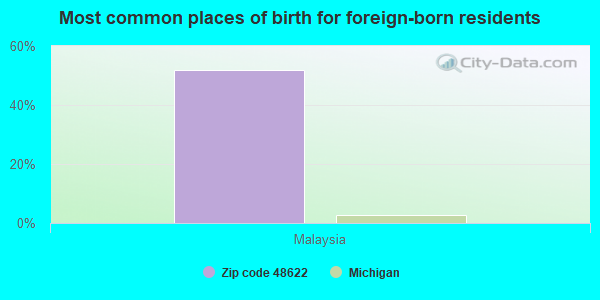
Foreign born population: 26 (0.5%) (53.1% of them are naturalized citizens)
This zip code:
0.5%
Whole state:
6.9%
52%Malaysia
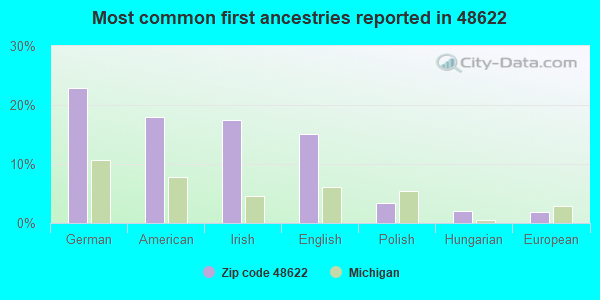
23%German
18%American
17%Irish
15%English
3%Polish
2%Hungarian
2%European
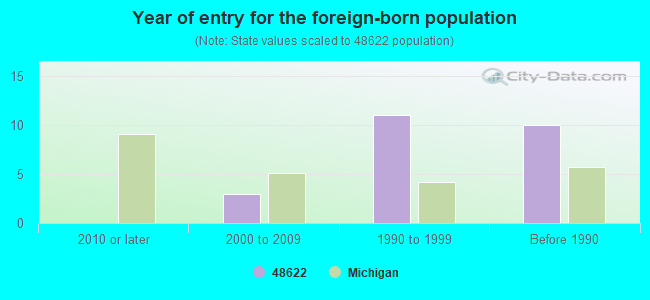
Year of entry for the foreign-born population
02010 or later
32000 to 2009
111990 to 1999
10Before 1990
Facilities with environmental interests located in this zip code:
FARWELL PLANT RENOSOL CORPORATION (505 HOOVER ST. in FARWELL, MI)
AIR MINOR (AIRS/AFS) CRITERIA AND HAZARDOUS AIR POLLUTANT INVENTORY (Inventory of air pollution sources) HAZARDOUS WASTE BIENNIAL REPORTER (Resource Conservation and Recovery Act (tracking hazardous waste)) (Resource Conservation and Recovery Act (tracking hazardous waste)) TRI REPORTER (Tracking of toxic chemicals releasing facilities) Business SIC classification: PLASTICS FOAM PRODUCTS; MOTOR VEHICLE PARTS AND ACCESSORIES Business NAICS classification: ALL OTHER MOTOR VEHICLE PARTS MANUFACTURING. Alternative names: RENOSOL CORP. FARWELL PLANT
FARWELL ELEMENTARY SCHOOL (268 E. OHIO STREET in FARWELL, MI)
(National Center for Education Statistics) - STATE ID-01209 Organizations: FARWELL AREA SCHOOLS (SCHOOL DISTRICT)
FARWELL HIGH SCHOOL (399 E. MICHIGAN AVENUE in FARWELL, MI)
(National Center for Education Statistics) - STATE ID-01210 Organizations: FARWELL AREA SCHOOLS (SCHOOL DISTRICT)
FARWELL MIDDLE SCHOOL (500 E. OHIO STREET in FARWELL, MI)
(National Center for Education Statistics) - STATE ID-06258 Organizations: FARWELL AREA SCHOOLS (SCHOOL DISTRICT)
MI DEPT/TRANSPORTATION BRIDGE R01 & R02- (US-10 EB & WB OVER MDOT RR in FARWELL, MI)
(Resource Conservation and Recovery Act (tracking hazardous waste)) Organizations: MICH DEPT OF TRANSPORTATION (CONTACT/OWNER)
Alternative names: MIDOT BRIDGE US-10 E&W OVER MDOT RR
FUTURE MOLD CORP (215 WEBBER ST in FARWELL, MI)
(Resource Conservation and Recovery Act (tracking hazardous waste)) Business NAICS classification: INDUSTRIAL MOLD MANUFACTURING. Organizations: OTTO MELVIN (CONTACT/OPERATOR)
ERIC WALKIEWCZ (HERRICK RD 1/4 MILE W OF WINN in FARWELL, MI)
(Resource Conservation and Recovery Act (tracking hazardous waste))
ALL CAR COLLISION (176 E LUDINGTON DR in FARWELL, MI)
Conditionally Exempt Small Quantity Generators, less than 100 kg/month of hazardous waste (Resource Conservation and Recovery Act (tracking hazardous waste)) - notification Organizations: FURLOTT LEVI WILFRED (CONTACT/OWNER)
FARWELL TRADING POST (720 W MAIN ST in FARWELL, MI)
Small Quantity Generators, between 100 kg and 1000 kg of hazardous waste/month (Resource Conservation and Recovery Act (tracking hazardous waste))
FARWELL AREA SCHOOLS (294 E OHIO ST in FARWELL, MI)
COMPLIANCE ACTIVITY (Tracking inspections of insecticide, fungicide, and rodenticide, and toxic substances)
GILMORE TOWNSHIP SANITARY LANDFILL (COLEMAN RD in FARWELL, MI)
CRITERIA AND HAZARDOUS AIR POLLUTANT INVENTORY (Inventory of air pollution sources) Business SIC classification: REFUSE SYSTEMS Business NAICS classification: SOLID WASTE LANDFILL.
Housing units lacking complete plumbing facilities: 0.2%
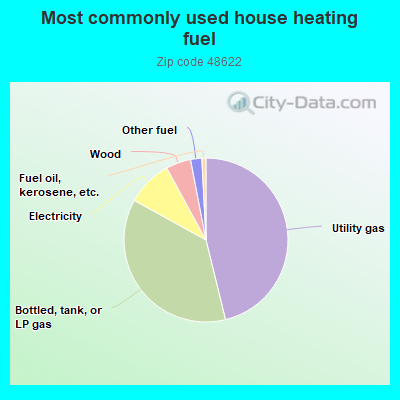
46.0%Utility gas
36.7%Bottled, tank, or LP gas
9.0%Electricity
4.9%Wood
2.2%Other fuel
0.8%Fuel oil, kerosene, etc.
Population in 1990: 4,456. Population change in the 1990s: +1,753 (+39.3%).
Place of birth for U.S.-born residents:
This state: 5,078
Northeast: 116
Midwest: 289
South: 303
West: 164
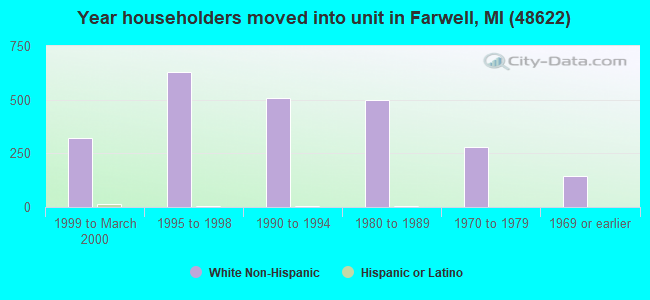
65% of the 48622 zip code residents lived in the same house 5 years ago. Out of people who lived in different houses, 41% lived in this county. Out of people who lived in different counties, 50% lived in Michigan.
91% of the 48622 zip code residents lived in the same house 1 year ago. Out of people who lived in different houses, 31% moved from this county. Out of people who lived in different houses, 58% moved from different county within same state. Out of people who lived in different houses, 10% moved from different state. Out of people who lived in different houses, 1% moved from abroad.
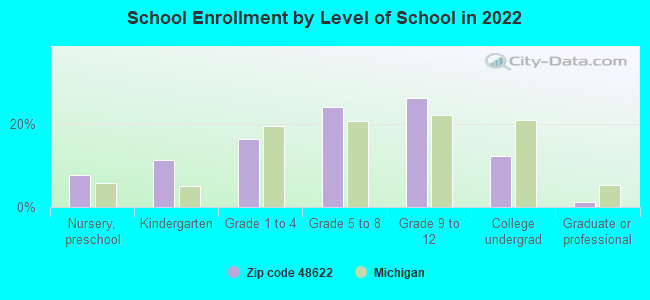
Private vs. public school enrollment:
Students in private schools in grades 1 to 8 (elementary and middle school): 19
Here:
4.1%
Michigan:
12.4%
Students in private schools in grades 9 to 12 (high school): 57
Here:
19.1%
Michigan:
9.8%
Students in private undergraduate colleges: 10
Here:
7.1%
Michigan:
14.9%
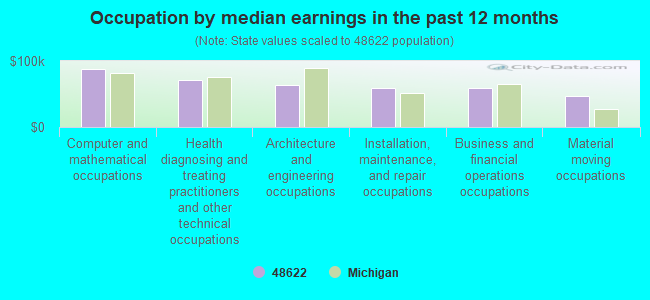
Occupation by median earnings in the past 12 months ($)
88,242Computer and mathematical occupations
71,914Health diagnosing and treating practitioners and other technical occupations
64,019Architecture and engineering occupations
59,761Installation, maintenance, and repair occupations
59,686Business and financial operations occupations
47,653Material moving occupations
Top industries in this zip code by the number of employees in 2005:
Health Care and Social Assistance: Nursing Care Facilities (50-99: 1)
Health Care and Social Assistance: Residential Mental Retardation Facilities (20-49: 1, 10-19: 2, 1-4: 1)
Finance and Insurance: Commercial Banking (20-49: 1, 1-4: 1)
People in group quarters in 2010:
68 people in nursing facilities/skilled-nursing facilities
51 people in group homes intended for adults
People in group quarters in 2000:
76 people in nursing homes
23 people in homes for the mentally retarded
21 people in other group homes
10 people in homes for the mentally ill
2 people in homes for the physically handicapped
Fatal accident statistics in 2013:
Fatal accident count: 2
Vehicles involved in fatal accidents: 4
Fatal accidents caused by drunken drivers: 0
Fatalities: 3
Persons involved in fatal accidents: 6
Pedestrians involved in fatal accidents: 0
Fatal accident statistics in 2012:
Fatal accident count: 2
Vehicles involved in fatal accidents: 2
Fatal accidents caused by drunken drivers: 2
Fatalities: 2
Persons involved in fatal accidents: 2
Pedestrians involved in fatal accidents: 0
2002 - 2018 National Fire Incident Reporting System (NFIRS) incidents
Based on the data from the years 2002 - 2018 the average number of fires per year is 18. The highest number of fires - 41 took place in 2003, and the least - 8 in 2010. The data has a growing trend.
When looking into fire subcategories, the most reports belonged to: Structure Fires (54.4%), and Outside Fires (21.7%).
Fire incident types reported to NFIRS in Zip Code 48622
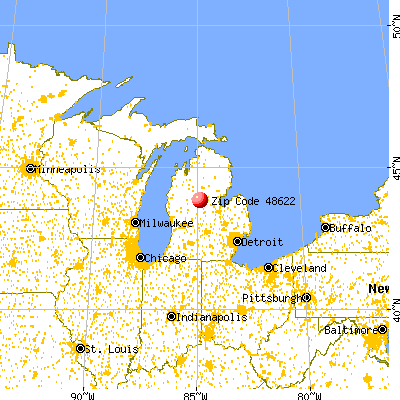


 Nearest zip codes: 48633, 48632, 48617, 48878, 48893, 48625.
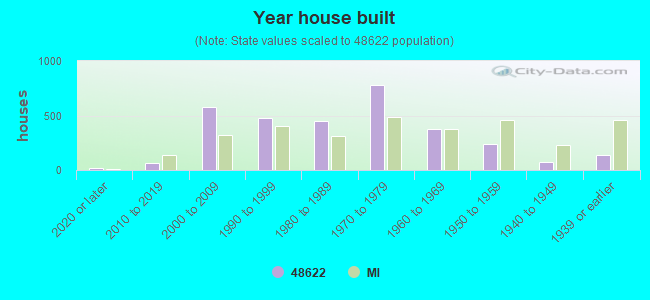


 Based on the data from the years 2002 - 2018 the average number of fires per year is 18. The highest number of fires - 41 took place in 2003, and the least - 8 in 2010. The data has a growing trend.
 When looking into fire subcategories, the most reports belonged to: Structure Fires (54.4%), and Outside Fires (21.7%).