Estimated zip code population in 2022: 5,775 Zip code population in 2010: 5,717 Zip code population in 2000: 6,150
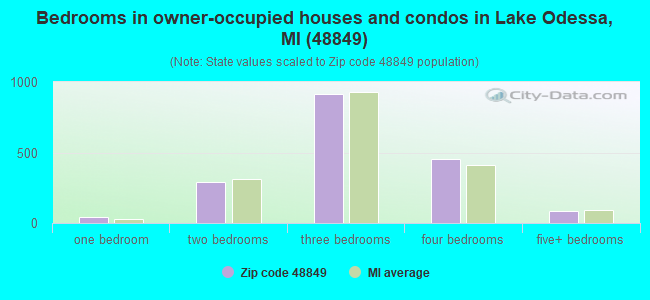
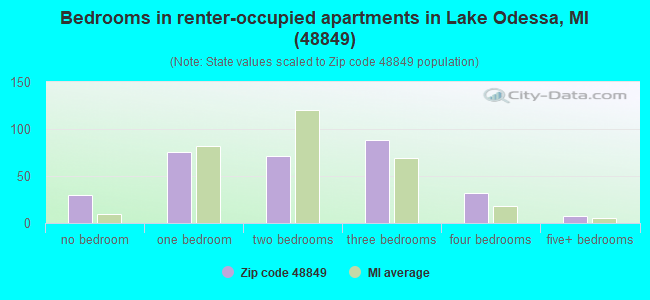
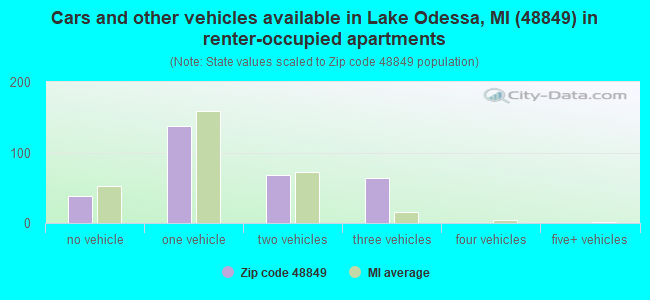
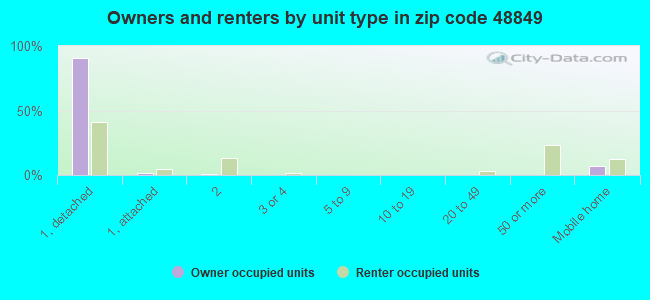
Houses and condos: 2,360 Renter-occupied apartments: 307
% of renters here:
15%
State:
27%
March 2022 cost of living index in zip code 48849: 80.8 (low, U.S. average is 100)
Land area: 82.9 sq. mi. Water area: 1.1 sq. mi.
Population density: 70 people per square mile
(very low).
OSM Map
General Map
Google Map
MSN Map
OSM Map
General Map
Google Map
MSN Map
OSM Map
General Map
Google Map
MSN Map
OSM Map
General Map
Google Map
MSN Map
Please wait while loading the map...
Real estate property taxes paid for housing units in 2022:
This zip code:
1.1% ($2,377)
Michigan:
1.2% ($2,746)
Median real estate property taxes paid for housing units with mortgages in 2022: $2,377 (1.1%) Median real estate property taxes paid for housing units with no mortgage in 2022: $2,401 (1.1%)
Business Search- 14 Million verified businesses
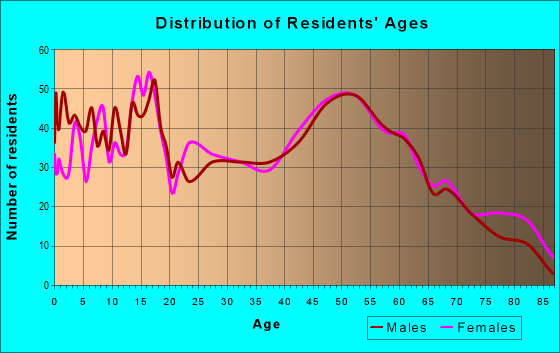
Males: 3,076
(53.3%)
Females: 2,698
(46.7%)
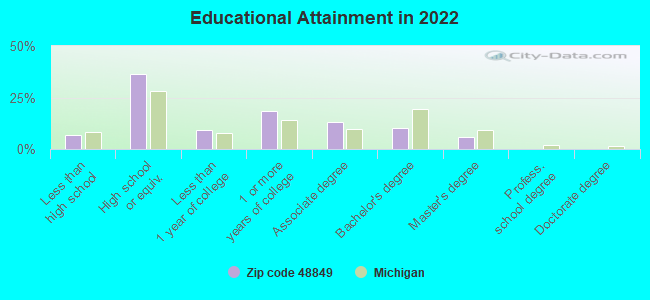
For population 25 years and over in 48849:
High school or higher: 92.4%
Bachelor's degree or higher: 16.2%
Graduate or professional degree: 5.9%
Unemployed: 3.6%
Mean travel time to work (commute): 28.7 minutes
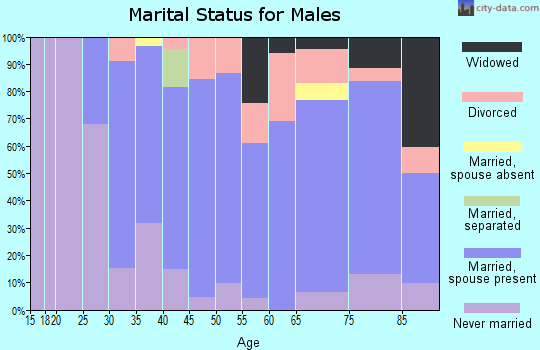
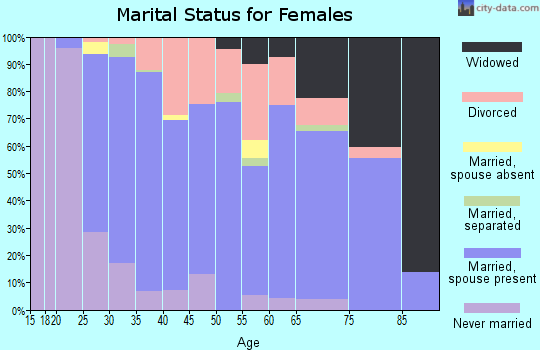
For population 15 years and over in 48849:
Never married: 29.0%
Now married: 54.0%
Separated: 0.2%
Widowed: 6.5%
Divorced: 10.3%
Zip code 48849 compared to state average:
Black race population percentage significantly below state average.
Hispanic race population percentage below state average.
Foreign-born population percentage significantly below state average.
Renting percentage below state average.
Length of stay since moving in significantly above state average.
Percentage of population with a bachelor's degree or higher below state average.
Averages for the 2020 tax year for zip code 48849, filed in 2021:
Average Adjusted Gross Income (AGI) in 2020: $57,866 (Individual Income Tax Returns)
Here:
$57,866
State:
$68,945
Salary/wage: $51,635 (reported on 79.7% of returns)
Here:
$51,635
State:
$57,142
(% of AGI for various income ranges: 1106.1% for AGIs below $25k, 3603.2% for AGIs $25k-50k, 6476.0% for AGIs $50k-75k, 9454.1% for AGIs $75k-100k, 15734.0% for AGIs $100k-200k)
Taxable interest for individuals: $747 (reported on 31.4% of returns)
This zip code:
$747
Michigan:
$1,630
(% of AGI for various income ranges: 14.3% for AGIs below $25k, 18.7% for AGIs $25k-50k, 27.4% for AGIs $50k-75k, 68.8% for AGIs $75k-100k, 58.0% for AGIs $100k-200k)
Ordinary dividends: $3,191 (reported on 15.2% of returns)
Here:
$3,191
State:
$6,972
(% of AGI for various income ranges: 15.6% for AGIs below $25k, 33.2% for AGIs $25k-50k, 32.6% for AGIs $50k-75k, 60.6% for AGIs $75k-100k, 254.0% for AGIs $100k-200k)
Net capital gain/loss in AGI: +$8,798 (reported on 14.5% of returns)
Here:
+$8,798
State:
+$20,064
(% of AGI for various income ranges: 8.3% for AGIs below $25k, 46.8% for AGIs $25k-50k, 33.4% for AGIs $50k-75k, 369.4% for AGIs $75k-100k, 522.4% for AGIs $100k-200k)
Profit/loss from business: +$13,471 (reported on 12.1% of returns)
Here:
+$13,471
State:
+$11,172
(% of AGI for various income ranges: 80.2% for AGIs below $25k, 133.8% for AGIs $25k-50k, 159.7% for AGIs $50k-75k, 447.6% for AGIs $75k-100k, 863.6% for AGIs $100k-200k)
Taxable individual retirement arrangement distribution: $16,341 (reported on 11.0% of returns)
48849:
$16,341
Michigan:
$19,803
(% of AGI for various income ranges: 90.0% for AGIs below $25k, 118.2% for AGIs $25k-50k, 233.4% for AGIs $50k-75k, 565.3% for AGIs $75k-100k, 902.4% for AGIs $100k-200k)
Total itemized deductions: $28,327 (reported on 3.8% of returns)
Here:
$28,327
State:
$34,117
(% of AGI for various income ranges: 93.1% for AGIs below $25k, 206.9% for AGIs $50k-75k, 457.6% for AGIs $100k-200k)
Charity contributions: $12,850 (reported on 2.8% of returns)
Here:
$12,850
State:
$13,548
(% of AGI for various income ranges: 73.4% for AGIs $50k-75k, 308.4% for AGIs $100k-200k)
Taxes paid: $6,891 (reported on 3.8% of returns)
48849:
$6,891
State:
$7,972
(% of AGI for various income ranges: 16.7% for AGIs below $25k, 48.0% for AGIs $50k-75k, 118.0% for AGIs $100k-200k)
Earned income credit: $2,162 (reported on 12.8% of returns)
Here:
$2,162
State:
$2,251
(% of AGI for various income ranges: 67.2% for AGIs below $25k, 72.8% for AGIs $25k-50k)
Percentage of individuals using paid preparers for their 2020 taxes: 95.2%
Here:
95%
State:
93%
(% for various income ranges: 95.4% for AGIs below $25k, 95.0% for AGIs $25k-50k, 93.8% for AGIs $50k-75k, 96.3% for AGIs $75k-100k, 95.2% for AGIs $100k-200k, 100.0% for AGIs over 200k)
Averages for the 2012 tax year for zip code 48849, filed in 2013:
Average Adjusted Gross Income (AGI) in 2012: $47,535 (Individual Income Tax Returns)
Here:
$47,535
State:
$55,609
Salary/wage: $39,707 (reported on 82.5% of returns)
Here:
$39,707
State:
$46,782
(% of AGI for various income ranges: 67.9% for AGIs below $25k, 75.2% for AGIs $25k-50k, 77.1% for AGIs $50k-75k, 75.2% for AGIs $75k-100k, 74.0% for AGIs $100k-200k, 26.8% for AGIs over 200k)
Taxable interest for individuals: $1,189 (reported on 30.7% of returns)
This zip code:
$1,189
Michigan:
$1,491
(% of AGI for various income ranges: 1.4% for AGIs below $25k, 0.9% for AGIs $25k-50k, 0.7% for AGIs $50k-75k, 0.4% for AGIs $75k-100k, 1.0% for AGIs $100k-200k, 0.3% for AGIs over 200k)
Ordinary dividends: $3,403 (reported on 13.1% of returns)
Here:
$3,403
State:
$6,225
(% of AGI for various income ranges: 1.0% for AGIs below $25k, 0.3% for AGIs $25k-50k, 0.4% for AGIs $50k-75k, 0.9% for AGIs $75k-100k, 2.7% for AGIs $100k-200k)
Net capital gain/loss in AGI: +$3,844 (reported on 9.9% of returns)
Here:
+$3,844
State:
+$9,326
(% of AGI for various income ranges: 0.3% for AGIs $25k-50k, 1.1% for AGIs $100k-200k, 4.6% for AGIs over 200k)
Profit/loss from business: +$10,741 (reported on 11.7% of returns)
Here:
+$10,741
State:
+$11,523
(% of AGI for various income ranges: 4.2% for AGIs below $25k, 1.7% for AGIs $25k-50k, 2.1% for AGIs $50k-75k, 3.4% for AGIs $75k-100k, 4.3% for AGIs $100k-200k)
Taxable individual retirement arrangement distribution: $10,184 (reported on 11.7% of returns)
48849:
$10,184
Michigan:
$15,298
(% of AGI for various income ranges: 4.5% for AGIs below $25k, 2.6% for AGIs $25k-50k, 2.3% for AGIs $50k-75k, 2.9% for AGIs $75k-100k, 2.8% for AGIs $100k-200k)
Total itemized deductions: $18,025 (20% of AGI, reported on 23.4% of returns)
Here:
$18,025
State:
$21,628
Here:
20.0% of AGI
State:
18.4% of AGI
(% of AGI for various income ranges: 7.1% for AGIs below $25k, 6.6% for AGIs $25k-50k, 8.3% for AGIs $50k-75k, 10.4% for AGIs $75k-100k, 11.2% for AGIs $100k-200k, 8.8% for AGIs over 200k)
Charity contributions: $4,045 (reported on 18.6% of returns)
Here:
$4,045
State:
$4,225
(% of AGI for various income ranges: 0.5% for AGIs below $25k, 1.0% for AGIs $25k-50k, 1.5% for AGIs $50k-75k, 1.7% for AGIs $75k-100k, 2.1% for AGIs $100k-200k, 2.4% for AGIs over 200k)
Taxes paid: $5,898 (reported on 23.4% of returns)
48849:
$5,898
State:
$8,327
(% of AGI for various income ranges: 1.3% for AGIs below $25k, 1.4% for AGIs $25k-50k, 2.5% for AGIs $50k-75k, 3.7% for AGIs $75k-100k, 4.6% for AGIs $100k-200k, 3.1% for AGIs over 200k)
Earned income credit: $2,046 (reported on 16.8% of returns)
Here:
$2,046
State:
$2,306
(% of AGI for various income ranges: 5.6% for AGIs below $25k, 1.0% for AGIs $25k-50k)
Percentage of individuals using paid preparers for their 2012 taxes: 58.8%
Here:
59%
State:
57%
(% for various income ranges: 53.8% for AGIs below $25k, 60.3% for AGIs $25k-50k, 61.4% for AGIs $50k-75k, 60.0% for AGIs $75k-100k, 68.2% for AGIs $100k-200k, 75.0% for AGIs over 200k)
Averages for the 2004 tax year for zip code 48849, filed in 2005:
Average Adjusted Gross Income (AGI) in 2004: $38,701 (Individual Income Tax Returns)
Here:
$38,701
State:
$48,204
Salary/wage: $35,947 (reported on 86.2% of returns)
Here:
$35,947
State:
$42,791
(% of AGI for various income ranges: 131.1% for AGIs below $10k, 68.3% for AGIs $10k-25k, 82.9% for AGIs $25k-50k, 84.1% for AGIs $50k-75k, 85.4% for AGIs $75k-100k, 66.5% for AGIs over 100k)
Taxable interest for individuals: $1,365 (reported on 43.6% of returns)
This zip code:
$1,365
Michigan:
$1,725
(% of AGI for various income ranges: 7.3% for AGIs below $10k, 4.0% for AGIs $10k-25k, 1.0% for AGIs $25k-50k, 0.6% for AGIs $50k-75k, 1.1% for AGIs $75k-100k, 2.3% for AGIs over 100k)
Taxable dividends: $1,821 (reported on 18.2% of returns)
Here:
$1,821
State:
$3,420
(% of AGI for various income ranges: 2.7% for AGIs below $10k, 1.3% for AGIs $10k-25k, 0.5% for AGIs $25k-50k, 1.0% for AGIs $50k-75k, 0.6% for AGIs $75k-100k, 1.1% for AGIs over 100k)
Net capital gain/loss: +$4,381 (reported on 13.7% of returns)
Here:
+$4,381
State:
+$8,532
(% of AGI for various income ranges: -1.4% for AGIs below $10k, 0.1% for AGIs $10k-25k, 0.6% for AGIs $25k-50k, 1.0% for AGIs $50k-75k, 2.3% for AGIs $75k-100k, 3.9% for AGIs over 100k)
Profit/loss from business: +$8,462 (reported on 14.3% of returns)
Here:
+$8,462
State:
+$9,547
(% of AGI for various income ranges: 15.4% for AGIs below $10k, 3.5% for AGIs $10k-25k, 2.1% for AGIs $25k-50k, 2.3% for AGIs $50k-75k, 1.6% for AGIs $75k-100k, 5.8% for AGIs over 100k)
IRA payment deduction: $2,800 (reported on 1.5% of returns)
48849:
$2,800
Michigan:
$2,875
Self-employed pension: $8,100 (reported on 0.4% of returns)
Here:
$8,100
Michigan:
$13,826
Total itemized deductions: $15,232 (22% of AGI, reported on 30.1% of returns)
Here:
$15,232
State:
$18,509
Here:
22.4% of AGI
State:
20.7% of AGI
(% of AGI for various income ranges: 16.7% for AGIs below $10k, 9.6% for AGIs $10k-25k, 9.9% for AGIs $25k-50k, 12.3% for AGIs $50k-75k, 12.7% for AGIs $75k-100k, 13.7% for AGIs over 100k)
Charity contributions deductions: $2,757 (4% of AGI, reported on 24.7% of returns)
Here:
$2,757
State:
$3,365
Here:
3.8% of AGI
State:
3.6% of AGI
(% of AGI for various income ranges: 1.4% for AGIs below $10k, 1.2% for AGIs $10k-25k, 1.3% for AGIs $25k-50k, 1.6% for AGIs $50k-75k, 1.6% for AGIs $75k-100k, 3.0% for AGIs over 100k)
Total tax: $4,614 (reported on 74.0% of returns)
48849:
$4,614
State:
$7,691
(% of AGI for various income ranges: 4.4% for AGIs below $10k, 4.0% for AGIs $10k-25k, 6.5% for AGIs $25k-50k, 7.9% for AGIs $50k-75k, 9.5% for AGIs $75k-100k, 15.5% for AGIs over 100k)
Earned income credit: $1,547 (reported on 13.2% of returns)
Here:
$1,547
State:
$1,737
Percentage of individuals using paid preparers for their 2004 taxes: 58.1%
Here:
58%
State:
60%
(% for various income ranges: 46.3% for AGIs below $10k, 57.0% for AGIs $10k-25k, 61.2% for AGIs $25k-50k, 63.9% for AGIs $50k-75k, 64.8% for AGIs $75k-100k, 68.5% for AGIs over 100k)
Household received Food Stamps/SNAP in the past 12 months: 270 Household did not receive Food Stamps/SNAP in the past 12 months: 1,811
Women who had a birth in the past 12 months: 57 (39 now married, 18 unmarried) Women who did not have a birth in the past 12 months: 1,062 (517 now married, 542 unmarried)
Housing units in zip code 48849 with a mortgage: 967 (76 second mortgage, 69 both second mortgage and home equity loan) Houses without a mortgage: 11
Median monthly owner costs for units with a mortgage: $1,354 Median monthly owner costs for units without a mortgage: $568
Residents with income below the poverty level in 2022:
This zip code:
7.3%
Whole state:
13.4%
Residents with income below 50% of the poverty level in 2022:
This zip code:
3.9%
Whole state:
6.9%
Median number of rooms in houses and condos:
Here:
6.7
State:
6.5
Median number of rooms in apartments:
Here:
4.9
State:
4.3
Notable locations in this zip code not listed on our city pages
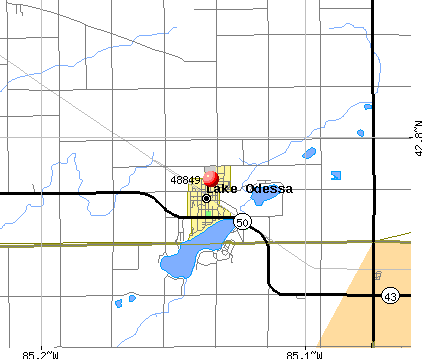
Notable locations in zip code 48849: Woodbury Station (A), Morrison Lake Country Club (B), Lake Odessa Station (C), Lake Odessa Police Department (D), Lake Odessa Fire Department (E). Display/hide their locations on the map
Churches in zip code 48849 include: Church of God (A), Grace Church (B), Lakewood United Methodist Church (C), Lakewood Church (D), Pleasant Valley Church (E), Sebewa Center Church (F), Sebewa Church (G), Saint Herman Orthodox Church (H), Christian Reformed Church (I). Display/hide their locations on the map
Cemeteries: Cheney Cemetery (1), Dunkard Cemetery (2), Mauch Cemetery (3), Lakeside Cemetery (4), Sebewa Baptist Cemetery (5), Meyers Cemetery (6). Display/hide their locations on the map
Lakes: Tupper Lake (A), Twin Lakes (B), Little Lake (C), Jordan Lake (D), Mud Lake (E), Mini Lake (F), Duncan Lake (G), Cat Lake (H). Display/hide their locations on the map
1,054 married couples with children.
170 single-parent households (96 men, 74 women).
98.2% of residents of 48849 zip code speak English at home.
0.7% of residents speak Spanish at home (74% very well, 26% well).
0.5% of residents speak other Indo-European language at home (100% very well).
0.3% of residents speak Asian or Pacific Island language at home (100% very well).
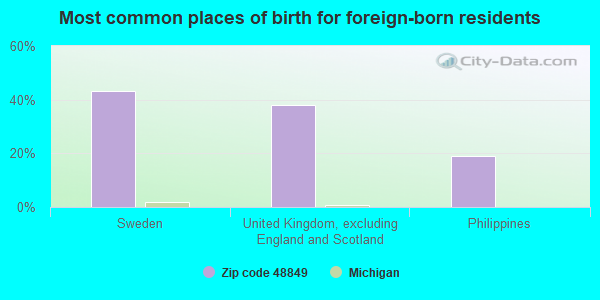
Foreign born population: 58 (1.0%) (76.8% of them are naturalized citizens)
This zip code:
1.0%
Whole state:
6.9%
43%Sweden
38%United Kingdom, excluding England and Scotland
19%Philippines
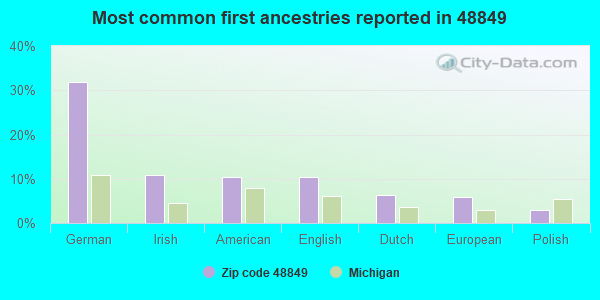
32%German
11%Irish
10%American
10%English
6%Dutch
6%European
3%Polish
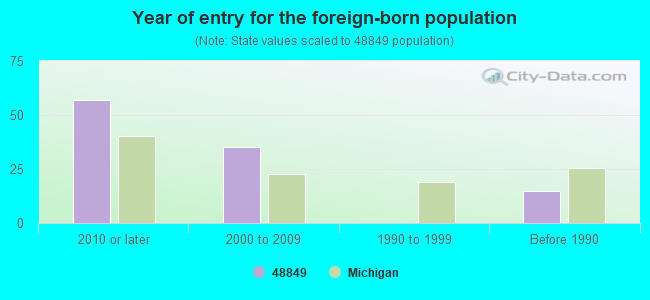
Year of entry for the foreign-born population
572010 or later
352000 to 2009
01990 to 1999
15Before 1990
Facilities with environmental interests located in this zip code:
MI DEPT/TRANSPORTATION BRIDGE (M-50 OVER TYLER CREEK in LAKE ODESSA, MI)
(Resource Conservation and Recovery Act (tracking hazardous waste)) Organizations: MICH DEPT OF TRANSPORTATION (CONTACT/OPERATOR)
Alternative names: MIDOT BRIDGE M-50 OVER TYLER CREEK
MI DEPT/STATE POLICE (825 1ST ST in LAKE ODESSA, MI)
(Resource Conservation and Recovery Act (tracking hazardous waste)) Alternative names: MI DEPT/STATE POLICE (E)
EIGHT CAP INC (821 4TH AVE in LAKE ODESSA, MI)
(Resource Conservation and Recovery Act (tracking hazardous waste))
APEC (1201 N 4TH AVE in LAKE ODESSA, MI)
Conditionally Exempt Small Quantity Generators, less than 100 kg/month of hazardous waste (Resource Conservation and Recovery Act (tracking hazardous waste)) - notification Organizations: APEC CORPORTION (CONTACT/OWNER)
Housing units lacking complete plumbing facilities: 1.9% Housing units lacking complete kitchen facilities: 0.3%
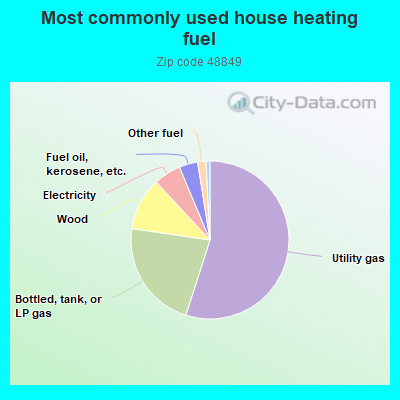
55.0%Utility gas
22.4%Bottled, tank, or LP gas
10.8%Wood
5.6%Electricity
3.8%Fuel oil, kerosene, etc.
1.7%Other fuel
0.8%No fuel used
Population in 1990: 5,386. Population change in the 1990s: +764 (+14.2%).
Place of birth for U.S.-born residents:
This state: 4,926
Northeast: 40
Midwest: 413
South: 156
West: 129
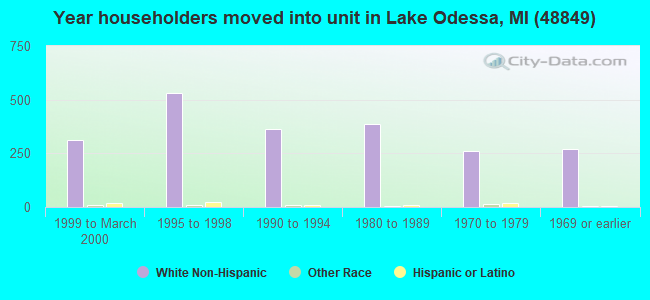
61% of the 48849 zip code residents lived in the same house 5 years ago. Out of people who lived in different houses, 47% lived in this county. Out of people who lived in different counties, 50% lived in Michigan.
92% of the 48849 zip code residents lived in the same house 1 year ago. Out of people who lived in different houses, 28% moved from this county. Out of people who lived in different houses, 54% moved from different county within same state. Out of people who lived in different houses, 17% moved from different state. Out of people who lived in different houses, 2% moved from abroad.
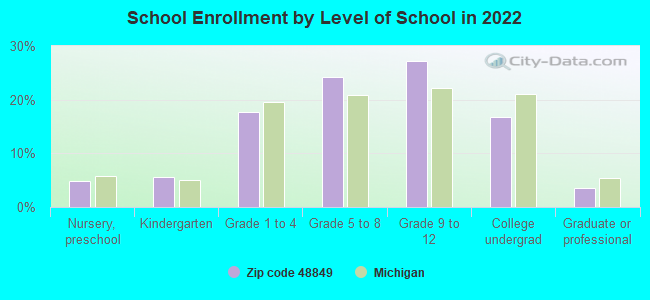
Private vs. public school enrollment:
Students in private schools in grades 1 to 8 (elementary and middle school): 62
Here:
12.1%
Michigan:
12.4%
Students in private schools in grades 9 to 12 (high school): 49
Here:
14.9%
Michigan:
9.8%
Students in private undergraduate colleges: 39
Here:
19.2%
Michigan:
14.9%
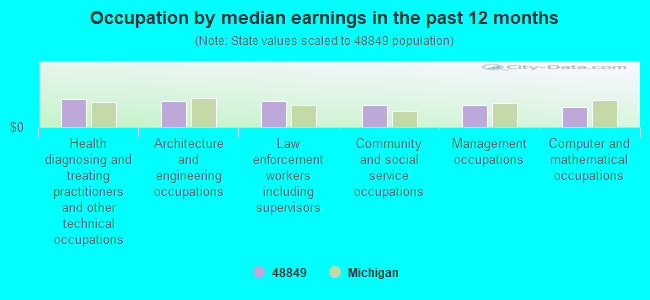
Occupation by median earnings in the past 12 months ($)
84,161Health diagnosing and treating practitioners and other technical occupations
77,440Architecture and engineering occupations
77,220Law enforcement workers including supervisors
66,049Community and social service occupations
65,095Management occupations
59,463Computer and mathematical occupations
Companies with federal contracts located in this zip code:
CHEM SOLUTIONS LLC (908 LAKEVIEW DR in LAKE ODESSA, MI; small business) : $16,800 in 2 contractsfrom 2004 to 2006
$8,400 with Army for Equipment and Materials Testing -- Furnace, Steam Plant, and Drying Equipment; and Nuclear Reactors. Taking place in SC. Signed on 2006-01-12. Completion date: 2006-09-30.
$8,400 with Army for Water Quality Support Services. Taking place in SC. Signed on 2004-10-20. Completion date: 2005-09-30.
Top industries in this zip code by the number of employees in 2005:
2002 - 2018 National Fire Incident Reporting System (NFIRS) incidents
Based on the data from the years 2002 - 2018 the average number of fire incidents per year is 19. The highest number of fire incidents - 38 took place in 2009, and the least - 2 in 2013. The data has a declining trend.
When looking into fire subcategories, the most incidents belonged to: Structure Fires (51.1%), and Outside Fires (37.5%).
Fire incident types reported to NFIRS in Zip Code 48849
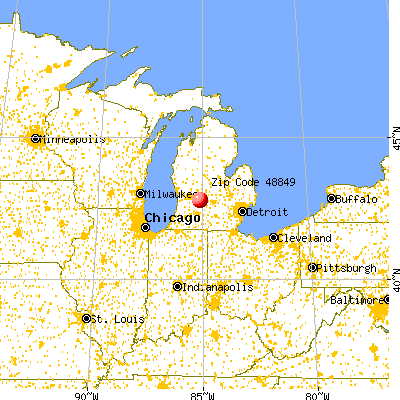


 Nearest zip codes: 48897, 48815, 48881, 48890, 49325, 48875.
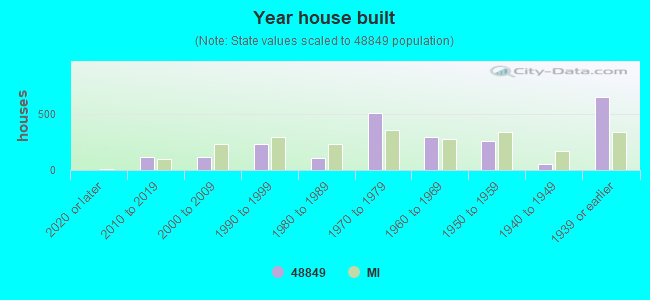


 Based on the data from the years 2002 - 2018 the average number of fire incidents per year is 19. The highest number of fire incidents - 38 took place in 2009, and the least - 2 in 2013. The data has a declining trend.
 When looking into fire subcategories, the most incidents belonged to: Structure Fires (51.1%), and Outside Fires (37.5%).