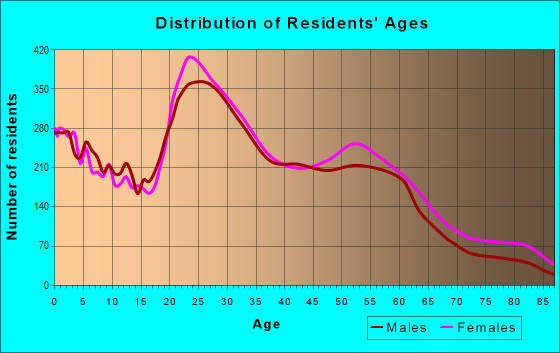
Estimated zip code population in 2022: 33,142 Zip code population in 2010: 34,560 Zip code population in 2000: 35,735
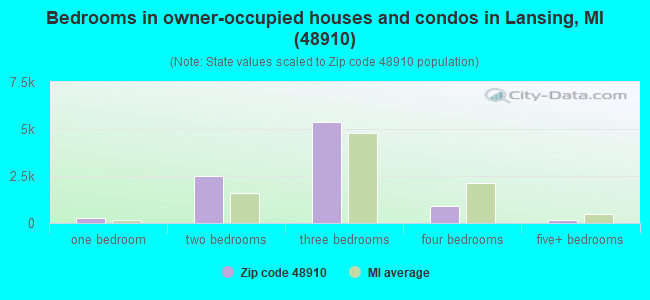
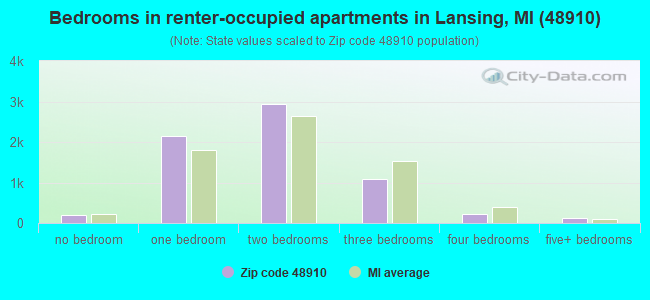
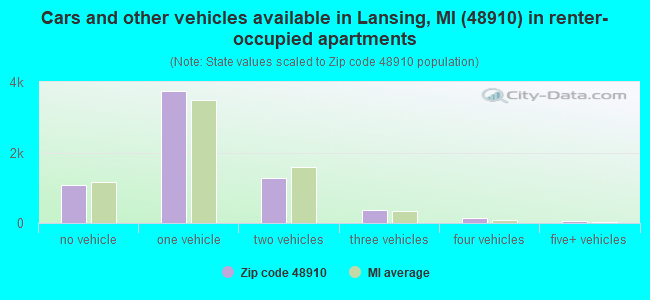
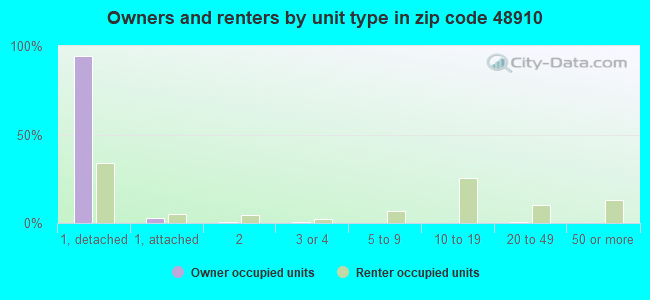
Houses and condos: 17,112 Renter-occupied apartments: 6,671
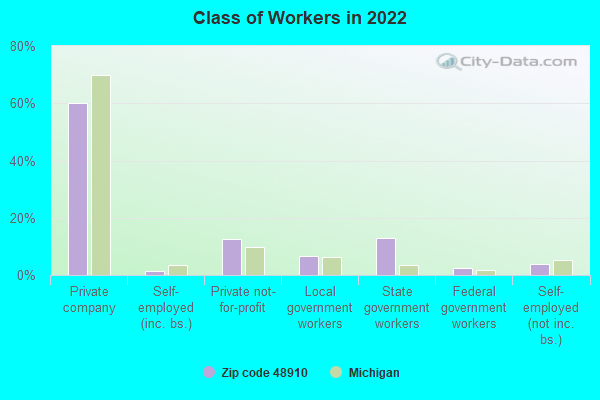
% of renters here:
42%
State:
27%
March 2022 cost of living index in zip code 48910: 83.8 (less than average, U.S. average is 100)
Land area: 15.2 sq. mi. Water area: 0.3 sq. mi.
Population density: 2,180 people per square mile
(low).
OSM Map
General Map
Google Map
MSN Map
OSM Map
General Map
Google Map
MSN Map
OSM Map
General Map
Google Map
MSN Map
OSM Map
General Map
Google Map
MSN Map
Please wait while loading the map...
Real estate property taxes paid for housing units in 2022:
This zip code:
2.0% ($2,505)
Michigan:
1.2% ($2,746)
Median real estate property taxes paid for housing units with mortgages in 2022: $2,584 (2.1%) Median real estate property taxes paid for housing units with no mortgage in 2022: $2,392 (2.0%)
Averages for the 2020 tax year for zip code 48910, filed in 2021:
Average Adjusted Gross Income (AGI) in 2020: $41,593 (Individual Income Tax Returns)
Here:
$41,593
State:
$68,945
Salary/wage: $37,582 (reported on 81.9% of returns)
Here:
$37,582
State:
$57,142
(% of AGI for various income ranges: 1032.9% for AGIs below $25k, 3421.8% for AGIs $25k-50k, 6498.6% for AGIs $50k-75k, 9589.3% for AGIs $75k-100k, 16654.8% for AGIs $100k-200k, 53220.0% for AGIs over 200k)
Taxable interest for individuals: $653 (reported on 22.0% of returns)
This zip code:
$653
Michigan:
$1,630
(% of AGI for various income ranges: 5.8% for AGIs below $25k, 8.6% for AGIs $25k-50k, 20.3% for AGIs $50k-75k, 24.9% for AGIs $75k-100k, 106.4% for AGIs $100k-200k, 1983.3% for AGIs over 200k)
Ordinary dividends: $2,316 (reported on 9.3% of returns)
Here:
$2,316
State:
$6,972
(% of AGI for various income ranges: 7.0% for AGIs below $25k, 12.3% for AGIs $25k-50k, 27.6% for AGIs $50k-75k, 58.2% for AGIs $75k-100k, 143.0% for AGIs $100k-200k, 3243.3% for AGIs over 200k)
Net capital gain/loss in AGI: +$5,278 (reported on 8.6% of returns)
Here:
+$5,278
State:
+$20,064
(% of AGI for various income ranges: 4.7% for AGIs below $25k, 10.1% for AGIs $25k-50k, 47.6% for AGIs $50k-75k, 121.5% for AGIs $75k-100k, 346.0% for AGIs $100k-200k, 10710.0% for AGIs over 200k)
Profit/loss from business: +$7,158 (reported on 13.1% of returns)
Here:
+$7,158
State:
+$11,172
(% of AGI for various income ranges: 62.9% for AGIs below $25k, 68.7% for AGIs $25k-50k, 101.6% for AGIs $50k-75k, 253.2% for AGIs $75k-100k, 1065.6% for AGIs $100k-200k)
Taxable individual retirement arrangement distribution: $12,889 (reported on 5.2% of returns)
48910:
$12,889
Michigan:
$19,803
(% of AGI for various income ranges: 34.1% for AGIs below $25k, 46.0% for AGIs $25k-50k, 125.4% for AGIs $50k-75k, 164.3% for AGIs $75k-100k, 720.4% for AGIs $100k-200k)
Total itemized deductions: $25,461 (reported on 2.6% of returns)
Here:
$25,461
State:
$34,117
(% of AGI for various income ranges: 7.9% for AGIs below $25k, 30.9% for AGIs $25k-50k, 111.8% for AGIs $50k-75k, 172.2% for AGIs $75k-100k, 557.6% for AGIs $100k-200k, 9523.3% for AGIs over 200k)
Charity contributions: $13,700 (reported on 2.0% of returns)
Here:
$13,700
State:
$13,548
(% of AGI for various income ranges: 7.5% for AGIs $25k-50k, 33.3% for AGIs $50k-75k, 51.6% for AGIs $75k-100k, 212.2% for AGIs $100k-200k, 7116.7% for AGIs over 200k)
Taxes paid: $6,595 (reported on 2.5% of returns)
48910:
$6,595
State:
$7,972
(% of AGI for various income ranges: 1.2% for AGIs below $25k, 7.7% for AGIs $25k-50k, 32.2% for AGIs $50k-75k, 65.4% for AGIs $75k-100k, 177.4% for AGIs $100k-200k, 1070.0% for AGIs over 200k)
Earned income credit: $2,264 (reported on 20.1% of returns)
Here:
$2,264
State:
$2,251
(% of AGI for various income ranges: 97.0% for AGIs below $25k, 63.4% for AGIs $25k-50k, 1.1% for AGIs $50k-75k)
Percentage of individuals using paid preparers for their 2020 taxes: 93.7%
Here:
94%
State:
93%
(% for various income ranges: 93.5% for AGIs below $25k, 94.2% for AGIs $25k-50k, 93.7% for AGIs $50k-75k, 93.5% for AGIs $75k-100k, 91.1% for AGIs $100k-200k, 100.0% for AGIs over 200k)
Averages for the 2012 tax year for zip code 48910, filed in 2013:
Average Adjusted Gross Income (AGI) in 2012: $35,304 (Individual Income Tax Returns)
Here:
$35,304
State:
$55,609
Salary/wage: $32,237 (reported on 84.3% of returns)
Here:
$32,237
State:
$46,782
(% of AGI for various income ranges: 74.2% for AGIs below $25k, 80.2% for AGIs $25k-50k, 79.9% for AGIs $50k-75k, 79.1% for AGIs $75k-100k, 77.1% for AGIs $100k-200k, 37.3% for AGIs over 200k)
Taxable interest for individuals: $1,010 (reported on 24.5% of returns)
This zip code:
$1,010
Michigan:
$1,491
(% of AGI for various income ranges: 0.5% for AGIs below $25k, 0.4% for AGIs $25k-50k, 0.6% for AGIs $50k-75k, 0.3% for AGIs $75k-100k, 0.3% for AGIs $100k-200k, 6.8% for AGIs over 200k)
Ordinary dividends: $2,420 (reported on 10.1% of returns)
Here:
$2,420
State:
$6,225
(% of AGI for various income ranges: 0.5% for AGIs below $25k, 0.5% for AGIs $25k-50k, 0.5% for AGIs $50k-75k, 0.5% for AGIs $75k-100k, 0.8% for AGIs $100k-200k, 5.3% for AGIs over 200k)
Net capital gain/loss in AGI: +$3,863 (reported on 7.1% of returns)
Here:
+$3,863
State:
+$9,326
(% of AGI for various income ranges: 0.5% for AGIs $75k-100k, 0.9% for AGIs $100k-200k, 15.7% for AGIs over 200k)
Profit/loss from business: +$7,351 (reported on 12.3% of returns)
Here:
+$7,351
State:
+$11,523
(% of AGI for various income ranges: 7.2% for AGIs below $25k, 1.6% for AGIs $25k-50k, 1.1% for AGIs $50k-75k, 1.9% for AGIs $75k-100k, 2.6% for AGIs $100k-200k)
Taxable individual retirement arrangement distribution: $10,778 (reported on 6.4% of returns)
48910:
$10,778
Michigan:
$15,298
(% of AGI for various income ranges: 1.7% for AGIs below $25k, 1.5% for AGIs $25k-50k, 1.9% for AGIs $50k-75k, 2.0% for AGIs $75k-100k, 3.8% for AGIs $100k-200k)
Total itemized deductions: $14,658 (22% of AGI, reported on 22.7% of returns)
Here:
$14,658
State:
$21,628
Here:
22.3% of AGI
State:
18.4% of AGI
(% of AGI for various income ranges: 5.2% for AGIs below $25k, 8.0% for AGIs $25k-50k, 10.5% for AGIs $50k-75k, 10.8% for AGIs $75k-100k, 12.5% for AGIs $100k-200k, 16.6% for AGIs over 200k)
Charity contributions: $3,294 (reported on 17.0% of returns)
Here:
$3,294
State:
$4,225
(% of AGI for various income ranges: 0.5% for AGIs below $25k, 1.0% for AGIs $25k-50k, 1.7% for AGIs $50k-75k, 1.7% for AGIs $75k-100k, 2.3% for AGIs $100k-200k, 7.2% for AGIs over 200k)
Taxes paid: $5,609 (reported on 22.6% of returns)
48910:
$5,609
State:
$8,327
(% of AGI for various income ranges: 1.2% for AGIs below $25k, 2.7% for AGIs $25k-50k, 4.4% for AGIs $50k-75k, 4.4% for AGIs $75k-100k, 5.4% for AGIs $100k-200k, 6.3% for AGIs over 200k)
Earned income credit: $2,265 (reported on 24.0% of returns)
Here:
$2,265
State:
$2,306
(% of AGI for various income ranges: 7.6% for AGIs below $25k, 0.9% for AGIs $25k-50k)
Percentage of individuals using paid preparers for their 2012 taxes: 49.1%
Here:
49%
State:
57%
(% for various income ranges: 46.6% for AGIs below $25k, 49.3% for AGIs $25k-50k, 54.3% for AGIs $50k-75k, 52.0% for AGIs $75k-100k, 52.5% for AGIs $100k-200k, 80.0% for AGIs over 200k)
Averages for the 2004 tax year for zip code 48910, filed in 2005:
Average Adjusted Gross Income (AGI) in 2004: $32,644 (Individual Income Tax Returns)
Here:
$32,644
State:
$48,204
Salary/wage: $31,076 (reported on 87.7% of returns)
Here:
$31,076
State:
$42,791
(% of AGI for various income ranges: 83.7% for AGIs below $10k, 78.8% for AGIs $10k-25k, 86.7% for AGIs $25k-50k, 86.4% for AGIs $50k-75k, 83.9% for AGIs $75k-100k, 70.9% for AGIs over 100k)
Taxable interest for individuals: $1,008 (reported on 35.2% of returns)
This zip code:
$1,008
Michigan:
$1,725
(% of AGI for various income ranges: 2.7% for AGIs below $10k, 1.5% for AGIs $10k-25k, 0.8% for AGIs $25k-50k, 0.8% for AGIs $50k-75k, 0.9% for AGIs $75k-100k, 2.0% for AGIs over 100k)
Taxable dividends: $1,613 (reported on 14.8% of returns)
Here:
$1,613
State:
$3,420
(% of AGI for various income ranges: 1.4% for AGIs below $10k, 0.7% for AGIs $10k-25k, 0.4% for AGIs $25k-50k, 0.5% for AGIs $50k-75k, 0.5% for AGIs $75k-100k, 2.6% for AGIs over 100k)
Net capital gain/loss: +$3,112 (reported on 9.9% of returns)
Here:
+$3,112
State:
+$8,532
(% of AGI for various income ranges: -0.2% for AGIs below $10k, -0.1% for AGIs $10k-25k, 0.2% for AGIs $25k-50k, 0.2% for AGIs $50k-75k, 0.8% for AGIs $75k-100k, 7.9% for AGIs over 100k)
Profit/loss from business: +$4,634 (reported on 10.4% of returns)
Here:
+$4,634
State:
+$9,547
(% of AGI for various income ranges: 3.6% for AGIs below $10k, 2.6% for AGIs $10k-25k, 1.2% for AGIs $25k-50k, 1.3% for AGIs $50k-75k, 0.6% for AGIs $75k-100k, 1.6% for AGIs over 100k)
IRA payment deduction: $2,360 (reported on 1.4% of returns)
48910:
$2,360
Michigan:
$2,875
(% of AGI for various income ranges: 0.1% for AGIs below $10k, 0.1% for AGIs $10k-25k, 0.1% for AGIs $25k-50k, 0.1% for AGIs $50k-75k, 0.1% for AGIs $75k-100k)
Self-employed pension: $5,478 (reported on 0.1% of returns)
Here:
$5,478
Michigan:
$13,826
Total itemized deductions: $12,340 (24% of AGI, reported on 32.1% of returns)
Here:
$12,340
State:
$18,509
Here:
23.6% of AGI
State:
20.7% of AGI
(% of AGI for various income ranges: 6.9% for AGIs below $10k, 7.4% for AGIs $10k-25k, 12.1% for AGIs $25k-50k, 13.4% for AGIs $50k-75k, 13.6% for AGIs $75k-100k, 16.1% for AGIs over 100k)
Charity contributions deductions: $2,578 (5% of AGI, reported on 25.8% of returns)
Here:
$2,578
State:
$3,365
Here:
4.6% of AGI
State:
3.6% of AGI
(% of AGI for various income ranges: 0.5% for AGIs below $10k, 0.8% for AGIs $10k-25k, 1.5% for AGIs $25k-50k, 2.0% for AGIs $50k-75k, 2.4% for AGIs $75k-100k, 6.1% for AGIs over 100k)
Total tax: $3,792 (reported on 73.0% of returns)
48910:
$3,792
State:
$7,691
(% of AGI for various income ranges: 1.8% for AGIs below $10k, 4.1% for AGIs $10k-25k, 7.3% for AGIs $25k-50k, 9.6% for AGIs $50k-75k, 10.8% for AGIs $75k-100k, 15.4% for AGIs over 100k)
Earned income credit: $1,628 (reported on 17.2% of returns)
Here:
$1,628
State:
$1,737
Percentage of individuals using paid preparers for their 2004 taxes: 52.2%
Here:
52%
State:
60%
(% for various income ranges: 48.4% for AGIs below $10k, 54.8% for AGIs $10k-25k, 51.2% for AGIs $25k-50k, 51.7% for AGIs $50k-75k, 57.1% for AGIs $75k-100k, 62.1% for AGIs over 100k)
Likely homosexual households (counted as self-reported same-sex unmarried-partner households)
Lesbian couples: 0.3% of all households
Gay men: 0.1% of all households
Household received Food Stamps/SNAP in the past 12 months: 2,538 Household did not receive Food Stamps/SNAP in the past 12 months: 13,403
Women who had a birth in the past 12 months: 420 (336 now married, 88 unmarried) Women who did not have a birth in the past 12 months: 8,195 (2,289 now married, 5,927 unmarried)
Housing units in zip code 48910 with a mortgage: 6,170 (324 second mortgage, 14 home equity loan, 295 both second mortgage and home equity loan) Houses without a mortgage: 166
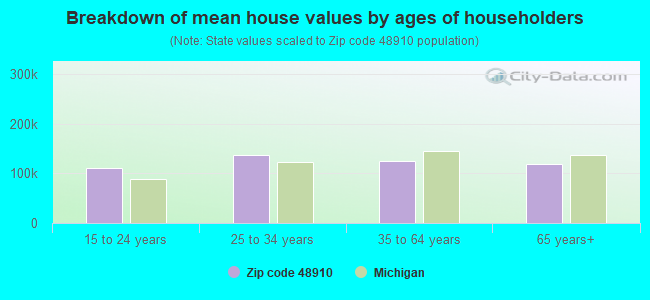
Median monthly owner costs for units with a mortgage: $1,074 Median monthly owner costs for units without a mortgage: $506
Residents with income below the poverty level in 2022:
This zip code:
18.3%
Whole state:
13.4%
Residents with income below 50% of the poverty level in 2022:
This zip code:
10.3%
Whole state:
6.9%
Median number of rooms in houses and condos:
Here:
5.8
State:
6.5
Median number of rooms in apartments:
Here:
3.9
State:
4.3
Notable locations in this zip code not listed on our city pages
Notable locations in zip code 48910: Sycamore Driving Range (A), Forest Akers Golf Course (B), Michigan State University Observatory (C), South Lansing Library (D), Lansing Fire and Rescue Station 5 (E), Lansing Fire Training Academy (F), Lansing Fire and Rescue Station 9 (G). Display/hide their locations on the map
Churches in zip code 48910 include: Bethlehem Lutheran Church (A), Mount Hope United Methodist Church (B), Doors of Healing Church (C), Glad Tidings Pentecostal Church (D), Bethany Baptist Church (E), Solid Rock Baptist Church (F), Kehillat Israel Congregation (G), Pennsylvania Avenue Church of God (H), Zion English Evangelical Lutheran Church (I). Display/hide their locations on the map
Parks in zip code 48910 include: Scott Woods Park (1), Shubell Park (2), Sycamore Park (3), Waldo Park (4), Washington Park (5), Grand Trunk Depot Historical Marker (6), Michigan Retail Hardware Association Historical Marker (7), REO Motor Car Company Historical Marker (8), REO Clubhouse Historical Marker (9). Display/hide their locations on the map
2,710 married couples with children.
2,536 single-parent households (418 men, 2,118 women).
86.3% of residents of 48910 zip code speak English at home.
6.3% of residents speak Spanish at home (53% very well, 12% well, 23% not well, 13% not at all).
3.4% of residents speak other Indo-European language at home (75% very well, 17% well, 8% not well).
2.2% of residents speak Asian or Pacific Island language at home (63% very well, 31% well, 6% not well).
1.8% of residents speak other language at home (55% very well, 22% well, 10% not well, 13% not at all).
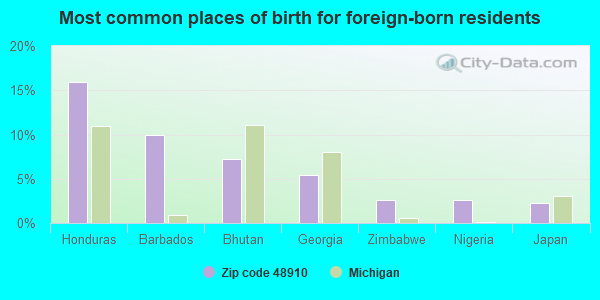
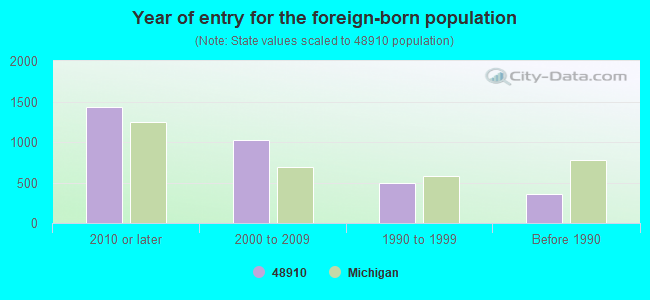
Foreign born population: 3,020 (9.1%) (28.5% of them are naturalized citizens)
Major facilities with environmental interests located in this zip code:
ATMOSPHERE ANNEALING INC (209-1 W MT HOPE RD in LANSING, MI)
AIR MINOR (AIRS/AFS) COMPLIANCE ACTIVITY (Tracking inspections of insecticide, fungicide, and rodenticide, and toxic substances) CRITERIA AND HAZARDOUS AIR POLLUTANT INVENTORY (Inventory of air pollution sources) Conditionally Exempt Small Quantity Generators, less than 100 kg/month of hazardous waste (Resource Conservation and Recovery Act (tracking hazardous waste)) TRI REPORTER (Tracking of toxic chemicals releasing facilities) Business SIC and NAICS classification: METAL HEAT TREATING Organizations: MAXCO INC (CONTACT/OPERATOR)
Alternative names: ATMOSPHERE ANNEALING INC-MT HOPE PLANT
EVERETT HIGH SCHOOL (3900 STABLER STREET in LANSING, MI)
(Geographic Names Information System) (National Center for Education Statistics) - STATE ID-01166 Organizations: LANSING PUBLIC SCHOOL DISTRICT (SCHOOL DISTRICT)
FOREST VIEW SCHOOL (3119 STONELEIGH DRIVE in LANSING, MI)
(Geographic Names Information System) (National Center for Education Statistics) - STATE ID-01269 Organizations: LANSING PUBLIC SCHOOL DISTRICT (SCHOOL DISTRICT)
ELMHURST SCHOOL (2400 PATTENGILL AVENUE in LANSING, MI)
(Geographic Names Information System) (National Center for Education Statistics) - STATE ID-01122 Organizations: LANSING PUBLIC SCHOOL DISTRICT (SCHOOL DISTRICT)
BEEKMAN CENTER (2901 WABASH ROAD in LANSING, MI)
(National Center for Education Statistics) - STATE ID-05261 Organizations: LANSING PUBLIC SCHOOL DISTRICT (SCHOOL DISTRICT)
EL-HAJJ MALIK EL-SHABAZZ ACADEMY (1028 W. BARNES AVENUE in LANSING, MI)
(National Center for Education Statistics) - STATE ID-08249
GM LANSING PLANTS 2,3&6 (MFD LANSING PLANT 3) (2800 W SAGINAW ST in LANSING, MI)
HAZARDOUS WASTE BIENNIAL REPORTER (Resource Conservation and Recovery Act (tracking hazardous waste)) Large Quantity Generators, more that 1000 kg of hazardous waste/month (Resource Conservation and Recovery Act (tracking hazardous waste)) TSD (Resource Conservation and Recovery Act (tracking hazardous waste)) TRI REPORTER (Tracking of toxic chemicals releasing facilities) Business SIC classification: AUTOMOTIVE STAMPINGS Organizations: GENERAL MOTORS CORPORATION (CONTACT/OPERATOR)
Alternative names: GMC LANSING PLANTS 2 3 & 6 (MFD LANSING PLANT #3, GMC OLDSMOBILE DIV PLTS 2 & 3
AMOCO OIL CO (3406 S LOGAN in LANSING, MI)
(Resource Conservation and Recovery Act (tracking hazardous waste)) Organizations: AMOCO OIL COMPANY (CONTACT/OWNER)
, BP PRODUCTS NORTH AMERICA INC (CONTACT/OWNER)
Alternative names: AMOCO OIL CO 119
FEDERAL FORGE INCORPORATED (2807 S. LOGAN ST. in LANSING, MI)
Conditionally Exempt Small Quantity Generators, less than 100 kg/month of hazardous waste (Resource Conservation and Recovery Act (tracking hazardous waste)) TRI REPORTER (Tracking of toxic chemicals releasing facilities) Organizations: BHARAT FORGE AMERICA INC (CONTACT/OPERATOR)
ADMIRAL PETROLEUM CO (5200 S PENNSYLVANIA AVE in LANSING, MI)
(Resource Conservation and Recovery Act (tracking hazardous waste))
BAY PETROLEUM CORP (500 W MT HOPE AVE in LANSING, MI)
(Resource Conservation and Recovery Act (tracking hazardous waste))
MI DEPT/ENVIRONMENTAL QUALITY (MAY & JUNE INTERSECTION in LANSING, MI)
(Resource Conservation and Recovery Act (tracking hazardous waste)) Organizations: MI DEPT ERD (CONTACT/OWNER)
Alternative names: MI DEPT /ERD (E)
Housing units lacking complete plumbing facilities: 0.9% Housing units lacking complete kitchen facilities: 0.9%
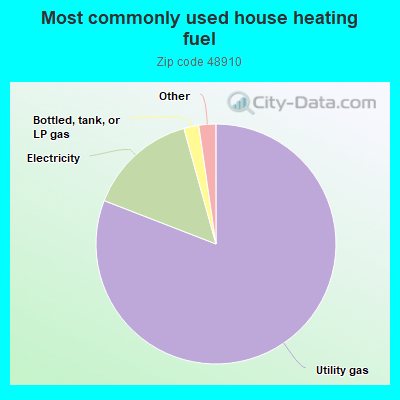
80.9%Utility gas
14.8%Electricity
2.0%Bottled, tank, or LP gas
0.8%Other fuel
0.6%No fuel used
0.5%Wood
Population in 1990: 37,654.
Place of birth for U.S.-born residents:
This state: 24,192
Northeast: 450
Midwest: 2,237
South: 2,045
West: 956
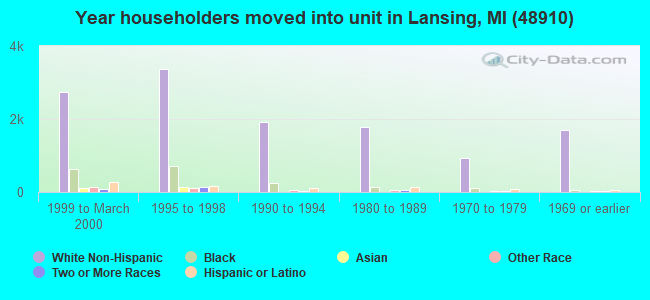
50% of the 48910 zip code residents lived in the same house 5 years ago. Out of people who lived in different houses, 60% lived in this county. Out of people who lived in different counties, 50% lived in Michigan.
85% of the 48910 zip code residents lived in the same house 1 year ago. Out of people who lived in different houses, 44% moved from this county. Out of people who lived in different houses, 39% moved from different county within same state. Out of people who lived in different houses, 14% moved from different state. Out of people who lived in different houses, 1% moved from abroad.
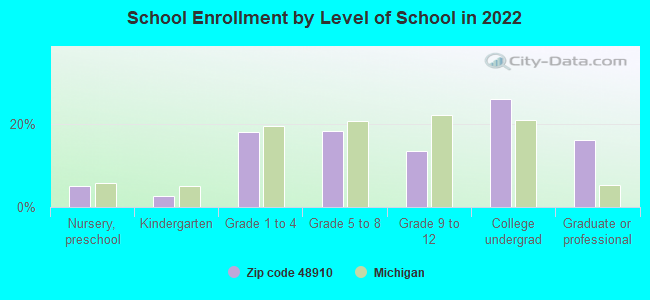
Private vs. public school enrollment:
Students in private schools in grades 1 to 8 (elementary and middle school): 420
Here:
15.2%
Michigan:
12.4%
Students in private schools in grades 9 to 12 (high school): 60
Here:
6.0%
Michigan:
9.8%
Students in private undergraduate colleges: 127
Here:
6.4%
Michigan:
14.9%
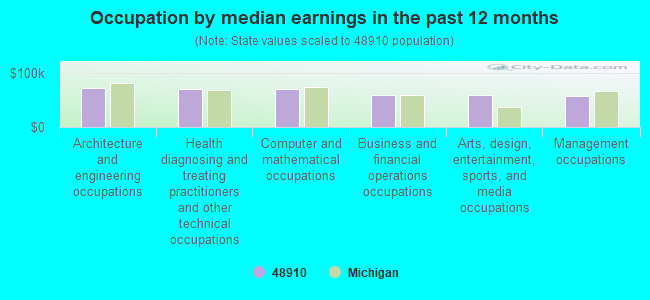
Occupation by median earnings in the past 12 months ($)
72,718Architecture and engineering occupations
70,274Health diagnosing and treating practitioners and other technical occupations
69,950Computer and mathematical occupations
59,027Business and financial operations occupations
58,653Arts, design, entertainment, sports, and media occupations
56,789Management occupations
Companies with biggest federal contracts located in this zip code (LANSING, MI):
MICHIGAN BTECHNOLOGY INST (3900 COLLINS RD) : $1,224,587 in 5 contractsfrom 2000 to 2001
Contracts for Other Environmental Protection -- Advanced Development (R&D), Pollution Control and Abatement -- Applied Research and Exploratory Development (R&D) by Air Force, Army Signed by year:2000: $315,188; 2001: $909,399; 2002: $0; 2003: $0; 2004: $0; 2005: $0; 2006: $0.
Biggest contracts:
$772,108 with Air Force for Other Environmental Protection -- Advanced Development (R&D). Signed on 2001-12-05. Completion date: 2003-02-20.
$275,188 with Army for Pollution Control and Abatement -- Applied Research and Exploratory Development (R&D). Signed on 2000-02-29. Completion date: 2001-02-28.
$107,845, same as above.Signed on 2001-01-26. Completion date: 2001-12-31.
$40,000, same as above.Signed on 2000-04-27. Completion date: 2000-12-31.
ABRAMS INSTRUMENT CORPORATION (1322 RENSEN ST; small business) : $1,089,991 in 21 contractsfrom 2000 to 2006
Contracts for Guns, through 30 mm, Liquid and Gas Flow, Liquid Level, and Mechanical Motion Measuring Instruments, Optical Sighting and Ranging Equipment by Defense Logistics Agency Signed by year:2000: $194,111; 2001: $100,266; 2002: $45,920; 2003: $164,022; 2004: $210,028; 2005: $156,284; 2006: $219,360.
Biggest contracts:
$131,040 with Defense Logistics Agency for Guns, through 30 mm. Signed on 2006-03-07. Completion date: 2006-09-23.
$88,320, same as above.Signed on 2006-04-05. Completion date: 2006-09-02.
$70,448 with Defense Logistics Agency for Liquid and Gas Flow, Liquid Level, and Mechanical Motion Measuring Instruments. Signed on 2004-09-29. Completion date: 2005-02-26.
$68,328 with Defense Logistics Agency for Guns, through 30 mm. Signed on 2003-12-09. Completion date: 2004-07-06.
EFX SYSTEMS INC (3900 COLLINS RD STE 1011; small business) : $570,000 in 2 contractsfrom 2000 to 2001
$500,000 with Army for Other Research and Development -- Basic Research (R&D). Signed on 2000-08-29. Completion date: 2002-08-27.
$70,000 with Army for Other Research and Development -- Applied Research and Exploratory Development (R&D). Signed on 2001-03-13. Completion date: 2001-12-31.
Z GROUP, INC (1003 E MOUNT HOPE AVE; small business) : $50,243 in 8 contractsfrom 2002 to 2006
Contracts for Food Services by Army Signed by year:2000: $0; 2001: $0; 2002: $0; 2003: $3,312; 2004: $31,674; 2005: $11,256; 2006: $4,001.
Biggest contracts:
$11,256 with Army for Food Services. Signed on 2005-07-14. Completion date: 2005-07-14.
$9,949, same as above.Signed on 2004-10-25. Completion date: 2004-10-14.
$9,684, same as above.Signed on 2004-11-05. Completion date: 2004-11-08.
$9,363, same as above.Signed on 2004-10-20. Completion date: 2004-10-06.
SMART OFFICE SYSTEMS LTD (2110 S WASHINGTON AVE; small business) : $43,791 in 4 contractsin 2004
$23,727 with Army for Office Furniture. Signed on 2004-07-19. Completion date: 2004-07-15.
$9,403 with Geological Survey for Office Furniture. Signed on 2004-03-01. Completion date: 2004-04-01.
$5,519 with Army for Office Furniture. Taking place in IL. Signed on 2004-03-30. Completion date: 2004-05-29.
$5,142 with Geological Survey for Office Furniture. Signed on 2004-03-18. Completion date: 2004-04-18.
FUTURE TRENDS MACHINING AND CO (2443 S RUNDLE AVE; small business) : $22,358 in 3 contractsin 2006
$10,472 with Defense Logistics Agency for Hardware, Commercial. Signed on 2006-06-11. Completion date: 2006-10-17.
$7,930, same as above.Signed on 2006-06-10. Completion date: 2006-10-16.
$3,956 with Defense Logistics Agency for Bushings, Rings, Shims, and Spacers. Signed on 2006-06-16. Completion date: 2006-09-14.
APCO, INC (5511 ENTERPRISE DR; small business)
$16,868 with Army for Hose, Pipe, Tube, Lubrication, and Railing Fittings. Signed on 2005-05-13. Completion date: 2006-12-31.
CUSTOM SIGNWORKS PLUS INC (3507 S CEDAR ST; small business) : $9,261 in 3 contractsfrom 2002 to 2006
$5,005 with Navy for Advertising Services. Signed on 2006-02-24. Completion date: 2006-03-17.
$3,900 with Army for Signs, Advertising Displays, and Identification Plates. Signed on 2002-05-08. Completion date: 2002-05-31.
$356 with Navy for Advertising Services. Signed on 2006-03-14. Completion date: 2006-03-17.
APPLAUSE INC (2519 S CEDAR ST; small business)
$8,590 with Army for Memorials: Cemeterial and Mortuary Equipment and Supplies. Signed on 2004-04-13. Completion date: 2004-05-17.
CADILLAC CLUB INC (1115 S WASHINGTON AVE; small business)
$4,480 with Army for Lodging - Hotel/Motel. Signed on 2005-05-06. Completion date: 2005-05-09.
Top industries in this zip code by the number of employees in 2005:
Health Care and Social Assistance: General Medical and Surgical Hospitals (over 1000 employees: 1 establishment)
Information: Data Processing, Hosting, and Related Services (500-999: 1, 100-249: 1)
Health Care and Social Assistance: Offices of Physicians (except Mental Health Specialists) (100-249: 1, 50-99: 1, 20-49: 4, 10-19: 7, 5-9: 11, 1-4: 14)
2002 - 2018 National Fire Incident Reporting System (NFIRS) incidents
Based on the data from the years 2002 - 2018 the average number of fires per year is 76. The highest number of fire incidents - 110 took place in 2016, and the least - 0 in 2008. The data has an increasing trend.
When looking into fire subcategories, the most reports belonged to: Structure Fires (49.5%), and Outside Fires (23.4%).
Fire incident types reported to NFIRS in Zip Code 48910


 Nearest zip codes: 48912, 48921, 48933, 48825, 48911, 48915.
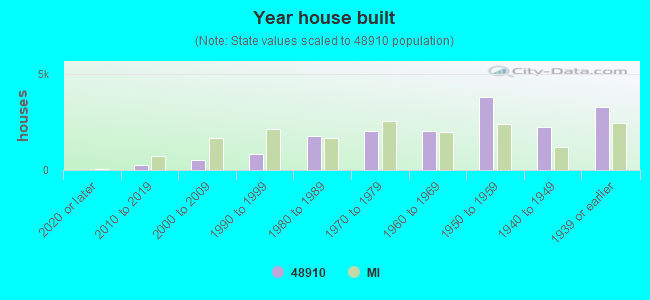


 Based on the data from the years 2002 - 2018 the average number of fires per year is 76. The highest number of fire incidents - 110 took place in 2016, and the least - 0 in 2008. The data has an increasing trend.
 When looking into fire subcategories, the most reports belonged to: Structure Fires (49.5%), and Outside Fires (23.4%).