Estimated zip code population in 2022: 23,721 Zip code population in 2010: 23,804 Zip code population in 2000: 23,918
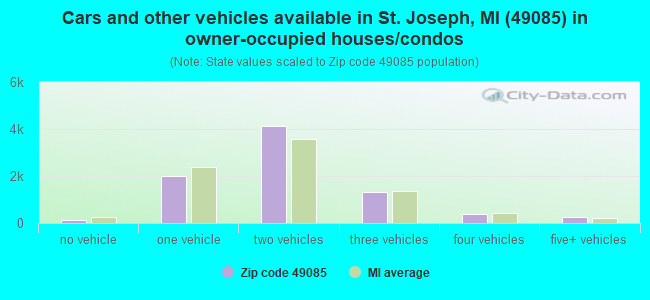
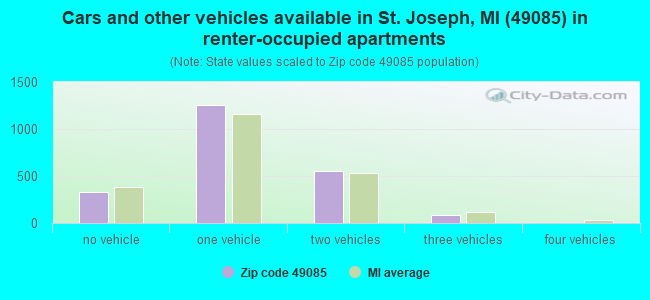
Houses and condos: 11,473 Renter-occupied apartments: 2,230
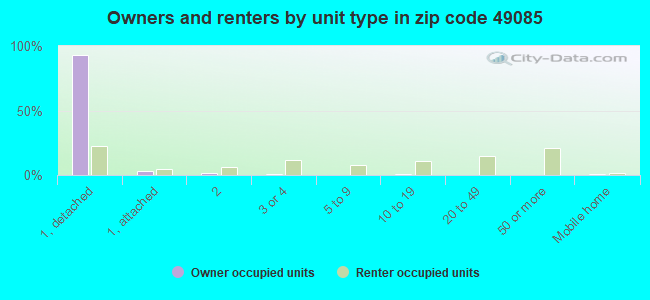
% of renters here:
21%
State:
27%
March 2022 cost of living index in zip code 49085: 82.2 (low, U.S. average is 100)
Land area: 23.5 sq. mi. Water area: 2.6 sq. mi.
Population density: 1,008 people per square mile
(low).
OSM Map
General Map
Google Map
MSN Map
OSM Map
General Map
Google Map
MSN Map
OSM Map
General Map
Google Map
MSN Map
OSM Map
General Map
Google Map
MSN Map
Please wait while loading the map...
Real estate property taxes paid for housing units in 2022:
This zip code:
1.2% ($3,413)
Michigan:
1.2% ($2,746)
Median real estate property taxes paid for housing units with mortgages in 2022: $3,522 (1.2%) Median real estate property taxes paid for housing units with no mortgage in 2022: $3,291 (1.1%)
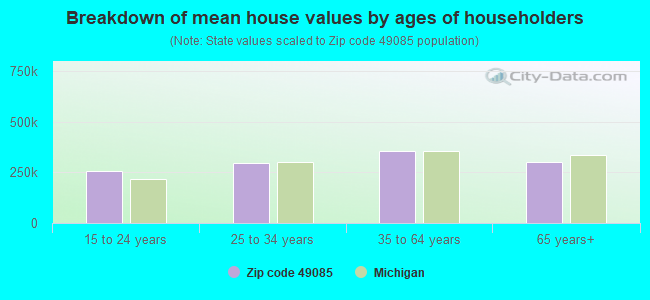
Estimated median house/condo value in 2022: $293,249
49085:
$293,249
Michigan:
$224,400
According to our research of Michigan and other state lists, there were 44 registered sex offenders living in 49085 zip code as of April 27, 2024. The ratio of all residents to sex offenders in zip code 49085 is 531 to 1. The ratio of registered sex offenders to all residents in this zip code is lower than the state average.
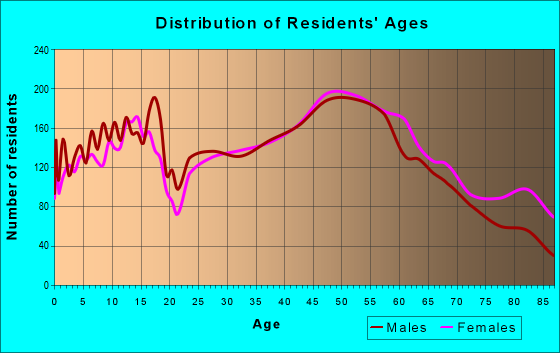
Median resident age:
This zip code:
45.6 years
Michigan median age:
40.3 years
Average household size:
This zip code:
2.2 people
Michigan:
2.4 people
Averages for the 2020 tax year for zip code 49085, filed in 2021:
Average Adjusted Gross Income (AGI) in 2020: $94,943 (Individual Income Tax Returns)
Here:
$94,943
State:
$68,945
Salary/wage: $82,818 (reported on 77.5% of returns)
Here:
$82,818
State:
$57,142
(% of AGI for various income ranges: 1033.9% for AGIs below $25k, 3335.5% for AGIs $25k-50k, 5998.3% for AGIs $50k-75k, 9063.6% for AGIs $75k-100k, 16822.9% for AGIs $100k-200k, 79577.0% for AGIs over 200k)
Taxable interest for individuals: $1,749 (reported on 42.6% of returns)
This zip code:
$1,749
Michigan:
$1,630
(% of AGI for various income ranges: 35.6% for AGIs below $25k, 31.5% for AGIs $25k-50k, 68.3% for AGIs $50k-75k, 112.3% for AGIs $75k-100k, 147.7% for AGIs $100k-200k, 1003.3% for AGIs over 200k)
Ordinary dividends: $9,993 (reported on 31.5% of returns)
Here:
$9,993
State:
$6,972
(% of AGI for various income ranges: 58.3% for AGIs below $25k, 82.6% for AGIs $25k-50k, 175.7% for AGIs $50k-75k, 314.2% for AGIs $75k-100k, 469.2% for AGIs $100k-200k, 6148.2% for AGIs over 200k)
Net capital gain/loss in AGI: +$16,451 (reported on 27.6% of returns)
Here:
+$16,451
State:
+$20,064
(% of AGI for various income ranges: 26.3% for AGIs below $25k, 55.5% for AGIs $25k-50k, 149.5% for AGIs $50k-75k, 317.2% for AGIs $75k-100k, 549.7% for AGIs $100k-200k, 10485.0% for AGIs over 200k)
Profit/loss from business: +$18,254 (reported on 14.9% of returns)
Here:
+$18,254
State:
+$11,172
(% of AGI for various income ranges: 86.0% for AGIs below $25k, 172.3% for AGIs $25k-50k, 214.1% for AGIs $50k-75k, 381.8% for AGIs $75k-100k, 643.5% for AGIs $100k-200k, 3422.0% for AGIs over 200k)
Taxable individual retirement arrangement distribution: $25,692 (reported on 15.9% of returns)
49085:
$25,692
Michigan:
$19,803
(% of AGI for various income ranges: 154.1% for AGIs below $25k, 249.5% for AGIs $25k-50k, 402.7% for AGIs $50k-75k, 869.0% for AGIs $75k-100k, 1240.3% for AGIs $100k-200k, 3185.5% for AGIs over 200k)
Self-employed (Keogh) retirement plans: $27,170 (reported on 0.8% of returns)
49085:
$27,170
Michigan:
$25,132
(% of AGI for various income ranges: 54.8% for AGIs $100k-200k, 472.2% for AGIs over 200k)
Total itemized deductions: $37,566 (reported on 9.4% of returns)
Here:
$37,566
State:
$34,117
(% of AGI for various income ranges: 58.2% for AGIs below $25k, 135.5% for AGIs $25k-50k, 220.8% for AGIs $50k-75k, 395.8% for AGIs $75k-100k, 761.9% for AGIs $100k-200k, 5727.0% for AGIs over 200k)
Charity contributions: $17,894 (reported on 7.9% of returns)
Here:
$17,894
State:
$13,548
(% of AGI for various income ranges: 6.2% for AGIs below $25k, 21.7% for AGIs $25k-50k, 43.2% for AGIs $50k-75k, 89.1% for AGIs $75k-100k, 249.7% for AGIs $100k-200k, 2973.0% for AGIs over 200k)
Taxes paid: $8,353 (reported on 9.4% of returns)
49085:
$8,353
State:
$7,972
(% of AGI for various income ranges: 10.3% for AGIs below $25k, 25.1% for AGIs $25k-50k, 61.0% for AGIs $50k-75k, 108.3% for AGIs $75k-100k, 216.0% for AGIs $100k-200k, 1059.5% for AGIs over 200k)
Earned income credit: $1,717 (reported on 6.7% of returns)
Here:
$1,717
State:
$2,251
(% of AGI for various income ranges: 39.2% for AGIs below $25k, 35.0% for AGIs $25k-50k)
Percentage of individuals using paid preparers for their 2020 taxes: 93.1%
Here:
93%
State:
93%
(% for various income ranges: 91.0% for AGIs below $25k, 93.6% for AGIs $25k-50k, 93.9% for AGIs $50k-75k, 93.5% for AGIs $75k-100k, 93.7% for AGIs $100k-200k, 95.7% for AGIs over 200k)
Averages for the 2012 tax year for zip code 49085, filed in 2013:
Average Adjusted Gross Income (AGI) in 2012: $77,739 (Individual Income Tax Returns)
Here:
$77,739
State:
$55,609
Salary/wage: $66,850 (reported on 78.7% of returns)
Here:
$66,850
State:
$46,782
(% of AGI for various income ranges: 65.3% for AGIs below $25k, 70.5% for AGIs $25k-50k, 73.8% for AGIs $50k-75k, 73.6% for AGIs $75k-100k, 76.7% for AGIs $100k-200k, 56.2% for AGIs over 200k)
Taxable interest for individuals: $1,628 (reported on 48.4% of returns)
This zip code:
$1,628
Michigan:
$1,491
(% of AGI for various income ranges: 2.5% for AGIs below $25k, 1.3% for AGIs $25k-50k, 0.9% for AGIs $50k-75k, 0.7% for AGIs $75k-100k, 0.7% for AGIs $100k-200k, 1.1% for AGIs over 200k)
Ordinary dividends: $6,344 (reported on 31.1% of returns)
Here:
$6,344
State:
$6,225
(% of AGI for various income ranges: 4.0% for AGIs below $25k, 2.2% for AGIs $25k-50k, 1.9% for AGIs $50k-75k, 1.6% for AGIs $75k-100k, 1.9% for AGIs $100k-200k, 3.4% for AGIs over 200k)
Net capital gain/loss in AGI: +$10,197 (reported on 24.5% of returns)
Here:
+$10,197
State:
+$9,326
(% of AGI for various income ranges: 0.4% for AGIs $25k-50k, 0.5% for AGIs $50k-75k, 1.0% for AGIs $75k-100k, 1.3% for AGIs $100k-200k, 7.5% for AGIs over 200k)
Profit/loss from business: +$18,184 (reported on 14.2% of returns)
Here:
+$18,184
State:
+$11,523
(% of AGI for various income ranges: 6.1% for AGIs below $25k, 3.5% for AGIs $25k-50k, 3.4% for AGIs $50k-75k, 2.7% for AGIs $75k-100k, 3.2% for AGIs $100k-200k, 3.1% for AGIs over 200k)
Taxable individual retirement arrangement distribution: $20,454 (reported on 17.1% of returns)
49085:
$20,454
Michigan:
$15,298
(% of AGI for various income ranges: 8.4% for AGIs below $25k, 6.1% for AGIs $25k-50k, 4.8% for AGIs $50k-75k, 5.5% for AGIs $75k-100k, 4.5% for AGIs $100k-200k, 3.1% for AGIs over 200k)
Self-employment retirement plans: $24,418 (reported on 0.9% of returns)
49085:
$24,418
Michigan:
$20,834
(% of AGI for various income ranges: 0.3% for AGIs $25k-50k, 0.3% for AGIs $100k-200k, 0.5% for AGIs over 200k)
Total itemized deductions: $23,724 (17% of AGI, reported on 39.7% of returns)
Here:
$23,724
State:
$21,628
Here:
16.6% of AGI
State:
18.4% of AGI
(% of AGI for various income ranges: 12.6% for AGIs below $25k, 11.5% for AGIs $25k-50k, 11.6% for AGIs $50k-75k, 12.1% for AGIs $75k-100k, 13.7% for AGIs $100k-200k, 11.1% for AGIs over 200k)
Charity contributions: $5,500 (reported on 33.7% of returns)
Here:
$5,500
State:
$4,225
(% of AGI for various income ranges: 1.6% for AGIs below $25k, 1.7% for AGIs $25k-50k, 1.8% for AGIs $50k-75k, 1.9% for AGIs $75k-100k, 2.4% for AGIs $100k-200k, 3.0% for AGIs over 200k)
Taxes paid: $9,609 (reported on 39.7% of returns)
49085:
$9,609
State:
$8,327
(% of AGI for various income ranges: 2.7% for AGIs below $25k, 3.0% for AGIs $25k-50k, 3.7% for AGIs $50k-75k, 4.3% for AGIs $75k-100k, 5.8% for AGIs $100k-200k, 5.6% for AGIs over 200k)
Earned income credit: $1,827 (reported on 8.8% of returns)
Here:
$1,827
State:
$2,306
(% of AGI for various income ranges: 3.3% for AGIs below $25k, 0.6% for AGIs $25k-50k)
Percentage of individuals using paid preparers for their 2012 taxes: 49.0%
Here:
49%
State:
57%
(% for various income ranges: 43.1% for AGIs below $25k, 48.4% for AGIs $25k-50k, 49.7% for AGIs $50k-75k, 49.2% for AGIs $75k-100k, 52.4% for AGIs $100k-200k, 77.8% for AGIs over 200k)
Averages for the 2004 tax year for zip code 49085, filed in 2005:
Average Adjusted Gross Income (AGI) in 2004: $59,280 (Individual Income Tax Returns)
Here:
$59,280
State:
$48,204
Salary/wage: $52,378 (reported on 79.9% of returns)
Here:
$52,378
State:
$42,791
(% of AGI for various income ranges: 103.1% for AGIs below $10k, 64.1% for AGIs $10k-25k, 73.3% for AGIs $25k-50k, 76.5% for AGIs $50k-75k, 81.2% for AGIs $75k-100k, 64.3% for AGIs over 100k)
Taxable interest for individuals: $1,935 (reported on 59.6% of returns)
This zip code:
$1,935
Michigan:
$1,725
(% of AGI for various income ranges: 10.4% for AGIs below $10k, 4.6% for AGIs $10k-25k, 2.4% for AGIs $25k-50k, 1.5% for AGIs $50k-75k, 1.2% for AGIs $75k-100k, 1.7% for AGIs over 100k)
Taxable dividends: $5,174 (reported on 37.0% of returns)
Here:
$5,174
State:
$3,420
(% of AGI for various income ranges: 8.6% for AGIs below $10k, 3.8% for AGIs $10k-25k, 2.1% for AGIs $25k-50k, 2.1% for AGIs $50k-75k, 1.4% for AGIs $75k-100k, 4.3% for AGIs over 100k)
Net capital gain/loss: +$9,559 (reported on 28.4% of returns)
Here:
+$9,559
State:
+$8,532
(% of AGI for various income ranges: -1.0% for AGIs below $10k, 0.8% for AGIs $10k-25k, 1.0% for AGIs $25k-50k, 1.1% for AGIs $50k-75k, 1.1% for AGIs $75k-100k, 8.3% for AGIs over 100k)
Profit/loss from business: +$17,331 (reported on 14.8% of returns)
Here:
+$17,331
State:
+$9,547
(% of AGI for various income ranges: -0.4% for AGIs below $10k, 5.2% for AGIs $10k-25k, 4.4% for AGIs $25k-50k, 4.1% for AGIs $50k-75k, 3.7% for AGIs $75k-100k, 4.6% for AGIs over 100k)
Profit/loss from farming: +$600 (reported on 0.5% of returns)
Here:
+$600
State:
-$4,492
(% of AGI for various income ranges: 1.1% for AGIs below $10k, 0.0% for AGIs $25k-50k, 0.0% for AGIs $75k-100k, -0.0% for AGIs over 100k)
IRA payment deduction: $3,160 (reported on 3.1% of returns)
49085:
$3,160
Michigan:
$2,875
(% of AGI for various income ranges: 0.5% for AGIs below $10k, 0.2% for AGIs $10k-25k, 0.3% for AGIs $25k-50k, 0.2% for AGIs $50k-75k, 0.2% for AGIs $75k-100k, 0.1% for AGIs over 100k)
Self-employed pension: $14,087 (reported on 1.3% of returns)
Here:
$14,087
Michigan:
$13,826
(% of AGI for various income ranges: 0.1% for AGIs $25k-50k, 0.1% for AGIs $50k-75k, 0.3% for AGIs $75k-100k, 0.4% for AGIs over 100k)
Total itemized deductions: $19,380 (19% of AGI, reported on 42.9% of returns)
Here:
$19,380
State:
$18,509
Here:
18.9% of AGI
State:
20.7% of AGI
(% of AGI for various income ranges: 21.7% for AGIs below $10k, 13.3% for AGIs $10k-25k, 13.6% for AGIs $25k-50k, 15.0% for AGIs $50k-75k, 15.7% for AGIs $75k-100k, 13.2% for AGIs over 100k)
Charity contributions deductions: $4,276 (4% of AGI, reported on 38.5% of returns)
Here:
$4,276
State:
$3,365
Here:
4.0% of AGI
State:
3.6% of AGI
(% of AGI for various income ranges: 1.5% for AGIs below $10k, 1.9% for AGIs $10k-25k, 2.0% for AGIs $25k-50k, 2.1% for AGIs $50k-75k, 2.7% for AGIs $75k-100k, 3.3% for AGIs over 100k)
Total tax: $10,374 (reported on 78.6% of returns)
49085:
$10,374
State:
$7,691
(% of AGI for various income ranges: 3.4% for AGIs below $10k, 4.6% for AGIs $10k-25k, 7.9% for AGIs $25k-50k, 9.3% for AGIs $50k-75k, 10.7% for AGIs $75k-100k, 19.0% for AGIs over 100k)
Earned income credit: $1,462 (reported on 6.9% of returns)
Here:
$1,462
State:
$1,737
Percentage of individuals using paid preparers for their 2004 taxes: 52.6%
Here:
53%
State:
60%
(% for various income ranges: 45.6% for AGIs below $10k, 53.0% for AGIs $10k-25k, 55.2% for AGIs $25k-50k, 53.3% for AGIs $50k-75k, 50.4% for AGIs $75k-100k, 60.2% for AGIs over 100k)
Likely homosexual households (counted as self-reported same-sex unmarried-partner households)
Lesbian couples: 0.0% of all households
Gay men: 0.2% of all households
Household received Food Stamps/SNAP in the past 12 months: 421 Household did not receive Food Stamps/SNAP in the past 12 months: 9,909
Women who had a birth in the past 12 months: 160 (121 now married, 40 unmarried) Women who did not have a birth in the past 12 months: 4,601 (2,437 now married, 2,149 unmarried)
Housing units in zip code 49085 with a mortgage: 4,917 (627 second mortgage, 26 home equity loan, 602 both second mortgage and home equity loan) Houses without a mortgage: 222
Median monthly owner costs for units with a mortgage: $1,607 Median monthly owner costs for units without a mortgage: $609
Residents with income below the poverty level in 2022:
This zip code:
4.1%
Whole state:
13.4%
Residents with income below 50% of the poverty level in 2022:
This zip code:
2.0%
Whole state:
6.9%
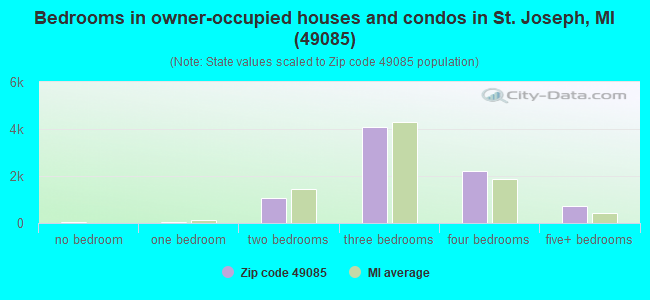
Median number of rooms in houses and condos:
Here:
7.0
State:
6.5
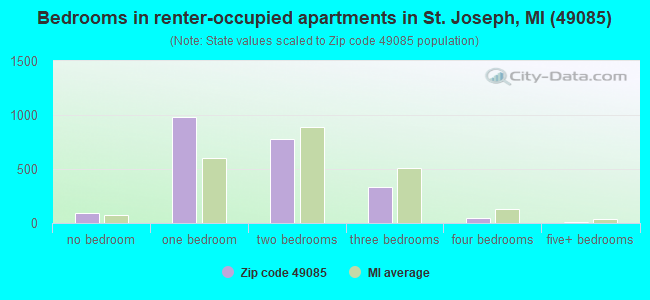
Median number of rooms in apartments:
Here:
3.6
State:
4.3
Notable locations in this zip code not listed on our city pages
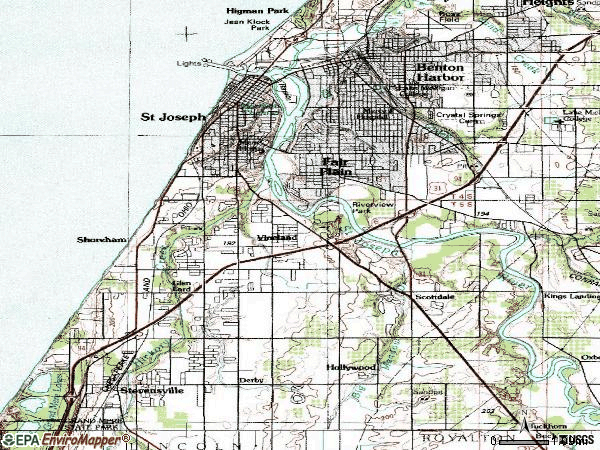
Notable locations in zip code 49085: Saint Joseph River Yacht Club (A), Speidel Marina (B), South Pierh Light (C), North Pierh Light (D), North Pier Inner Light (E), City of Benton Harbor Waterworks (F), Wolfs Island Marina (G), West Basin Marina (H), Whispering Willows Marina (I), Saint Joseph Station (J), The Oaks Golf Course (K), Royalton Township Volunteer Fire Department (L), Berrien County Courthouse (M), Saint Joseph City Library (N), Curious Kids' Museum (O), Heritage Museum and Cultural Center (P), Saint Joseph City Fire Department (Q), Saint Joseph Police Department (R), Saint Joseph Township Police Department (S), Saint Joseph Charter Township Fire Department Station 1 Headquarters (T). Display/hide their locations on the map
Churches in zip code 49085 include: Church of Nazarene (A), Grace Church (B), Lakeshore Christian Church (C), Scottdale United Methodist Church (D), New Life Baptist Church (E), Oakridge Baptist Church (F), Pilgrim Congregational Church (G), Saint Joseph Seventh-Day Adventist Church (H), Road to Life Church (I). Display/hide their locations on the map
Cemeteries: Riverview Cemetery (1), Lakeview Cemetery (2), Royalton Cemetery (3), Scottdale Cemetery (4), Brown School Cemetery (5), Resurrection Cemetery (6), Brant Cemetery (7). Display/hide their locations on the map
Parks in zip code 49085 include: Tiscornia Park (1), Saint Joseph City Park (2), Point Park (3), Milton Park (4), Botham Park (5), Whittlesey Park (6), Dickenson Park (7), Bicentennial Park (8), Old Saint Joseph Neighborhood Historical Marker (9). Display/hide their locations on the map
Tourist attractions (not listed on the city page) : Fort Miami Heritage Society (Museums; 708 Market Street) (1), Krasl Art Center (Cultural Attractions- Events- & Facilities; 707 Lake Boulevard) (2). Display/hide their approximate locations on the map
3,711 married couples with children.
572 single-parent households (156 men, 416 women).
91.5% of residents of 49085 zip code speak English at home.
1.2% of residents speak Spanish at home (76% very well, 10% well, 14% not well).
5.2% of residents speak other Indo-European language at home (90% very well, 8% well, 1% not well, 1% not at all).
2.4% of residents speak Asian or Pacific Island language at home (74% very well, 22% well, 4% not well).
0.1% of residents speak other language at home (86% very well, 14% well).
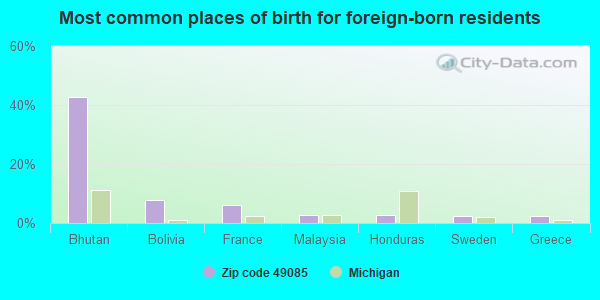
Foreign born population: 1,826 (7.7%) (47.5% of them are naturalized citizens)
Major facilities with environmental interests located in this zip code:
BOSCH AUTOMOTIVE GROUP (3737 RED ARROW HIGHWAY in SAINT JOSEPH, MI)
AIR MAJOR (AIRS/AFS) SUPERFUND NPL (Superfund database) (Integrated Compliance Information System) - ICIS-05-1998-0248, FORMAL ENFORCEMENT ACTION COMPLIANCE ACTIVITY (Tracking inspections of insecticide, fungicide, and rodenticide, and toxic substances) CRITERIA AND HAZARDOUS AIR POLLUTANT INVENTORY (Inventory of air pollution sources) National Pollutant Discharge Elimination System NON-MAJOR (Tracking pollutant discharge elimination systems) - permit Small Quantity Generators, between 100 kg and 1000 kg of hazardous waste/month (Resource Conservation and Recovery Act (tracking hazardous waste)) - notification TRI REPORTER (Tracking of toxic chemicals releasing facilities) Business SIC classification: GRAY AND DUCTILE IRON FOUNDRIES; MOTOR VEHICLE PARTS AND ACCESSORIES; REFUSE SYSTEMS Business NAICS classification: IRON FOUNDRIES.; IRON FOUNDRIES. Organizations: BOSCH CHASSIS DIVISION (CONTACT/OPERATOR)
, ROBERT BOSCH CORP-ST JOSEPH (CONTACT/OWNER)
, ROBERT BOSCH CORP, CHASSIS DIV (CONTACT/OWNER)
Alternative names: ALLIED-SIGNAL, INC., BENDIX CORP./ALLIED AUTOMOTIVE, BENDIX CORP HYDRAULICS, BOSCH BRAKING SYS., ROBERT BOSCH CORP. CHASSIS DIV., ROBERT BOSCH BRAKING SYSTEMS
AUTO SPECIALTIES MANUFACTURING (643 GRAVES ST in SAINT JOSEPH, MI)
(Integrated Compliance Information System) - ICIS-05-1985-0114, FORMAL ENFORCEMENT ACTION COMPLIANCE ACTIVITY (Tracking inspections of insecticide, fungicide, and rodenticide, and toxic substances) CRITERIA AND HAZARDOUS AIR POLLUTANT INVENTORY (Inventory of air pollution sources) (Resource Conservation and Recovery Act (tracking hazardous waste)) TRI REPORTER (Tracking of toxic chemicals releasing facilities) Business SIC classification: LAWN AND GARDEN TRACTORS AND HOME LAWN AND GARDEN EQUIPMENT; CONSTRUCTION MACHINERY AND EQUIPMENT; GENERAL INDUSTRIAL MACHINERY AND EQUIPMENT; AIRCRAFT PARTS AND AUXILIARY EQUIPMENT; REFUSE SYSTEMS Business NAICS classification: SOLID WASTE LANDFILL. Alternative names: AUTO SPECIALITIES CO AUSCO
BENTON HARBOR-ST JOSEPH WWTP (269 ANCHORS WAY in SAINT JOSEPH, MI)
National Pollutant Discharge Elimination System MAJOR (Tracking pollutant discharge elimination systems) - permit National Pollutant Discharge Elimination System NON-MAJOR (Tracking pollutant discharge elimination systems) - permit (Resource Conservation and Recovery Act (tracking hazardous waste)) Business SIC classification: SEWERAGE SYSTEMS Organizations: TOWN 3S (CONTACT/OPERATOR)
, BENTON HARBOR-ST.JOSEPH WWTP (CONTACT/OWNER)
Alternative names: BENTON HARBOR SAINT JOSEPH JOINT WWTP, BENTON HARBOR-ST JOSEPH SEWAGE DSPL PLT
MI DEPT/TRANSPORTATION BRIDGE (M-63 OVER ST JOSEPH RIVER in SAINT JOSEPH, MI)
(Resource Conservation and Recovery Act (tracking hazardous waste)) Organizations: MICH DEPT OF TRANSPORTATION (CONTACT/OPERATOR)
Alternative names: MIDOT BRIDGE M-63 OVER ST JOSEPH RIVER
GREAT LAKES EYE CARE PC (2848 NILES in SAINT JOSEPH, MI)
(Resource Conservation and Recovery Act (tracking hazardous waste)) Organizations: J & D REALTY CORP (CONTACT/OWNER)
MI DEPT/TRANSPORTATION BRIDGE B05-11013 (I-94 BL OVER ST JOSEPH RIVER in SAINT JOSEPH, MI)
(Resource Conservation and Recovery Act (tracking hazardous waste)) Organizations: MICH DEPT OF TRANSPORTATION (CONTACT/OPERATOR)
Alternative names: MIDOT BRIDGE I-94/BL OVER ST JOSEPH RIV
Housing units lacking complete plumbing facilities: 1.4% Housing units lacking complete kitchen facilities: 1.8%
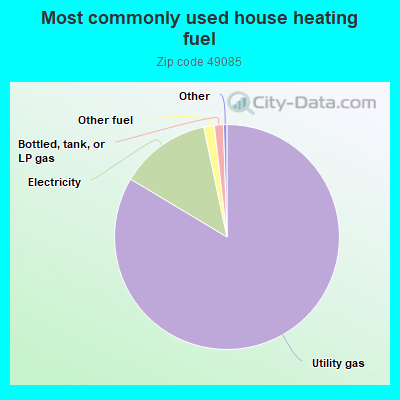
83.7%Utility gas
13.1%Electricity
1.5%Other fuel
1.3%Bottled, tank, or LP gas
Population in 1990: 22,984. Population change in the 1990s: +934 (+4.1%).
Place of birth for U.S.-born residents:
This state: 14,442
Northeast: 898
Midwest: 4,720
South: 1,048
West: 761
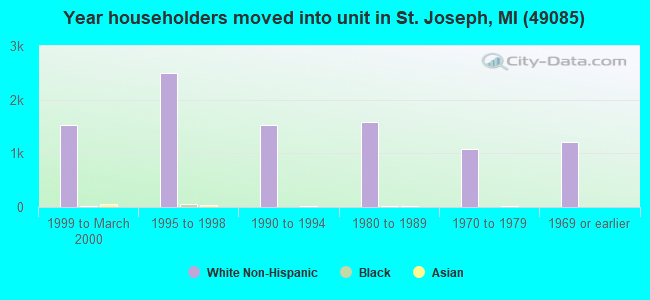
59% of the 49085 zip code residents lived in the same house 5 years ago. Out of people who lived in different houses, 62% lived in this county. Out of people who lived in different counties, 50% lived in Michigan.
88% of the 49085 zip code residents lived in the same house 1 year ago. Out of people who lived in different houses, 59% moved from this county. Out of people who lived in different houses, 14% moved from different county within same state. Out of people who lived in different houses, 21% moved from different state. Out of people who lived in different houses, 6% moved from abroad.
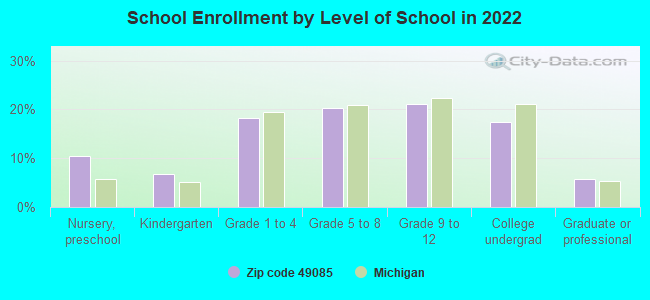
Private vs. public school enrollment:
Students in private schools in grades 1 to 8 (elementary and middle school): 260
Here:
14.6%
Michigan:
12.4%
Students in private schools in grades 9 to 12 (high school): 67
Here:
6.9%
Michigan:
9.8%
Students in private undergraduate colleges: 68
Here:
8.4%
Michigan:
14.9%
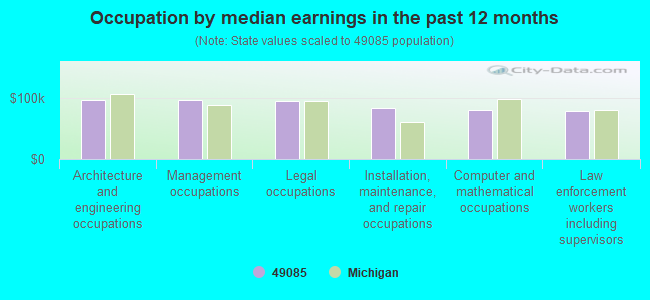
Occupation by median earnings in the past 12 months ($)
96,628Architecture and engineering occupations
96,463Management occupations
95,486Legal occupations
83,446Installation, maintenance, and repair occupations
81,232Computer and mathematical occupations
79,408Law enforcement workers including supervisors
Companies with federal contracts located in this zip code (SAINT JOSEPH, MI):
GENEGO, INC (500 RENAISSANCE DR; small business) : $527,697 in 9 contractsfrom 2005 to 2006
Contracts for Other Research and Development -- Basic Research (R&D), by Air Force, National Institutes of Health Signed by year:2000: $0; 2001: $0; 2002: $0; 2003: $0; 2004: $0; 2005: $128,697; 2006: $399,000.
Biggest contracts:
$250,000 with Air Force for Other Research and Development -- Basic Research (R&D). Signed on 2006-04-21. Completion date: 2008-04-21.
$125,000, same as above.Signed on 2006-06-23. Completion date: 2008-04-21.
$99,897, same as above.Signed on 2005-04-29. Completion date: 2006-01-31.
$18,000 with National Institutes of Health for . Taking place in MD. Signed on 2005-12-15. Effective on 2005-12-14. Completion date: 2006-10-04.
ALL CITIES OCCUPATIONAL & ENVI (3333 S STATE ST; small business) : $81,745 in 7 contractsfrom 2005 to 2006
Contracts for Physical Medicine and Rehabilitation Services by Army Signed by year:2000: $0; 2001: $0; 2002: $0; 2003: $0; 2004: $0; 2005: $3,787; 2006: $77,958.
Biggest contracts:
$25,448 with Army for Physical Medicine and Rehabilitation Services. Signed on 2006-03-13. Completion date: 2006-01-31.
$16,988, same as above.Signed on 2006-03-13. Completion date: 2005-11-22.
$12,562, same as above.Signed on 2006-06-26. Completion date: 2006-03-30.
$9,249, same as above.Signed on 2006-06-26. Completion date: 2006-05-30.
KAMS LIMITED (717 ST JOSEPH DR STE S270; small business) : $49,228 in 12 contractsfrom 2005 to 2006
Contracts for Connectors, Electrical, Relays and Solenoids, Indoor and Outdoor Electric Lighting Fixtures, Optoelectronic Devices and Associated Hardware, and moreby Defense Logistics Agency Signed by year:2000: $0; 2001: $0; 2002: $0; 2003: $0; 2004: $0; 2005: $5,366; 2006: $43,862.
Biggest contracts:
$5,786 with Defense Logistics Agency for Connectors, Electrical. Signed on 2006-02-15. Completion date: 2006-07-05.
$5,534 with Defense Logistics Agency for Relays and Solenoids. Taking place in WI. Signed on 2006-04-28. Completion date: 2006-09-09.
$5,460, same as above.Signed on 2006-03-28. Completion date: 2006-08-09.
$5,453 with Defense Logistics Agency for Relays and Solenoids. Taking place in CT. Signed on 2006-05-30. Completion date: 2006-10-07.
STEELE SUPPLY COMPANY (3413 HILL ST; small business) : $9,539 in 2 contractsin 2004
$7,167 with Army for Medical and Surgical Instruments, Equipment, and Supplies. Signed on 2004-02-05. Completion date: 2004-02-10.
$2,372, same as above.Signed on 2004-11-15. Completion date: 2004-11-17.
UNITED CONTAINER CO (233 HAWTHORNE AVE; small business)
$3,600 with Army for Household and Commercial Utility Containers. Taking place in KS. Signed on 2003-08-21. Completion date: 2003-08-26.
DEWITT COMPUTER TECHNOLOGIES, (1826 HILLTOP RD; small business) : $3,561 in 4 contractsfrom 2004 to 2006
$3,028 with Army for Batteries, Nonrechargeable. Signed on 2005-09-16. Completion date: 2005-10-16.
$385 with Minerals Management Service for Batteries, Nonrechargeable. Taking place in DC. Signed on 2004-03-26. Completion date: 2004-04-09.
$91 with Navy for Batteries, Nonrechargeable. Signed on 2004-07-19. Completion date: 2004-08-02.
$57 with Department of Veterans Affairs for Medical and Surgical Instruments, Equipment, and Supplies. Signed on 2006-04-25. Completion date: 2006-04-25.
ZWARTEC (323 W GLENLORD RD; small business) : $4 in 2 contractsin 2006
$4 with Defense Logistics Agency for Signs, Advertising Displays, and Identification Plates. Taking place in MA. Signed on 2006-03-08. Completion date: 2006-03-08.
$0, same as above.Signed on 2006-03-08. Completion date: 2006-03-08.
Top industries in this zip code by the number of employees in 2005:
Health Care and Social Assistance: General Medical and Surgical Hospitals (over 1000 employees: 1 establishment)
Management of Companies and Enterprises: Corporate, Subsidiary, and Regional Managing Offices (500-999: 1, 250-499: 1, 50-99: 1, 20-49: 1, 10-19: 2, 5-9: 1, 1-4: 3)
Health Care and Social Assistance: Offices of Physicians (except Mental Health Specialists) (250-499: 1, 50-99: 2, 20-49: 9, 10-19: 11, 5-9: 10, 1-4: 20)
Administrative and Support and Waste Management and Remediation Services: Temporary Help Services (250-499: 1, 100-249: 2, 50-99: 3, 20-49: 2, 1-4: 1)
2002 - 2018 National Fire Incident Reporting System (NFIRS) incidents
Based on the data from the years 2002 - 2018 the average number of fire incidents per year is 47. The highest number of fire incidents - 81 took place in 2003, and the least - 26 in 2010. The data has a declining trend.
When looking into fire subcategories, the most incidents belonged to: Structure Fires (51.3%), and Outside Fires (24.1%).
Fire incident types reported to NFIRS in Zip Code 49085


+$600
-$4,492
(% of AGI for various income ranges: 1.1% for AGIs below $10k, 0.0% for AGIs $25k-50k, 0.0% for AGIs $75k-100k, -0.0% for AGIs over 100k) Nearest zip codes: 49127, 49126, 49022, 49101, 49104, 49103.
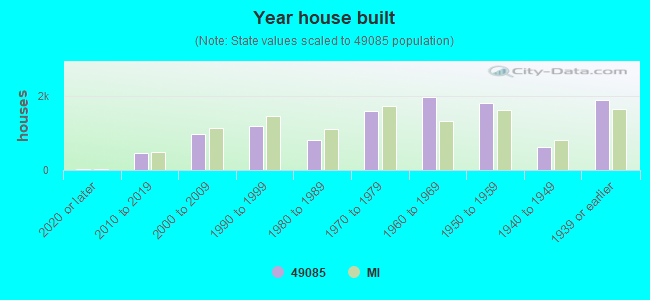


 Based on the data from the years 2002 - 2018 the average number of fire incidents per year is 47. The highest number of fire incidents - 81 took place in 2003, and the least - 26 in 2010. The data has a declining trend.
 When looking into fire subcategories, the most incidents belonged to: Structure Fires (51.3%), and Outside Fires (24.1%).