Estimated zip code population in 2022: 10,509 Zip code population in 2010: 10,382 Zip code population in 2000: 10,669
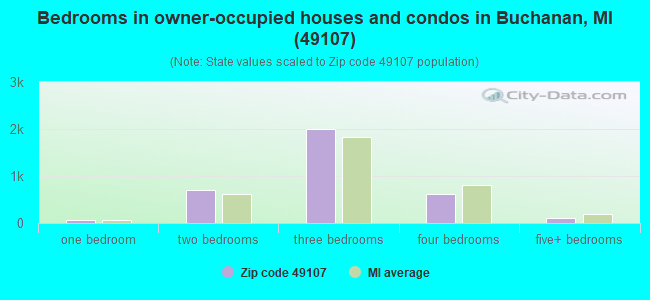
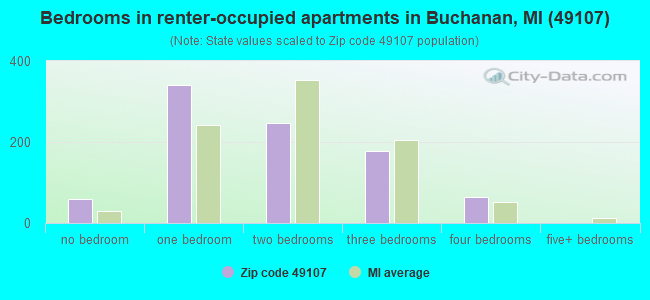
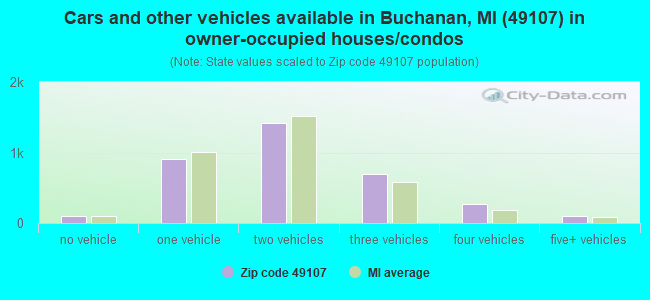
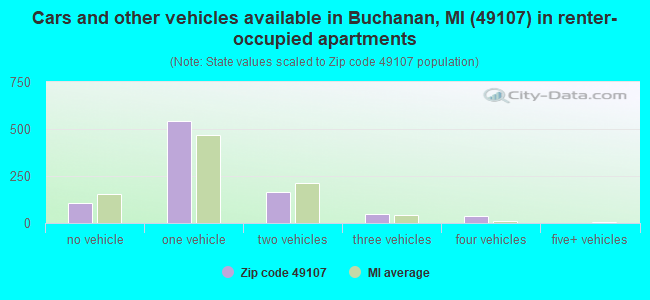
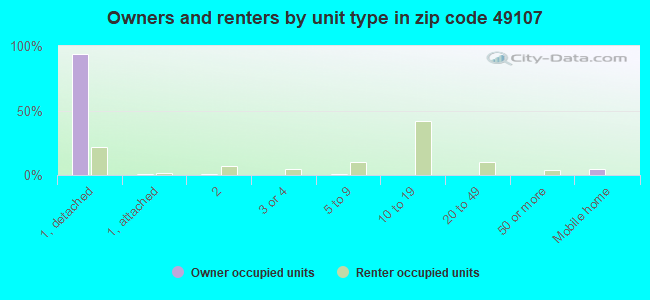
Houses and condos: 5,178 Renter-occupied apartments: 895
% of renters here:
20%
State:
27%
March 2022 cost of living index in zip code 49107: 81.5 (low, U.S. average is 100)
Land area: 65.4 sq. mi. Water area: 1.5 sq. mi.
Population density: 161 people per square mile
(very low).
OSM Map
General Map
Google Map
MSN Map
OSM Map
General Map
Google Map
MSN Map
OSM Map
General Map
Google Map
MSN Map
OSM Map
General Map
Google Map
MSN Map
Please wait while loading the map...
Real estate property taxes paid for housing units in 2022:
This zip code:
1.0% ($1,905)
Michigan:
1.2% ($2,746)
Median real estate property taxes paid for housing units with mortgages in 2022: $1,979 (1.1%) Median real estate property taxes paid for housing units with no mortgage in 2022: $1,807 (0.9%)
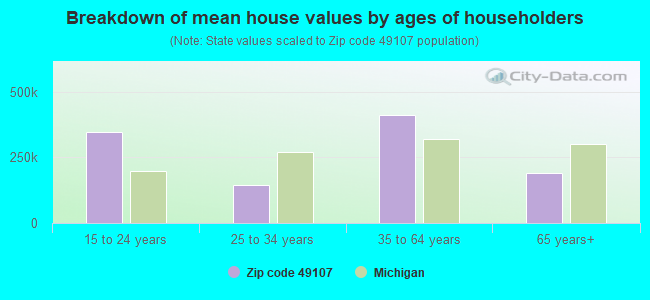
Estimated median house/condo value in 2022: $186,572
49107:
$186,572
Michigan:
$224,400
According to our research of Michigan and other state lists, there were 33 registered sex offenders living in 49107 zip code as of April 27, 2024. The ratio of all residents to sex offenders in zip code 49107 is 311 to 1. The ratio of registered sex offenders to all residents in this zip code is near the state average.
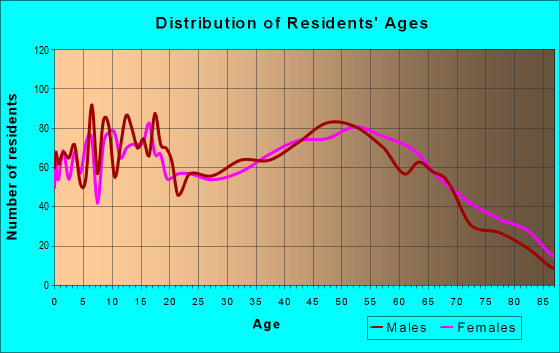
Median resident age:
This zip code:
45.9 years
Michigan median age:
40.3 years
Average household size:
This zip code:
2.4 people
Michigan:
2.4 people
Averages for the 2020 tax year for zip code 49107, filed in 2021:
Average Adjusted Gross Income (AGI) in 2020: $55,785 (Individual Income Tax Returns)
Here:
$55,785
State:
$68,945
Salary/wage: $48,864 (reported on 79.7% of returns)
Here:
$48,864
State:
$57,142
(% of AGI for various income ranges: 1053.3% for AGIs below $25k, 3375.6% for AGIs $25k-50k, 6193.7% for AGIs $50k-75k, 9041.3% for AGIs $75k-100k, 16317.4% for AGIs $100k-200k, 50042.5% for AGIs over 200k)
Taxable interest for individuals: $1,015 (reported on 27.5% of returns)
This zip code:
$1,015
Michigan:
$1,630
(% of AGI for various income ranges: 18.4% for AGIs below $25k, 16.1% for AGIs $25k-50k, 31.3% for AGIs $50k-75k, 42.3% for AGIs $75k-100k, 81.8% for AGIs $100k-200k, 922.5% for AGIs over 200k)
Ordinary dividends: $4,374 (reported on 15.2% of returns)
Here:
$4,374
State:
$6,972
(% of AGI for various income ranges: 21.3% for AGIs below $25k, 30.1% for AGIs $25k-50k, 75.8% for AGIs $50k-75k, 123.9% for AGIs $75k-100k, 244.4% for AGIs $100k-200k, 2440.0% for AGIs over 200k)
Net capital gain/loss in AGI: +$11,987 (reported on 13.3% of returns)
Here:
+$11,987
State:
+$20,064
(% of AGI for various income ranges: 15.5% for AGIs below $25k, 32.7% for AGIs $25k-50k, 47.1% for AGIs $50k-75k, 132.3% for AGIs $75k-100k, 465.6% for AGIs $100k-200k, 11965.0% for AGIs over 200k)
Profit/loss from business: +$9,525 (reported on 11.8% of returns)
Here:
+$9,525
State:
+$11,172
(% of AGI for various income ranges: 86.8% for AGIs below $25k, 113.9% for AGIs $25k-50k, 156.7% for AGIs $50k-75k, 176.1% for AGIs $75k-100k, 520.0% for AGIs $100k-200k)
Taxable individual retirement arrangement distribution: $15,519 (reported on 11.4% of returns)
49107:
$15,519
Michigan:
$19,803
(% of AGI for various income ranges: 99.8% for AGIs below $25k, 102.0% for AGIs $25k-50k, 160.0% for AGIs $50k-75k, 430.6% for AGIs $75k-100k, 728.5% for AGIs $100k-200k, 3790.0% for AGIs over 200k)
Total itemized deductions: $30,548 (reported on 4.4% of returns)
Here:
$30,548
State:
$34,117
(% of AGI for various income ranges: 64.5% for AGIs below $25k, 123.1% for AGIs $50k-75k, 171.9% for AGIs $75k-100k, 576.2% for AGIs $100k-200k, 6417.5% for AGIs over 200k)
Charity contributions: $13,240 (reported on 3.2% of returns)
Here:
$13,240
State:
$13,548
(% of AGI for various income ranges: 59.2% for AGIs $50k-75k, 204.4% for AGIs $100k-200k, 2457.5% for AGIs over 200k)
Taxes paid: $6,781 (reported on 4.4% of returns)
49107:
$6,781
State:
$7,972
(% of AGI for various income ranges: 11.0% for AGIs below $25k, 26.3% for AGIs $50k-75k, 53.9% for AGIs $75k-100k, 159.4% for AGIs $100k-200k, 1140.0% for AGIs over 200k)
Earned income credit: $2,182 (reported on 15.6% of returns)
Here:
$2,182
State:
$2,251
(% of AGI for various income ranges: 80.5% for AGIs below $25k, 65.2% for AGIs $25k-50k, 2.1% for AGIs $50k-75k)
Percentage of individuals using paid preparers for their 2020 taxes: 93.4%
Here:
93%
State:
93%
(% for various income ranges: 92.4% for AGIs below $25k, 94.8% for AGIs $25k-50k, 91.4% for AGIs $50k-75k, 93.2% for AGIs $75k-100k, 94.6% for AGIs $100k-200k, 100.0% for AGIs over 200k)
Averages for the 2012 tax year for zip code 49107, filed in 2013:
Average Adjusted Gross Income (AGI) in 2012: $45,344 (Individual Income Tax Returns)
Here:
$45,344
State:
$55,609
Salary/wage: $39,812 (reported on 82.3% of returns)
Here:
$39,812
State:
$46,782
(% of AGI for various income ranges: 70.7% for AGIs below $25k, 78.7% for AGIs $25k-50k, 79.9% for AGIs $50k-75k, 77.9% for AGIs $75k-100k, 75.7% for AGIs $100k-200k, 35.1% for AGIs over 200k)
Taxable interest for individuals: $999 (reported on 32.8% of returns)
This zip code:
$999
Michigan:
$1,491
(% of AGI for various income ranges: 1.5% for AGIs below $25k, 0.6% for AGIs $25k-50k, 0.5% for AGIs $50k-75k, 0.6% for AGIs $75k-100k, 0.7% for AGIs $100k-200k, 0.9% for AGIs over 200k)
Ordinary dividends: $4,312 (reported on 16.2% of returns)
Here:
$4,312
State:
$6,225
(% of AGI for various income ranges: 1.4% for AGIs below $25k, 0.7% for AGIs $25k-50k, 1.1% for AGIs $50k-75k, 1.1% for AGIs $75k-100k, 1.7% for AGIs $100k-200k, 4.4% for AGIs over 200k)
Net capital gain/loss in AGI: +$3,280 (reported on 11.9% of returns)
Here:
+$3,280
State:
+$9,326
(% of AGI for various income ranges: 0.2% for AGIs $50k-75k, 0.3% for AGIs $75k-100k, 1.2% for AGIs $100k-200k, 4.7% for AGIs over 200k)
Profit/loss from business: +$8,051 (reported on 13.6% of returns)
Here:
+$8,051
State:
+$11,523
(% of AGI for various income ranges: 5.1% for AGIs below $25k, 3.0% for AGIs $25k-50k, 2.0% for AGIs $50k-75k, 2.7% for AGIs $75k-100k, 1.8% for AGIs $100k-200k)
Taxable individual retirement arrangement distribution: $11,562 (reported on 11.9% of returns)
49107:
$11,562
Michigan:
$15,298
(% of AGI for various income ranges: 3.9% for AGIs below $25k, 3.0% for AGIs $25k-50k, 2.7% for AGIs $50k-75k, 2.9% for AGIs $75k-100k, 4.5% for AGIs $100k-200k)
Total itemized deductions: $18,382 (20% of AGI, reported on 23.5% of returns)
Here:
$18,382
State:
$21,628
Here:
20.4% of AGI
State:
18.4% of AGI
(% of AGI for various income ranges: 6.3% for AGIs below $25k, 7.3% for AGIs $25k-50k, 8.9% for AGIs $50k-75k, 10.3% for AGIs $75k-100k, 11.7% for AGIs $100k-200k, 12.2% for AGIs over 200k)
Charity contributions: $3,531 (reported on 17.9% of returns)
Here:
$3,531
State:
$4,225
(% of AGI for various income ranges: 0.6% for AGIs below $25k, 0.9% for AGIs $25k-50k, 1.4% for AGIs $50k-75k, 1.6% for AGIs $75k-100k, 2.2% for AGIs $100k-200k, 1.2% for AGIs over 200k)
Taxes paid: $6,160 (reported on 23.5% of returns)
49107:
$6,160
State:
$8,327
(% of AGI for various income ranges: 1.0% for AGIs below $25k, 1.9% for AGIs $25k-50k, 2.6% for AGIs $50k-75k, 3.6% for AGIs $75k-100k, 4.6% for AGIs $100k-200k, 5.4% for AGIs over 200k)
Earned income credit: $2,255 (reported on 19.0% of returns)
Here:
$2,255
State:
$2,306
(% of AGI for various income ranges: 6.2% for AGIs below $25k, 1.2% for AGIs $25k-50k)
Percentage of individuals using paid preparers for their 2012 taxes: 50.2%
Here:
50%
State:
57%
(% for various income ranges: 44.7% for AGIs below $25k, 51.3% for AGIs $25k-50k, 53.8% for AGIs $50k-75k, 53.7% for AGIs $75k-100k, 62.9% for AGIs $100k-200k, 80.0% for AGIs over 200k)
Averages for the 2004 tax year for zip code 49107, filed in 2005:
Average Adjusted Gross Income (AGI) in 2004: $37,527 (Individual Income Tax Returns)
Here:
$37,527
State:
$48,204
Salary/wage: $35,382 (reported on 84.2% of returns)
Here:
$35,382
State:
$42,791
(% of AGI for various income ranges: 109.8% for AGIs below $10k, 73.9% for AGIs $10k-25k, 83.9% for AGIs $25k-50k, 84.0% for AGIs $50k-75k, 84.5% for AGIs $75k-100k, 64.5% for AGIs over 100k)
Taxable interest for individuals: $1,316 (reported on 45.5% of returns)
This zip code:
$1,316
Michigan:
$1,725
(% of AGI for various income ranges: 8.1% for AGIs below $10k, 2.7% for AGIs $10k-25k, 1.1% for AGIs $25k-50k, 1.0% for AGIs $50k-75k, 1.3% for AGIs $75k-100k, 1.7% for AGIs over 100k)
Taxable dividends: $2,328 (reported on 18.8% of returns)
Here:
$2,328
State:
$3,420
(% of AGI for various income ranges: 3.6% for AGIs below $10k, 1.4% for AGIs $10k-25k, 0.7% for AGIs $25k-50k, 0.4% for AGIs $50k-75k, 1.0% for AGIs $75k-100k, 2.2% for AGIs over 100k)
Net capital gain/loss: +$6,393 (reported on 13.7% of returns)
Here:
+$6,393
State:
+$8,532
(% of AGI for various income ranges: -1.2% for AGIs below $10k, 0.0% for AGIs $10k-25k, 0.2% for AGIs $25k-50k, 1.1% for AGIs $50k-75k, 0.8% for AGIs $75k-100k, 9.2% for AGIs over 100k)
Profit/loss from business: +$8,381 (reported on 14.5% of returns)
Here:
+$8,381
State:
+$9,547
(% of AGI for various income ranges: 6.2% for AGIs below $10k, 5.8% for AGIs $10k-25k, 2.7% for AGIs $25k-50k, 2.7% for AGIs $50k-75k, 1.6% for AGIs $75k-100k, 4.0% for AGIs over 100k)
IRA payment deduction: $3,061 (reported on 2.5% of returns)
49107:
$3,061
Michigan:
$2,875
(% of AGI for various income ranges: 0.3% for AGIs $10k-25k, 0.3% for AGIs $25k-50k, 0.3% for AGIs $50k-75k, 0.1% for AGIs over 100k)
Self-employed pension: $2,917 (reported on 0.3% of returns)
Here:
$2,917
Michigan:
$13,826
Total itemized deductions: $14,988 (22% of AGI, reported on 25.7% of returns)
Here:
$14,988
State:
$18,509
Here:
21.6% of AGI
State:
20.7% of AGI
(% of AGI for various income ranges: 9.1% for AGIs below $10k, 6.6% for AGIs $10k-25k, 8.6% for AGIs $25k-50k, 11.4% for AGIs $50k-75k, 11.7% for AGIs $75k-100k, 12.0% for AGIs over 100k)
Charity contributions deductions: $3,045 (4% of AGI, reported on 20.8% of returns)
Here:
$3,045
State:
$3,365
Here:
4.1% of AGI
State:
3.6% of AGI
(% of AGI for various income ranges: 0.8% for AGIs below $10k, 1.1% for AGIs $10k-25k, 0.9% for AGIs $25k-50k, 1.9% for AGIs $50k-75k, 1.8% for AGIs $75k-100k, 2.8% for AGIs over 100k)
Total tax: $4,848 (reported on 72.6% of returns)
49107:
$4,848
State:
$7,691
(% of AGI for various income ranges: 2.4% for AGIs below $10k, 4.2% for AGIs $10k-25k, 6.6% for AGIs $25k-50k, 8.4% for AGIs $50k-75k, 10.4% for AGIs $75k-100k, 16.6% for AGIs over 100k)
Earned income credit: $1,699 (reported on 16.2% of returns)
Here:
$1,699
State:
$1,737
Percentage of individuals using paid preparers for their 2004 taxes: 56.0%
Here:
56%
State:
60%
(% for various income ranges: 51.9% for AGIs below $10k, 58.4% for AGIs $10k-25k, 55.3% for AGIs $25k-50k, 55.8% for AGIs $50k-75k, 58.2% for AGIs $75k-100k, 62.0% for AGIs over 100k)
Likely homosexual households (counted as self-reported same-sex unmarried-partner households)
Lesbian couples: 0.1% of all households
Gay men: 0.0% of all households
Household received Food Stamps/SNAP in the past 12 months: 441 Household did not receive Food Stamps/SNAP in the past 12 months: 3,925
Women who had a birth in the past 12 months: 63 (64 now married, 0 unmarried) Women who did not have a birth in the past 12 months: 2,266 (908 now married, 1,358 unmarried)
Housing units in zip code 49107 with a mortgage: 1,985 (207 second mortgage, 12 home equity loan, 179 both second mortgage and home equity loan) Houses without a mortgage: 156
Median monthly owner costs for units with a mortgage: $1,185 Median monthly owner costs for units without a mortgage: $496
Residents with income below the poverty level in 2022:
This zip code:
7.4%
Whole state:
13.4%
Residents with income below 50% of the poverty level in 2022:
This zip code:
4.0%
Whole state:
6.9%
Median number of rooms in houses and condos:
Here:
6.4
State:
6.5
Median number of rooms in apartments:
Here:
3.8
State:
4.3
Notable locations in this zip code not listed on our city pages
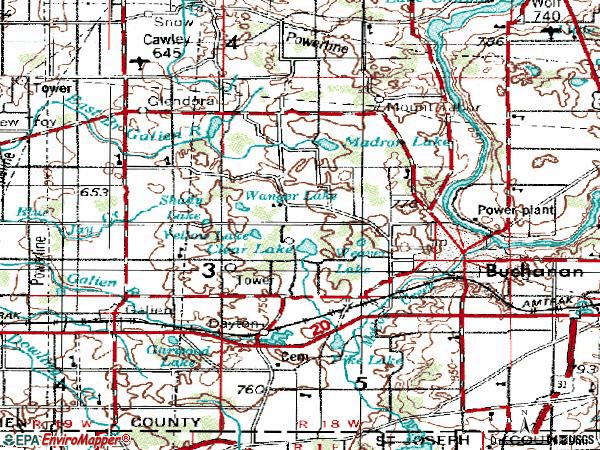
Notable locations in zip code 49107: Camp Madron (A), Dayton Station (B), East Clear Lake Campground (C), Riverside Church Camp (D), Redbud Trail Church Camp (E), Brookwood Golf Course (F), Orchard Hill Country Club (G), Bertrand Township Fire Department Station 1 Headquarters (H), Buchanan Township Fire Department (I), Buchanan City Hall (J), Buchanan City Fire Department (K), Buchanan Police Department (L), Buchanan District Library (M). Display/hide their locations on the map
Churches in zip code 49107 include: Oronoko Church (A), Faith Victory Fellowship (B), Trinity Lutheran Church (C), Hills Corner Bible Baptist Church (D), Jehovah's Witnesses (E), Lively Stone Community Church (F), Bethel Apostolic Tabernacle Church (G), New Good Hope Baptist Church (H), Seventh-Day Adventist Church (I). Display/hide their locations on the map
Cemeteries: Glendora Cemetery (1), Oak Ridge Cemetery (2), Bakertown Cemetery (3), Benton Cemetery (4), McGowan Cemetery (5), Sherwood Cemetery (6), Stevens Farm Cemetery (7). Display/hide their locations on the map
Lakes: Burrus Lake (A), Clear Lake (B), Dayton Lake (C), Indian Lake (D), Judy Lake (E), Madron Lake (F), Moon Lake (G), Mud Lake (H). Display/hide their locations on the map
Parks in zip code 49107 include: Weaver Park (1), Moccasin Bluff Historical Marker (2), Mud Lake Bog (3), McCoy Creek Recreation Area (4), Memorial Field (5), Smith Park (6), Samson Park (7), McCoy Pond Park (8), Firehouse Park (9). Display/hide their locations on the map
1,197 married couples with children.
384 single-parent households (107 men, 277 women).
98.3% of residents of 49107 zip code speak English at home.
1.1% of residents speak Spanish at home (44% very well, 54% not well, 3% not at all).
0.3% of residents speak other Indo-European language at home (79% very well, 12% well, 9% not at all).
0.2% of residents speak other language at home (100% very well).
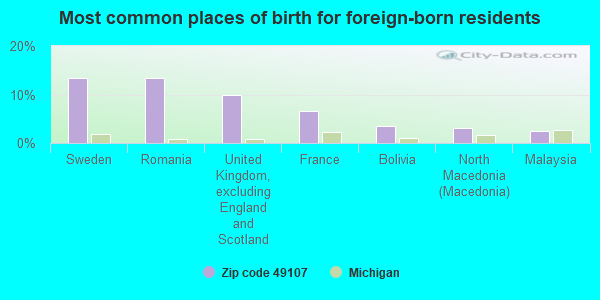
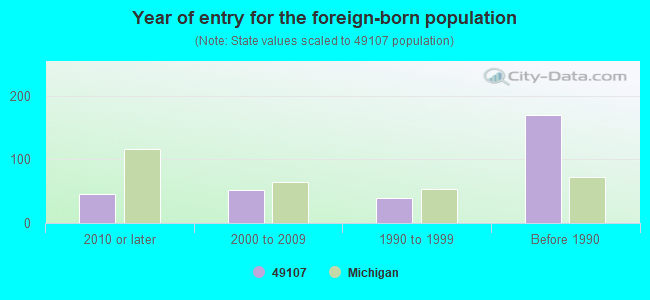
Foreign born population: 202 (1.9%) (79.4% of them are naturalized citizens)
This zip code:
1.9%
Whole state:
6.9%
14%Sweden
14%Romania
10%United Kingdom, excluding England and Scotland
6%France
4%Bolivia
3%North Macedonia (Macedonia)
2%Malaysia
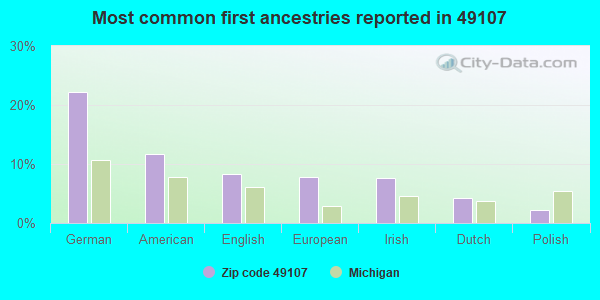
22%German
12%American
8%English
8%European
8%Irish
4%Dutch
2%Polish
Year of entry for the foreign-born population
462010 or later
522000 to 2009
391990 to 1999
170Before 1990
Major facilities with environmental interests located in this zip code:
AALFS PETROLEUM INC (223 S POST RD in BUCHANAN, MI)
(Resource Conservation and Recovery Act (tracking hazardous waste)) Business NAICS classification: HEATING OIL DEALERS. Organizations: AALFS EUGENE (CONTACT/OWNER)
AALFS PETROLEUM INC (301 RIVER ST in BUCHANAN, MI)
(Resource Conservation and Recovery Act (tracking hazardous waste)) Organizations: AALFS EUGENE (CONTACT/OPERATOR)
Alternative names: AMOCO OIL CO AALFS
AMERITECH CORP (119 N OAK ST in BUCHANAN, MI)
(Resource Conservation and Recovery Act (tracking hazardous waste))
MI DEPT/DEQ (RIVER ST & MCCOY CREEK IND in BUCHANAN, MI)
(Resource Conservation and Recovery Act (tracking hazardous waste)) Organizations: MI DEPT /DEQ (CONTACT/OWNER)
MI DEPT/ENVIRONMENTAL QUALITY (105 W SMITH ST in BUCHANAN, MI)
HAZARDOUS WASTE BIENNIAL REPORTER (Resource Conservation and Recovery Act (tracking hazardous waste)) (Resource Conservation and Recovery Act (tracking hazardous waste)) Alternative names: MDEQ BUCHANAN STEEL
FAPCO INC (922 TERRECOUPE RD in BUCHANAN, MI)
(Resource Conservation and Recovery Act (tracking hazardous waste)) Organizations: GARDINER LARRY (CONTACT/OWNER)
FURNITURE FIND CORP (15198 NORTH MAIN ST in BUCHANAN, MI)
(Resource Conservation and Recovery Act (tracking hazardous waste)) Organizations: DAVID UPTON (CONTACT/OWNER)
EXCEL OF MICHIGAN (216 S POST RD in BUCHANAN, MI)
(Resource Conservation and Recovery Act (tracking hazardous waste))
MI DEPT/ENVIRONMENTAL QUALITY (3RD ST, MCCOY CREEK IND PARK in BUCHANAN, MI)
(Resource Conservation and Recovery Act (tracking hazardous waste)) Alternative names: FORMER D & B BUILDINGS SITE
FALO AUTO PARTS INC (15565 WALTON RD in BUCHANAN, MI)
AIR MINOR (AIRS/AFS) Business SIC classification: MOTOR VEHICLE PARTS, USED; SCRAP AND WASTE MATERIALS
FS CARBON CO (13740 RANGELINE RD in BUCHANAN, MI)
(Resource Conservation and Recovery Act (tracking hazardous waste)) Business NAICS classification: ALL OTHER MISCELLANEOUS FOOD MANUFACTURING.
AMERICAN ELECTRIC POWER BUCHANAN OFFICE (500 CIRCLE DR in BUCHANAN, MI)
Conditionally Exempt Small Quantity Generators, less than 100 kg/month of hazardous waste (Resource Conservation and Recovery Act (tracking hazardous waste)) Business NAICS classification: NUCLEAR ELECTRIC POWER GENERATION. Organizations: AMERICAN ELECTRIC POWER SERVICE CORP (CONTACT/OWNER)
Alternative names: AMERICAN ELEC POWER BUCHANAN OFFICE BLDG
Housing units lacking complete plumbing facilities: 3.1% Housing units lacking complete kitchen facilities: 3.5%
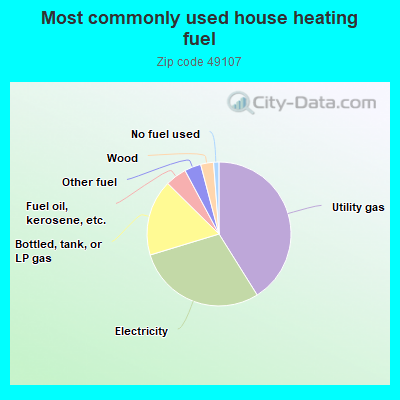
41.1%Utility gas
29.2%Electricity
17.1%Bottled, tank, or LP gas
4.8%Fuel oil, kerosene, etc.
3.7%Other fuel
2.9%Wood
1.2%No fuel used
Population in 1990: 10,342. Population change in the 1990s: +327 (+3.2%).
Place of birth for U.S.-born residents:
This state: 6,130
Northeast: 144
Midwest: 2,916
South: 617
West: 430
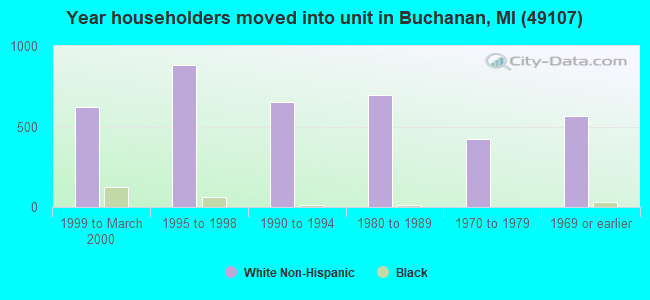
59% of the 49107 zip code residents lived in the same house 5 years ago. Out of people who lived in different houses, 60% lived in this county. Out of people who lived in different counties, 50% lived in Michigan.
87% of the 49107 zip code residents lived in the same house 1 year ago. Out of people who lived in different houses, 48% moved from this county. Out of people who lived in different houses, 1% moved from different county within same state. Out of people who lived in different houses, 55% moved from different state. Out of people who lived in different houses, 0% moved from abroad.
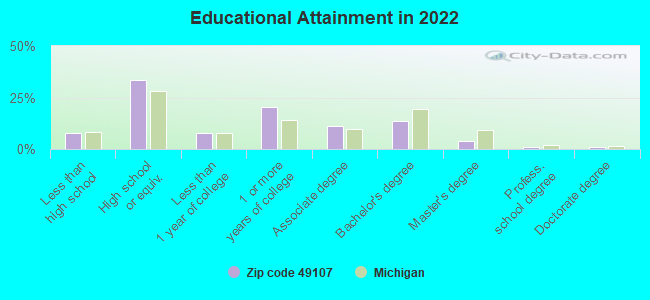
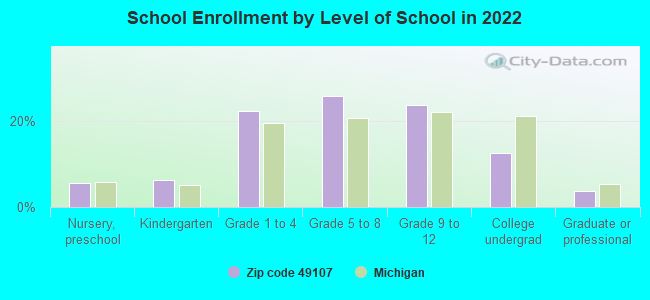
Private vs. public school enrollment:
Students in private schools in grades 1 to 8 (elementary and middle school): 29
Here:
3.0%
Michigan:
12.4%
Students in private schools in grades 9 to 12 (high school): 11
Here:
2.3%
Michigan:
9.8%
Students in private undergraduate colleges: 15
Here:
6.1%
Michigan:
14.9%
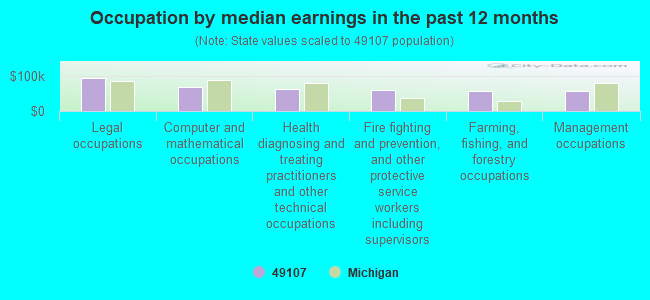
Occupation by median earnings in the past 12 months ($)
94,974Legal occupations
68,678Computer and mathematical occupations
62,288Health diagnosing and treating practitioners and other technical occupations
58,767Fire fighting and prevention, and other protective service workers including supervisors
57,041Farming, fishing, and forestry occupations
56,054Management occupations
Companies with federal contracts located in this zip code:
TELEX COMMUNICATIONS INC (600 CECIL ST in BUCHANAN, MI) : $1,333,616 in 12 contractsfrom 2001 to 2005
Contracts for Headsets, Handsets, Microphones and Speakers by Defense Logistics Agency Signed by year:2000: $0; 2001: $110,899; 2002: $0; 2003: $99,750; 2004: $694,120; 2005: $428,847; 2006: $0.
Biggest contracts:
$418,750 with Defense Logistics Agency for Headsets, Handsets, Microphones and Speakers. Signed on 2004-01-30. Completion date: 2005-05-24.
$184,161 with Defense Logistics Agency for Headsets, Handsets, Microphones and Speakers. Taking place in MN. Signed on 2005-04-05. Completion date: 2005-12-01.
$141,622, same as above.Signed on 2005-12-30. Completion date: 2006-07-28.
$113,029, same as above.Signed on 2004-10-12. Completion date: 2007-01-27.
FURNITUREFIND COM (15198 N MAIN ST in BUCHANAN, MI; small business) : $51,634 in 3 contractsfrom 2002 to 2004
$23,941 with Army for Household Furnishings. Signed on 2002-09-05. Completion date: 2002-11-15.
$19,173 with Army for Household Furniture. Signed on 2004-08-12. Completion date: 2004-10-29.
$8,520, same as above.Signed on 2003-09-25. Completion date: 2003-12-03.
OPTIMYSTIC ENTERPRISES INC (600 S OAK ST in BUCHANAN, MI; small business)
$4,124 with Army for Generators and Generators Sets, Electrical. Signed on 2005-09-06. Completion date: 2005-09-30.
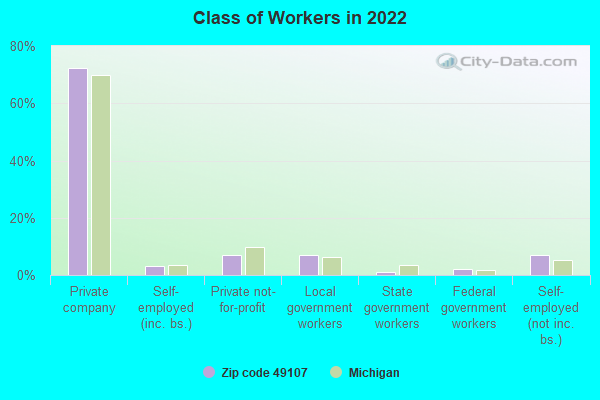
Top industries in this zip code by the number of employees in 2005:
Other Services (except Public Administration): Religious Organizations (100-249 employees: 1 establishment, 5-9 employees: 5 establishments, 1-4 employees: 8 establishments)
Utilities: Fossil Fuel Electric Power Generation (100-249: 1)
2002 - 2018 National Fire Incident Reporting System (NFIRS) incidents
According to the data from the years 2002 - 2018 the average number of fires per year is 47. The highest number of fires - 69 took place in 2017, and the least - 24 in 2013. The data has a growing trend.
When looking into fire subcategories, the most reports belonged to: Structure Fires (56.6%), and Outside Fires (29.5%).
Fire incident types reported to NFIRS in Zip Code 49107
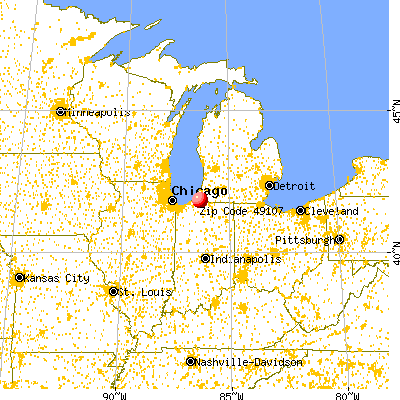


 Nearest zip codes: 49113, 49103, 49101, 49104, 49119, 46628.
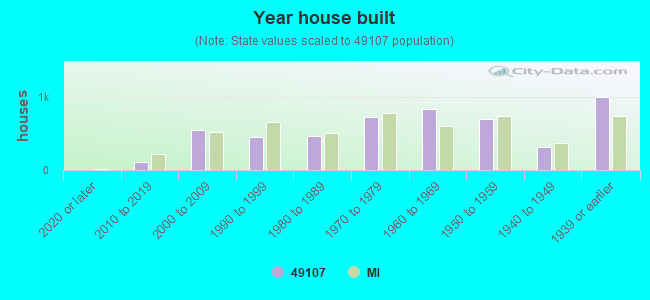


 According to the data from the years 2002 - 2018 the average number of fires per year is 47. The highest number of fires - 69 took place in 2017, and the least - 24 in 2013. The data has a growing trend.
 When looking into fire subcategories, the most reports belonged to: Structure Fires (56.6%), and Outside Fires (29.5%).