Estimated zip code population in 2022: 37,382 Zip code population in 2010: 35,940 Zip code population in 2000: 33,909
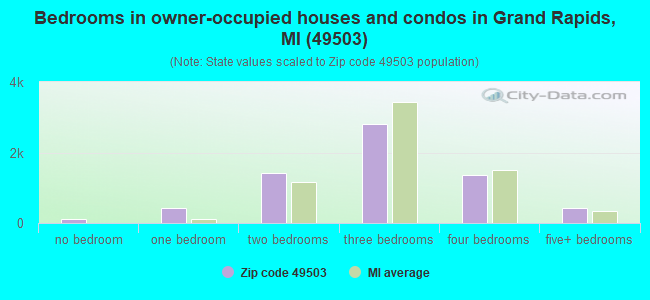
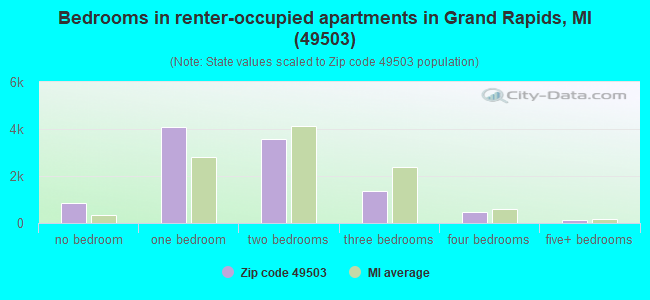
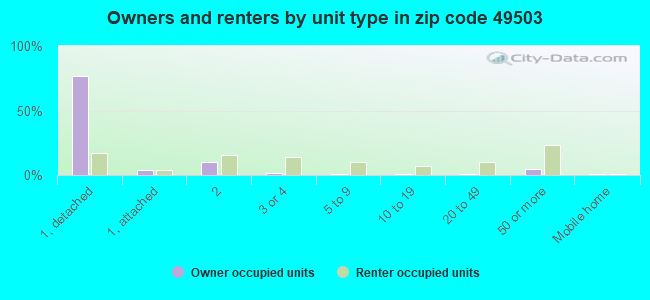
Houses and condos: 18,604 Renter-occupied apartments: 10,486
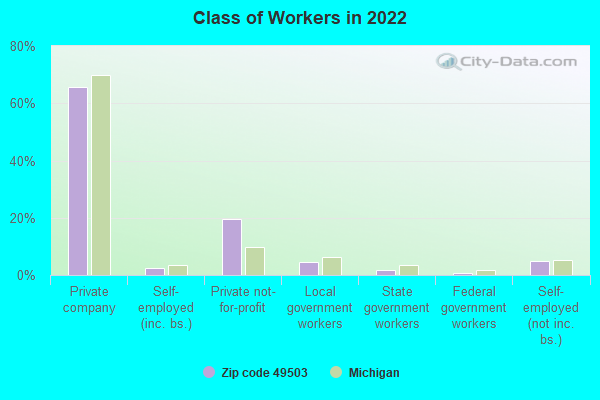
% of renters here:
62%
State:
27%
March 2022 cost of living index in zip code 49503: 86.3 (less than average, U.S. average is 100)
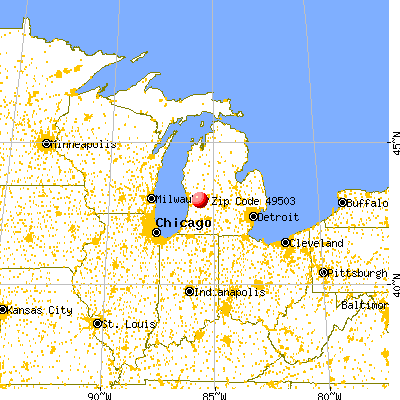
Land area: 7.2 sq. mi. Water area: 0.2 sq. mi.
Population density: 5,202 people per square mile
(average).
OSM Map
General Map
Google Map
MSN Map
OSM Map
General Map
Google Map
MSN Map
OSM Map
General Map
Google Map
MSN Map
OSM Map
General Map
Google Map
MSN Map
Please wait while loading the map...
Real estate property taxes paid for housing units in 2022:
This zip code:
0.9% ($2,060)
Michigan:
1.2% ($2,746)
Median real estate property taxes paid for housing units with mortgages in 2022: $2,232 (1.0%) Median real estate property taxes paid for housing units with no mortgage in 2022: $1,617 (0.8%)
Averages for the 2020 tax year for zip code 49503, filed in 2021:
Average Adjusted Gross Income (AGI) in 2020: $103,422 (Individual Income Tax Returns)
Here:
$103,422
State:
$68,945
Salary/wage: $45,212 (reported on 88.4% of returns)
Here:
$45,212
State:
$57,142
(% of AGI for various income ranges: 1207.4% for AGIs below $25k, 3689.3% for AGIs $25k-50k, 7073.1% for AGIs $50k-75k, 10526.5% for AGIs $75k-100k, 19524.7% for AGIs $100k-200k, 86822.1% for AGIs over 200k)
Taxable interest for individuals: $19,943 (reported on 24.3% of returns)
This zip code:
$19,943
Michigan:
$1,630
(% of AGI for various income ranges: 5.9% for AGIs below $25k, 8.3% for AGIs $25k-50k, 22.6% for AGIs $50k-75k, 48.9% for AGIs $75k-100k, 103.2% for AGIs $100k-200k, 63682.9% for AGIs over 200k)
Ordinary dividends: $108,825 (reported on 13.6% of returns)
Here:
$108,825
State:
$6,972
(% of AGI for various income ranges: 13.1% for AGIs below $25k, 20.3% for AGIs $25k-50k, 47.6% for AGIs $50k-75k, 157.3% for AGIs $75k-100k, 372.0% for AGIs $100k-200k, 194143.6% for AGIs over 200k)
Net capital gain/loss in AGI: +$248,055 (reported on 13.2% of returns)
Here:
+$248,055
State:
+$20,064
(% of AGI for various income ranges: 7.5% for AGIs below $25k, 32.3% for AGIs $25k-50k, 54.7% for AGIs $50k-75k, 156.8% for AGIs $75k-100k, 687.6% for AGIs $100k-200k, 436096.4% for AGIs over 200k)
Profit/loss from business: +$10,802 (reported on 14.2% of returns)
Here:
+$10,802
State:
+$11,172
(% of AGI for various income ranges: 102.5% for AGIs below $25k, 108.6% for AGIs $25k-50k, 204.4% for AGIs $50k-75k, 298.3% for AGIs $75k-100k, 766.4% for AGIs $100k-200k, 4052.9% for AGIs over 200k)
Taxable individual retirement arrangement distribution: $21,741 (reported on 4.0% of returns)
49503:
$21,741
Michigan:
$19,803
(% of AGI for various income ranges: 26.5% for AGIs below $25k, 29.6% for AGIs $25k-50k, 83.1% for AGIs $50k-75k, 176.9% for AGIs $75k-100k, 536.9% for AGIs $100k-200k, 4595.7% for AGIs over 200k)
Self-employed (Keogh) retirement plans: $24,783 (reported on 0.3% of returns)
49503:
$24,783
Michigan:
$25,132
(% of AGI for various income ranges: 13.6% for AGIs $50k-75k, 853.6% for AGIs over 200k)
Total itemized deductions: $134,952 (reported on 4.4% of returns)
Here:
$134,952
State:
$34,117
(% of AGI for various income ranges: 21.4% for AGIs below $25k, 44.7% for AGIs $25k-50k, 109.2% for AGIs $50k-75k, 329.9% for AGIs $75k-100k, 793.5% for AGIs $100k-200k, 69762.1% for AGIs over 200k)
Charity contributions: $84,795 (reported on 3.4% of returns)
Here:
$84,795
State:
$13,548
(% of AGI for various income ranges: 2.8% for AGIs below $25k, 9.4% for AGIs $25k-50k, 20.0% for AGIs $50k-75k, 65.0% for AGIs $75k-100k, 217.2% for AGIs $100k-200k, 36475.7% for AGIs over 200k)
Taxes paid: $7,806 (reported on 4.4% of returns)
49503:
$7,806
State:
$7,972
(% of AGI for various income ranges: 3.6% for AGIs below $25k, 7.9% for AGIs $25k-50k, 36.0% for AGIs $50k-75k, 106.5% for AGIs $75k-100k, 265.9% for AGIs $100k-200k, 1612.9% for AGIs over 200k)
Earned income credit: $2,102 (reported on 17.0% of returns)
Here:
$2,102
State:
$2,251
(% of AGI for various income ranges: 80.9% for AGIs below $25k, 52.0% for AGIs $25k-50k, 0.6% for AGIs $50k-75k)
Percentage of individuals using paid preparers for their 2020 taxes: 94.0%
Here:
94%
State:
93%
(% for various income ranges: 92.5% for AGIs below $25k, 94.9% for AGIs $25k-50k, 95.1% for AGIs $50k-75k, 93.5% for AGIs $75k-100k, 94.8% for AGIs $100k-200k, 95.9% for AGIs over 200k)
Averages for the 2012 tax year for zip code 49503, filed in 2013:
Average Adjusted Gross Income (AGI) in 2012: $113,972 (Individual Income Tax Returns)
Here:
$113,972
State:
$55,609
Salary/wage: $35,224 (reported on 88.9% of returns)
Here:
$35,224
State:
$46,782
(% of AGI for various income ranges: 84.1% for AGIs below $25k, 90.1% for AGIs $25k-50k, 86.3% for AGIs $50k-75k, 83.4% for AGIs $75k-100k, 79.0% for AGIs $100k-200k, 5.0% for AGIs over 200k)
Taxable interest for individuals: $15,000 (reported on 23.7% of returns)
This zip code:
$15,000
Michigan:
$1,491
(% of AGI for various income ranges: 0.5% for AGIs below $25k, 0.4% for AGIs $25k-50k, 0.3% for AGIs $50k-75k, 0.6% for AGIs $75k-100k, 0.6% for AGIs $100k-200k, 4.1% for AGIs over 200k)
Ordinary dividends: $214,619 (reported on 11.8% of returns)
Here:
$214,619
State:
$6,225
(% of AGI for various income ranges: 0.7% for AGIs below $25k, 0.6% for AGIs $25k-50k, 0.7% for AGIs $50k-75k, 1.1% for AGIs $75k-100k, 1.7% for AGIs $100k-200k, 30.4% for AGIs over 200k)
Net capital gain/loss in AGI: +$60,746 (reported on 8.9% of returns)
Here:
+$60,746
State:
+$9,326
(% of AGI for various income ranges: 0.1% for AGIs $25k-50k, 0.3% for AGIs $50k-75k, 0.8% for AGIs $75k-100k, 1.6% for AGIs $100k-200k, 6.4% for AGIs over 200k)
Profit/loss from business: +$10,777 (reported on 13.6% of returns)
Here:
+$10,777
State:
+$11,523
(% of AGI for various income ranges: 7.0% for AGIs below $25k, 2.5% for AGIs $25k-50k, 2.9% for AGIs $50k-75k, 2.1% for AGIs $75k-100k, 2.8% for AGIs $100k-200k, 0.4% for AGIs over 200k)
Taxable individual retirement arrangement distribution: $14,117 (reported on 5.2% of returns)
49503:
$14,117
Michigan:
$15,298
(% of AGI for various income ranges: 1.5% for AGIs below $25k, 1.1% for AGIs $25k-50k, 1.9% for AGIs $50k-75k, 2.3% for AGIs $75k-100k, 2.5% for AGIs $100k-200k, 0.2% for AGIs over 200k)
Self-employment retirement plans: $25,820 (reported on 0.3% of returns)
49503:
$25,820
Michigan:
$20,834
Total itemized deductions: $77,561 (15% of AGI, reported on 18.0% of returns)
Here:
$77,561
State:
$21,628
Here:
15.0% of AGI
State:
18.4% of AGI
(% of AGI for various income ranges: 3.3% for AGIs below $25k, 5.6% for AGIs $25k-50k, 9.6% for AGIs $50k-75k, 11.0% for AGIs $75k-100k, 13.7% for AGIs $100k-200k, 13.9% for AGIs over 200k)
Charity contributions: $55,085 (reported on 14.1% of returns)
Here:
$55,085
State:
$4,225
(% of AGI for various income ranges: 0.3% for AGIs below $25k, 0.8% for AGIs $25k-50k, 1.6% for AGIs $50k-75k, 1.8% for AGIs $75k-100k, 2.8% for AGIs $100k-200k, 8.9% for AGIs over 200k)
Taxes paid: $14,301 (reported on 17.9% of returns)
49503:
$14,301
State:
$8,327
(% of AGI for various income ranges: 0.6% for AGIs below $25k, 1.7% for AGIs $25k-50k, 3.4% for AGIs $50k-75k, 4.4% for AGIs $75k-100k, 6.2% for AGIs $100k-200k, 2.0% for AGIs over 200k)
Earned income credit: $2,219 (reported on 23.6% of returns)
Here:
$2,219
State:
$2,306
(% of AGI for various income ranges: 6.7% for AGIs below $25k, 1.0% for AGIs $25k-50k)
Percentage of individuals using paid preparers for their 2012 taxes: 47.0%
Here:
47%
State:
57%
(% for various income ranges: 44.7% for AGIs below $25k, 47.3% for AGIs $25k-50k, 46.7% for AGIs $50k-75k, 51.4% for AGIs $75k-100k, 57.6% for AGIs $100k-200k, 83.3% for AGIs over 200k)
Averages for the 2004 tax year for zip code 49503, filed in 2005:
Average Adjusted Gross Income (AGI) in 2004: $47,435 (Individual Income Tax Returns)
Here:
$47,435
State:
$48,204
Salary/wage: $30,160 (reported on 89.3% of returns)
Here:
$30,160
State:
$42,791
(% of AGI for various income ranges: 115.9% for AGIs below $10k, 87.4% for AGIs $10k-25k, 91.1% for AGIs $25k-50k, 87.8% for AGIs $50k-75k, 81.1% for AGIs $75k-100k, 22.4% for AGIs over 100k)
Taxable interest for individuals: $3,101 (reported on 27.4% of returns)
This zip code:
$3,101
Michigan:
$1,725
(% of AGI for various income ranges: 4.3% for AGIs below $10k, 1.0% for AGIs $10k-25k, 0.7% for AGIs $25k-50k, 0.8% for AGIs $50k-75k, 1.0% for AGIs $75k-100k, 2.7% for AGIs over 100k)
Taxable dividends: $87,672 (reported on 14.0% of returns)
Here:
$87,672
State:
$3,420
(% of AGI for various income ranges: 2.0% for AGIs below $10k, 0.9% for AGIs $10k-25k, 0.7% for AGIs $25k-50k, 0.8% for AGIs $50k-75k, 1.7% for AGIs $75k-100k, 52.2% for AGIs over 100k)
Net capital gain/loss: +$19,597 (reported on 10.6% of returns)
Here:
+$19,597
State:
+$8,532
(% of AGI for various income ranges: -1.0% for AGIs below $10k, -0.1% for AGIs $10k-25k, 0.2% for AGIs $25k-50k, 1.0% for AGIs $50k-75k, 1.5% for AGIs $75k-100k, 8.5% for AGIs over 100k)
Profit/loss from business: +$8,237 (reported on 11.4% of returns)
Here:
+$8,237
State:
+$9,547
(% of AGI for various income ranges: 6.8% for AGIs below $10k, 2.9% for AGIs $10k-25k, 1.9% for AGIs $25k-50k, 2.7% for AGIs $50k-75k, 5.1% for AGIs $75k-100k, 1.1% for AGIs over 100k)
IRA payment deduction: $2,307 (reported on 1.4% of returns)
49503:
$2,307
Michigan:
$2,875
(% of AGI for various income ranges: 0.1% for AGIs $10k-25k, 0.1% for AGIs $25k-50k, 0.1% for AGIs $50k-75k, 0.2% for AGIs $75k-100k, 0.0% for AGIs over 100k)
Self-employed pension: $15,051 (reported on 0.6% of returns)
Here:
$15,051
Michigan:
$13,826
(% of AGI for various income ranges: 0.0% for AGIs $10k-25k, 0.2% for AGIs $50k-75k, 0.3% for AGIs over 100k)
Total itemized deductions: $29,029 (21% of AGI, reported on 22.8% of returns)
Here:
$29,029
State:
$18,509
Here:
20.7% of AGI
State:
20.7% of AGI
(% of AGI for various income ranges: 10.9% for AGIs below $10k, 5.4% for AGIs $10k-25k, 10.1% for AGIs $25k-50k, 13.6% for AGIs $50k-75k, 15.3% for AGIs $75k-100k, 17.7% for AGIs over 100k)
Charity contributions deductions: $4,746 (4% of AGI, reported on 18.2% of returns)
Here:
$4,746
State:
$3,365
Here:
3.7% of AGI
State:
3.6% of AGI
(% of AGI for various income ranges: 0.7% for AGIs below $10k, 0.7% for AGIs $10k-25k, 1.3% for AGIs $25k-50k, 2.3% for AGIs $50k-75k, 2.9% for AGIs $75k-100k, 2.1% for AGIs over 100k)
Total tax: $7,117 (reported on 64.9% of returns)
49503:
$7,117
State:
$7,691
(% of AGI for various income ranges: 2.9% for AGIs below $10k, 3.8% for AGIs $10k-25k, 7.2% for AGIs $25k-50k, 10.2% for AGIs $50k-75k, 12.1% for AGIs $75k-100k, 12.1% for AGIs over 100k)
Earned income credit: $1,752 (reported on 23.7% of returns)
Here:
$1,752
State:
$1,737
Percentage of individuals using paid preparers for their 2004 taxes: 54.4%
Here:
54%
State:
60%
(% for various income ranges: 52.8% for AGIs below $10k, 57.0% for AGIs $10k-25k, 51.2% for AGIs $25k-50k, 54.3% for AGIs $50k-75k, 55.1% for AGIs $75k-100k, 66.1% for AGIs over 100k)
Likely homosexual households (counted as self-reported same-sex unmarried-partner households)
Lesbian couples: 0.3% of all households
Gay men: 0.6% of all households
Household received Food Stamps/SNAP in the past 12 months: 3,053 Household did not receive Food Stamps/SNAP in the past 12 months: 14,223
Women who had a birth in the past 12 months: 597 (283 now married, 306 unmarried) Women who did not have a birth in the past 12 months: 11,182 (2,661 now married, 8,560 unmarried)
Housing units in zip code 49503 with a mortgage: 4,367 (395 second mortgage, 50 home equity loan, 297 both second mortgage and home equity loan) Houses without a mortgage: 126
Median monthly owner costs for units with a mortgage: $1,286 Median monthly owner costs for units without a mortgage: $467
Residents with income below the poverty level in 2022:
This zip code:
23.6%
Whole state:
13.4%
Residents with income below 50% of the poverty level in 2022:
This zip code:
10.7%
Whole state:
6.9%
Median number of rooms in houses and condos:
Here:
6.5
State:
6.5
Median number of rooms in apartments:
Here:
3.5
State:
4.3
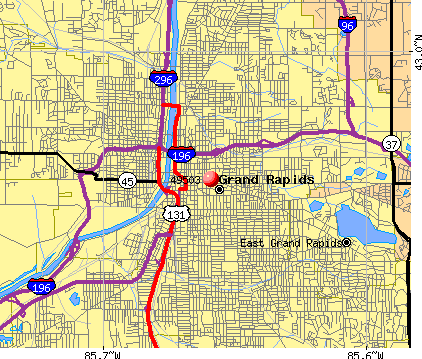
Notable locations in this zip code not listed on our city pages
Notable locations in zip code 49503: Grand Rapids Station (A), DeVos Performance Hall (B), Kent County Building (C), Grand Rapids City Hall (D), Grand Rapids Art Musuem (E), Van Andel Arena (F), Kent County Courthouse (G), Grand Rapids Police Department (H), Grand Rapids Children's Museum (I), Grand Rapids Public Library (J), Grand Rapids Fire Department Station 1 (K), Spectrum Renucci Hospitality House (L), Voight House Victorian Museum (M), Cook-DeVos Center for Health Sciences (N), McCabe-Marlowe House (O), Calkins Science Center (P), Gerald R Ford Fieldhouse (Q), Spectrum Theater (R), Applied Technology Center (S), Learning Resource Center (T). Display/hide their locations on the map
Churches in zip code 49503 include: Saint Isadore Church (A), Smith Memorial Congregational Church (B), Wyoming Spanish Seventh Day Church (C), Calvary Chapel (D), Coit Community Church (E), Gospel Temple Baptist Church (F), Saint Joseph's Church (G), Spanish Church of God (H), Fuller Avenue Church of the Nazarene (I). Display/hide their locations on the map
Parks in zip code 49503 include: The Castle Historical Marker (1), Central Reformed Church Historical Marker (2), Central High School Historical Marker (3), First (Park) Congregational Church Historical Marker (4), First (Park) Congregational Church - Second Historical Marker (5), Gerald R Ford Boyhood Home Historical Marker (6), President Gerald R Ford Historical Marker (7), Ladies Literary Club Historical Marker (8), May House Historical Marker (9). Display/hide their locations on the map
Tourist attractions (not listed on the city page) : E & R Sales Inc (Amusement & Theme Parks; 41 Division Avenue South) (1), Game Room Guys (Amusement & Theme Parks; 4022 West River Drive Northeast) (2), Grand Rapids-Kent County Convention & Visitors BRU - Convention & Visitors Bu (171 Monroe Avenue Northwest Suite 700) (3), Dadds Magic Bus & Limousine (Tours & Charters; 407 Turner Avenue Northwest) (4). Display/hide their approximate locations on the map
2,550 married couples with children.
2,693 single-parent households (622 men, 2,071 women).
82.8% of residents of 49503 zip code speak English at home.
15.2% of residents speak Spanish at home (44% very well, 17% well, 27% not well, 11% not at all).
0.8% of residents speak other Indo-European language at home (84% very well, 11% well, 5% not well).
0.8% of residents speak Asian or Pacific Island language at home (70% very well, 21% well, 6% not well, 3% not at all).
0.7% of residents speak other language at home (27% very well, 25% well, 33% not well, 15% not at all).
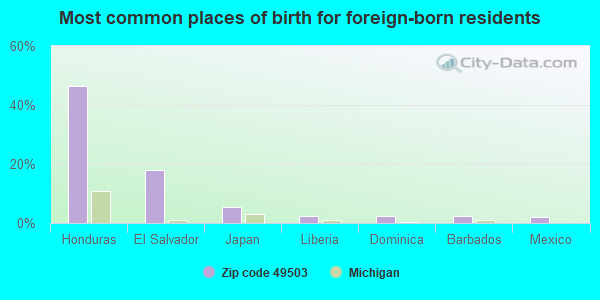
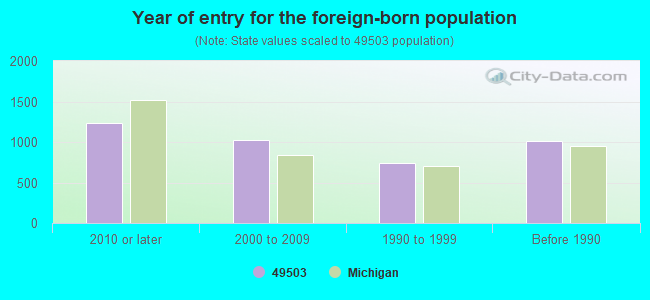
Foreign born population: 3,663 (9.8%) (31.2% of them are naturalized citizens)
Major facilities with environmental interests located in this zip code:
GRAND RAPIDS DIE CASTING CORPORATION (1141 IONIA N.W. in GRAND RAPIDS, MI)
(Integrated Compliance Information System) - ICIS-05-2001-0095, FORMAL ENFORCEMENT ACTION CRITERIA AND HAZARDOUS AIR POLLUTANT INVENTORY (Inventory of air pollution sources) HAZARDOUS WASTE BIENNIAL REPORTER (Resource Conservation and Recovery Act (tracking hazardous waste)) (Resource Conservation and Recovery Act (tracking hazardous waste)) TRI REPORTER (Tracking of toxic chemicals releasing facilities) Business SIC classification: NONFERROUS DIE-CASTINGS, EXCEPT ALUMINUM; ELECTROPLATING, PLATING, POLISHING, ANODIZING, AND COLORING Business NAICS classification: ELECTROPLATING, PLATING, POLISHING, ANODIZING, AND COLORING.; ELECTROPLATING, PLATING, POLISHING, ANODIZING, AND COLORING. Alternative names: ZIN-PLAS CORP.
FOUNTAIN SCHOOL (159 COLLEGE NE in GRAND RAPIDS, MI)
(Geographic Names Information System) (National Center for Education Statistics) - STATE ID-01280 Organizations: GRAND RAPIDS PUBLIC SCHOOLS (SCHOOL DISTRICT)
EAST LEONARD SCHOOL (410 BARNETT NE in GRAND RAPIDS, MI)
(Geographic Names Information System) (National Center for Education Statistics) - STATE ID-01026 Organizations: GRAND RAPIDS PUBLIC SCHOOLS (SCHOOL DISTRICT)
ADELANTE HIGH SCHOOL (425 PLEASANT SW in GRAND RAPIDS, MI)
(National Center for Education Statistics) - STATE ID-08362 Organizations: GRAND RAPIDS PUBLIC SCHOOLS (SCHOOL DISTRICT)
GATEWAY MIDDLE/HIGH SCHOOL (311 STATE STREET SE in GRAND RAPIDS, MI)
(National Center for Education Statistics) - STATE ID-08453
MI DEPT/ENVIRONMENTAL QUALITY (350 OTTAWA NORTH WEST in GRAND RAPIDS, MI)
(Resource Conservation and Recovery Act (tracking hazardous waste)) Conditionally Exempt Small Quantity Generators, less than 100 kg/month of hazardous waste (Resource Conservation and Recovery Act (tracking hazardous waste)) Business NAICS classification: SUPPORT ACTIVITIES FOR OIL AND GAS OPERATIONS. Organizations: MDEQ (CONTACT/OPERATOR)
Alternative names: MI DEPT/ENVIRONMENTAL QUALITY GLMD (WELL, MI DEPT/NATURAL RESOURCES, MIDNR GRAND RAPIDS
MI DEPT/NATURAL RESOURCES (350 OTTAWA N W in GRAND RAPIDS, MI)
(Resource Conservation and Recovery Act (tracking hazardous waste)) Alternative names: MI DEPT/DNR
AMOCO OIL CO (300 MICHIGAN NE in GRAND RAPIDS, MI)
(Resource Conservation and Recovery Act (tracking hazardous waste)) Organizations: AMOCO OIL COMPANY (CONTACT/OWNER)
, B P PRODUCTS N AMERICA INC (CONTACT/OWNER)
Alternative names: AMOCO OIL CO 0090
AUTODIE INTERNATIONAL (44 COLDBROOK N.W. in GRAND RAPIDS, MI)
Small Quantity Generators, between 100 kg and 1000 kg of hazardous waste/month (Resource Conservation and Recovery Act (tracking hazardous waste)) TRI REPORTER (Tracking of toxic chemicals releasing facilities) Business SIC classification: SPECIAL DIES AND TOOLS, DIE SETS, JIGS AND FIXTURES, AND INDUSTRIAL MOLDS Business NAICS classification: MACHINE TOOL (METAL FORMING TYPES) MANUFACTURING.; SPECIAL DIE AND TOOL, DIE SET, JIG, AND FIXTURE MANUFACTURING. Organizations: WISNE A E (CONTACT/OWNER)
, COMAU (CONTACT/OWNER)
MI DEPT/TRANSPORTATION BRIDGE (I-196 OVER DIAMOND AVE in GRAND RAPIDS, MI)
(Resource Conservation and Recovery Act (tracking hazardous waste)) Organizations: MICH DEPT OF TRANSPORTATION (CONTACT/OPERATOR)
Alternative names: MIDOT BRIDGE I-196 OVER DIAMOND AVE
MI DEPT/TRANSPORTATION BRIDGE (I-196 OVER INDIAN MOUND DR in GRAND RAPIDS, MI)
(Resource Conservation and Recovery Act (tracking hazardous waste)) Organizations: MICH DEPT OF TRANSPORTATION (CONTACT/OPERATOR)
Alternative names: MIDOT BRIDGE I-196 OVER INDIAN MOUND DR
MI DEPT/TRANSPORTATION BRIDGE (US-131 UNDER HALL ST in GRAND RAPIDS, MI)
(Resource Conservation and Recovery Act (tracking hazardous waste)) Organizations: MICH DEPT OF TRANSPORTATION (CONTACT/OPERATOR)
Alternative names: MIDOT BRIDGE US-131 UNDER HALL ST
Housing units lacking complete plumbing facilities: 0.4% Housing units lacking complete kitchen facilities: 0.7%
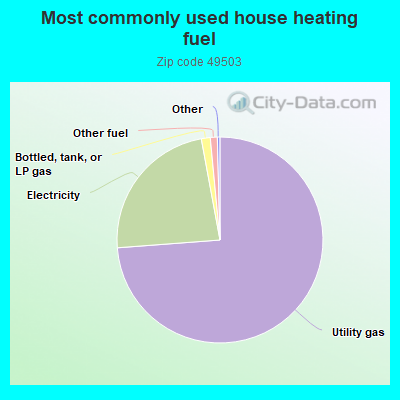
73.8%Utility gas
23.3%Electricity
1.4%Bottled, tank, or LP gas
1.1%Other fuel
Population in 1990: 32,876. Population change in the 1990s: +1,033 (+3.1%).
Place of birth for U.S.-born residents:
This state: 26,123
Northeast: 1,010
Midwest: 2,923
South: 1,932
West: 1,386
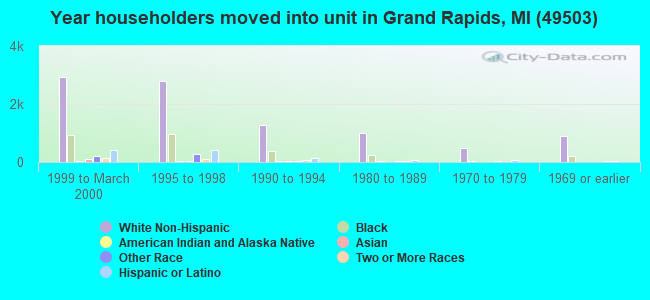
43% of the 49503 zip code residents lived in the same house 5 years ago. Out of people who lived in different houses, 62% lived in this county. Out of people who lived in different counties, 50% lived in Michigan.
77% of the 49503 zip code residents lived in the same house 1 year ago. Out of people who lived in different houses, 59% moved from this county. Out of people who lived in different houses, 20% moved from different county within same state. Out of people who lived in different houses, 16% moved from different state. Out of people who lived in different houses, 1% moved from abroad.
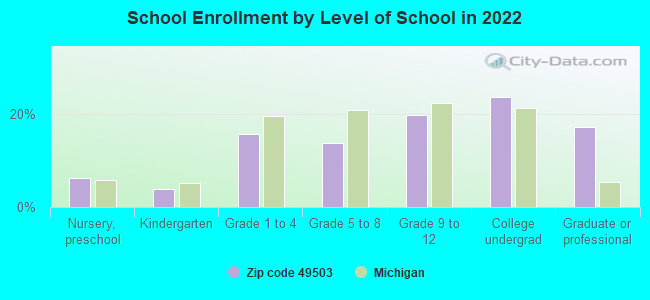
Private vs. public school enrollment:
Students in private schools in grades 1 to 8 (elementary and middle school): 443
Here:
19.3%
Michigan:
12.4%
Students in private schools in grades 9 to 12 (high school): 235
Here:
15.4%
Michigan:
9.8%
Students in private undergraduate colleges: 465
Here:
25.4%
Michigan:
14.9%
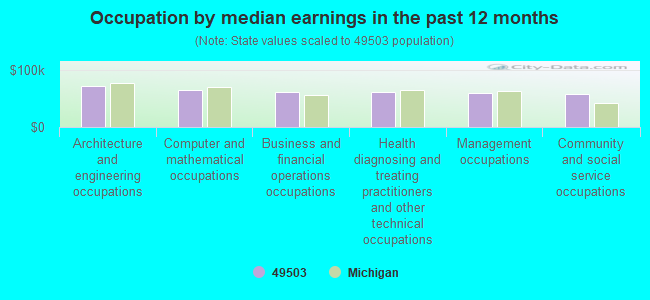
Occupation by median earnings in the past 12 months ($)
70,820Architecture and engineering occupations
65,261Computer and mathematical occupations
61,606Business and financial operations occupations
61,156Health diagnosing and treating practitioners and other technical occupations
58,600Management occupations
57,054Community and social service occupations
Companies with biggest federal contracts located in this zip code (GRAND RAPIDS, MI):
BLACKMER/A DOVER COMPANY (1809 CENTURY AVENUE SW) : $6,780,769 in 325 contractsfrom 1999 to 2006
Contracts for Power and Hand Pumps, Gears, Pulleys, Sprockets, and Transmission Chain, Cable, Cord, and Wire Assemblies: Communications Equipment, Torque Converters and Speed Changers, and moreby Navy, Defense Logistics Agency, Army, U.S. Army Corps of Engineers - civil program financing only, and others Signed by year:2000: $636,772; 2001: $855,630; 2002: $3,138; 2003: $416,270; 2004: $1,219,924; 2005: $2,890,870; 2006: $577,864.
Biggest contracts:
$212,091 with Navy for Power and Hand Pumps. Signed on 2005-07-06. Completion date: 2006-07-06.
$194,109, same as above.Signed on 2005-07-06. Completion date: 2006-07-06.
$192,420, same as above.Signed on 2000-05-09. Completion date: 2001-01-26.
$101,043, same as above.Signed on 2004-09-08. Completion date: 2004-12-02.
THIERICA INC (900 CLANCY NE; small business) : $681,248 in 26 contractsfrom 2002 to 2006
Contracts for Navigational Instruments, Flight Instruments, Indoor and Outdoor Electric Lighting Fixtures, Ballasts, Lampholders, and Starters, and moreby Defense Logistics Agency, Navy Signed by year:2000: $0; 2001: $0; 2002: $47,962; 2003: $40,054; 2004: $406,825; 2005: $113,582; 2006: $72,825.
Biggest contracts:
$145,826 with Defense Logistics Agency for Navigational Instruments. Signed on 2004-11-24. Completion date: 2005-03-16.
$145,826, same as above.Signed on 2004-11-24. Completion date: 2005-03-16.
$52,555 with Defense Logistics Agency for Flight Instruments. Signed on 2004-02-11. Completion date: 2004-03-12.
$47,962 with Defense Logistics Agency for Navigational Instruments. Signed on 2002-09-08. Completion date: 2002-12-15.
GRAND RAPIDS BRAKE SERVICE INC (1935 CENTURY AVE SW; small business) : $528,263 in 3 contractsfrom 2003 to 2004
$460,812 with Defense Logistics Agency for Vehicular Brake, Steering, Axle, Wheel, and Track Components. Signed on 2003-11-24. Completion date: 2003-12-29.
$34,554 with Defense Logistics Agency for Vehicular Furniture and Accessories. Signed on 2004-03-03. Completion date: 2004-05-02.
$32,897 with Defense Logistics Agency for Vehicular Brake, Steering, Axle, Wheel, and Track Components. Signed on 2004-01-14. Completion date: 2004-03-29.
CHOICE SERVICES, INC (645 CHERRY ST SE STE 103; small business) : $263,143 in 13 contractsfrom 2004 to 2006
Contracts for Food Services by Army Signed by year:2000: $0; 2001: $0; 2002: $0; 2003: $0; 2004: $68,454; 2005: $108,709; 2006: $85,980.
Biggest contracts:
$55,140 with Army for Food Services. Taking place in NV. Signed on 2006-01-12. Completion date: 2005-11-30.
$49,959 with Army for Food Services. Signed on 2005-10-11. Completion date: 2005-09-30.
$38,677, same as above.Signed on 2004-10-07. Completion date: 2005-09-30.
$28,893, same as above.Signed on 2006-07-11. Completion date: 2006-08-12.
AMWAY HOTEL CORPORATION (187 MONROE AVE NW) : $165,002 in 2 contractsin 2006
$83,262 with Army for Lodging - Hotel/Motel. Signed on 2006-02-28. Completion date: 2006-03-11.
$81,740, same as above.Signed on 2006-02-10. Completion date: 2006-02-12.
OMARA PRODUCTS, INC. (820 MONROE, #10; small business) : $128,248 in 2 contractsin 2000
$97,373 with Defense Logistics Agency for Safety and Rescue Equipment. Taking place in RI. Signed on 2000-08-15. Completion date: 2001-05-06.
$30,875 with Defense Logistics Agency for Safety and Rescue Equipment. Signed on 2000-03-16. Completion date: 2000-12-13.
GRAND RAPIDS CHAIR COMPANY (625 CHESTNUT ST SW; small business) : $112,999 in 4 contractsfrom 2004 to 2005
$54,547 with Air Force for Office Furniture. Signed on 2005-09-16. Completion date: 2005-09-18.
$27,090 with Army for Office Furniture. Signed on 2004-01-26. Completion date: 2004-02-23.
$21,745, same as above.Signed on 2004-08-06. Completion date: 2004-09-17.
$9,617 with Army for Household Furnishings. Taking place in MO. Signed on 2005-06-03. Completion date: 2005-06-30.
AMWAY HOTEL CORPORATION (187 MONROE NW) : $80,210 in 3 contractsfrom 2002 to 2003
$69,935 with Army for Lodging - Hotel/Motel. Signed on 2003-12-05. Completion date: 2003-12-07.
$7,000 with Army for Food Services. Signed on 2002-10-24. Completion date: 2002-10-28.
$3,275 with Army for Lease or Rental of Facilities -- Conference Space and Facilities. Signed on 2002-08-22. Completion date: 2002-09-12.
$17,319 with Army for Telephone and Telegraph Equipment. Signed on 2005-06-02. Completion date: 2005-06-07.
WASTE CONTROL OF GRAND RAPIDS, (612 NORTH AVE NE; small business) : $11,543 in 4 contractsfrom 2004 to 2006
$4,591 with Public Buildings Service for Trash/Garbage Collection Services - Including Portable Sanitation Services. Signed on 2005-04-01. Completion date: 2004-02-28.
$4,372, same as above.Signed on 2004-05-03. Effective on 2004-04-01. Completion date: 2005-03-31.
$2,580 with Navy for Trash/Garbage Collection Services - Including Portable Sanitation Services. Signed on 2006-02-08. Completion date: 2011-01-31.
$0 with Public Buildings Service for Trash/Garbage Collection Services - Including Portable Sanitation Services. Signed on 2004-05-03. Effective on 2004-04-01. Completion date: 2005-03-31.
Top industries in this zip code by the number of employees in 2005:
Health Care and Social Assistance: General Medical and Surgical Hospitals (over 1000 employees: 2 establishments)
Health Care and Social Assistance: Other Individual and Family Services (250-499: 1, 100-249: 1, 20-49: 5, 10-19: 6, 5-9: 2, 1-4: 5)
Administrative and Support and Waste Management and Remediation Services: Security Guards and Patrol Services (250-499: 1, 100-249: 1, 50-99: 3, 10-19: 2)
Accommodation and Food Services: Hotels (except Casino Hotels) and Motels (500-999: 1)
Other Services (except Public Administration): Religious Organizations (50-99: 2, 20-49: 7, 10-19: 10, 5-9: 14, 1-4: 21)
People in group quarters in 2010:
891 people in local jails and other municipal confinement facilities
420 people in other noninstitutional facilities
325 people in nursing facilities/skilled-nursing facilities
305 people in emergency and transitional shelters (with sleeping facilities) for people experiencing homelessness
119 people in correctional residential facilities
87 people in correctional facilities intended for juveniles
56 people in residential treatment centers for adults
55 people in group homes intended for adults
37 people in residential treatment centers for juveniles (non-correctional)
27 people in college/university student housing
6 people in workers' group living quarters and job corps centers
People in group quarters in 2000:
947 people in local jails and other confinement facilities (including police lockups)
446 people in other noninstitutional group quarters
203 people in other group homes
200 people in hospitals/wards and hospices for chronically ill
200 people in other hospitals or wards for chronically ill
140 people in religious group quarters
82 people in homes or halfway houses for drug/alcohol abuse
71 people in other nonhousehold living situations
48 people in nursing homes
48 people in orthopedic wards and institutions for the physically handicapped
48 people in college dormitories (includes college quarters off campus)
34 people in homes for the mentally retarded
31 people in training schools for juvenile delinquents
5 people in halfway houses
Fatal accident statistics in 2014:
Fatal accident count: 1
Vehicles involved in fatal accidents: 1
Fatal accidents caused by drunken drivers: 0
Fatalities: 1
Persons involved in fatal accidents: 1
Pedestrians involved in fatal accidents: 1
Fatal accident statistics in 2013:
Fatal accident count: 1
Vehicles involved in fatal accidents: 2
Fatal accidents caused by drunken drivers: 1
Fatalities: 1
Persons involved in fatal accidents: 1
Pedestrians involved in fatal accidents: 0
Home Mortgage Disclosure Act Aggregated Statistics For Year 2009 (Based on 9 full and 16 partial tracts)
A) FHA, FSA/RHS & VA Home Purchase Loans
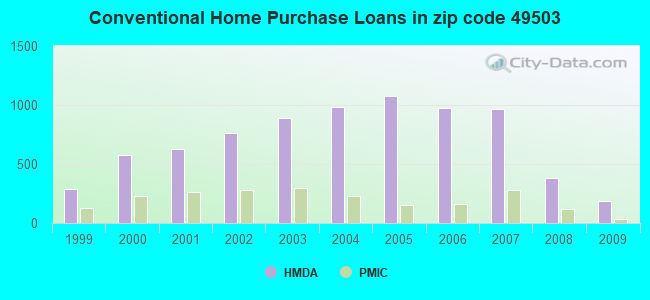
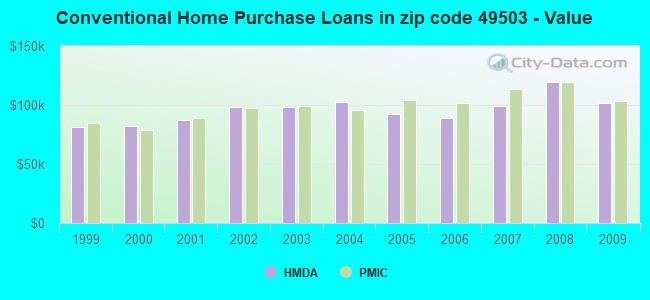
B) Conventional Home Purchase Loans
C) Refinancings
D) Home Improvement Loans
E) Loans on Dwellings For 5+ Families
F) Non-occupant Loans on < 5 Family Dwellings (A B C & D)
G) Loans On Manufactured Home Dwelling (A B C & D)
Number
Average Value
Number
Average Value
Number
Average Value
Number
Average Value
Number
Average Value
Number
Average Value
Number
Average Value
LOANS ORIGINATED
203
$98,335
189
$101,552
574
$117,195
35
$33,844
6
$2,033,930
141
$79,660
3
$78,697
APPLICATIONS APPROVED, NOT ACCEPTED
11
$87,750
8
$110,380
62
$117,228
2
$12,000
0
$0
17
$116,272
0
$0
APPLICATIONS DENIED
40
$100,040
50
$126,614
204
$127,859
32
$21,227
0
$0
61
$129,588
2
$16,550
APPLICATIONS WITHDRAWN
33
$104,524
34
$72,821
182
$106,577
5
$12,660
0
$0
25
$86,285
0
$0
FILES CLOSED FOR INCOMPLETENESS
6
$75,070
12
$90,592
47
$115,527
6
$60,095
0
$0
14
$88,139
0
$0
Aggregated Statistics For Year 2008 (Based on 9 full and 16 partial tracts)
A) FHA, FSA/RHS & VA Home Purchase Loans
B) Conventional Home Purchase Loans
C) Refinancings
D) Home Improvement Loans
E) Loans on Dwellings For 5+ Families
F) Non-occupant Loans on < 5 Family Dwellings (A B C & D)
G) Loans On Manufactured Home Dwelling (A B C & D)
Number
Average Value
Number
Average Value
Number
Average Value
Number
Average Value
Number
Average Value
Number
Average Value
Number
Average Value
LOANS ORIGINATED
131
$99,385
378
$119,436
476
$114,814
97
$27,425
17
$1,055,471
272
$96,792
0
$0
APPLICATIONS APPROVED, NOT ACCEPTED
10
$92,618
41
$136,135
58
$101,691
13
$30,946
0
$0
27
$87,136
2
$20,425
APPLICATIONS DENIED
37
$76,358
119
$107,740
306
$100,895
67
$36,432
5
$186,080
98
$90,826
7
$61,106
APPLICATIONS WITHDRAWN
18
$98,506
65
$151,387
131
$116,977
8
$15,656
1
$291,000
29
$93,319
0
$0
FILES CLOSED FOR INCOMPLETENESS
0
$0
24
$127,590
67
$112,562
7
$40,124
0
$0
9
$164,338
0
$0
Aggregated Statistics For Year 2007 (Based on 9 full and 16 partial tracts)
A) FHA, FSA/RHS & VA Home Purchase Loans
B) Conventional Home Purchase Loans
C) Refinancings
D) Home Improvement Loans
E) Loans on Dwellings For 5+ Families
F) Non-occupant Loans on < 5 Family Dwellings (A B C & D)
G) Loans On Manufactured Home Dwelling (A B C & D)
Number
Average Value
Number
Average Value
Number
Average Value
Number
Average Value
Number
Average Value
Number
Average Value
Number
Average Value
LOANS ORIGINATED
39
$109,277
964
$99,463
693
$104,850
145
$44,561
10
$221,752
388
$88,877
0
$0
APPLICATIONS APPROVED, NOT ACCEPTED
4
$86,958
86
$85,075
181
$109,641
24
$69,316
0
$0
53
$104,990
0
$0
APPLICATIONS DENIED
25
$102,632
231
$97,301
643
$111,249
142
$39,043
2
$549,725
200
$108,420
8
$42,431
APPLICATIONS WITHDRAWN
9
$159,110
103
$88,287
229
$110,375
22
$39,668
0
$0
56
$84,160
0
$0
FILES CLOSED FOR INCOMPLETENESS
0
$0
34
$138,802
64
$101,952
13
$32,585
0
$0
17
$115,842
0
$0
Aggregated Statistics For Year 2006 (Based on 9 full and 16 partial tracts)
A) FHA, FSA/RHS & VA Home Purchase Loans
B) Conventional Home Purchase Loans
C) Refinancings
D) Home Improvement Loans
E) Loans on Dwellings For 5+ Families
F) Non-occupant Loans on < 5 Family Dwellings (A B C & D)
G) Loans On Manufactured Home Dwelling (A B C & D)
Number
Average Value
Number
Average Value
Number
Average Value
Number
Average Value
Number
Average Value
Number
Average Value
Number
Average Value
LOANS ORIGINATED
67
$97,495
977
$89,084
1,061
$100,023
178
$37,906
20
$373,532
551
$94,065
0
$0
APPLICATIONS APPROVED, NOT ACCEPTED
8
$82,231
219
$84,102
285
$96,460
24
$25,892
2
$189,905
141
$90,790
0
$0
APPLICATIONS DENIED
15
$92,520
342
$104,180
842
$102,377
167
$35,829
5
$242,330
178
$115,855
5
$11,050
APPLICATIONS WITHDRAWN
15
$104,372
155
$105,448
407
$97,258
21
$79,678
0
$0
80
$125,398
1
$105,740
FILES CLOSED FOR INCOMPLETENESS
3
$81,763
21
$115,361
140
$106,137
14
$53,160
0
$0
14
$92,594
0
$0
Aggregated Statistics For Year 2005 (Based on 9 full and 16 partial tracts)
A) FHA, FSA/RHS & VA Home Purchase Loans
B) Conventional Home Purchase Loans
C) Refinancings
D) Home Improvement Loans
E) Loans on Dwellings For 5+ Families
F) Non-occupant Loans on < 5 Family Dwellings (A B C & D)
G) Loans On Manufactured Home Dwelling (A B C & D)
Number
Average Value
Number
Average Value
Number
Average Value
Number
Average Value
Number
Average Value
Number
Average Value
Number
Average Value
LOANS ORIGINATED
104
$99,194
1,079
$92,299
1,360
$99,178
223
$40,146
16
$733,518
613
$93,571
0
$0
APPLICATIONS APPROVED, NOT ACCEPTED
14
$123,676
160
$88,121
255
$99,300
27
$40,140
0
$0
66
$113,556
7
$59,894
APPLICATIONS DENIED
16
$90,132
365
$83,599
917
$95,060
185
$37,330
3
$543,533
201
$91,530
14
$59,176
APPLICATIONS WITHDRAWN
15
$89,376
244
$96,076
683
$102,486
57
$98,964
0
$0
99
$108,723
0
$0
FILES CLOSED FOR INCOMPLETENESS
2
$79,000
62
$95,851
154
$104,271
9
$44,423
0
$0
30
$99,821
1
$56,380
Aggregated Statistics For Year 2004 (Based on 9 full and 16 partial tracts)
A) FHA, FSA/RHS & VA Home Purchase Loans
B) Conventional Home Purchase Loans
C) Refinancings
D) Home Improvement Loans
E) Loans on Dwellings For 5+ Families
F) Non-occupant Loans on < 5 Family Dwellings (A B C & D)
G) Loans On Manufactured Home Dwelling (A B C & D)
Number
Average Value
Number
Average Value
Number
Average Value
Number
Average Value
Number
Average Value
Number
Average Value
Number
Average Value
LOANS ORIGINATED
152
$92,789
985
$102,740
1,518
$95,194
236
$42,305
11
$554,882
573
$97,240
4
$81,760
APPLICATIONS APPROVED, NOT ACCEPTED
11
$93,563
197
$96,393
318
$93,547
19
$40,512
0
$0
95
$93,940
3
$71,623
APPLICATIONS DENIED
39
$90,525
297
$87,644
879
$88,293
188
$31,536
0
$0
171
$91,213
7
$40,259
APPLICATIONS WITHDRAWN
18
$96,501
110
$100,356
434
$98,749
52
$38,879
1
$2,893,800
58
$87,141
5
$114,176
FILES CLOSED FOR INCOMPLETENESS
4
$87,438
35
$94,537
209
$95,274
10
$55,433
0
$0
22
$96,645
2
$81,040
Aggregated Statistics For Year 2003 (Based on 9 full and 16 partial tracts)
A) FHA, FSA/RHS & VA Home Purchase Loans
B) Conventional Home Purchase Loans
C) Refinancings
D) Home Improvement Loans
E) Loans on Dwellings For 5+ Families
F) Non-occupant Loans on < 5 Family Dwellings (A B C & D)
Number
Average Value
Number
Average Value
Number
Average Value
Number
Average Value
Number
Average Value
Number
Average Value
LOANS ORIGINATED
245
$92,534
890
$98,392
2,635
$92,506
172
$24,216
19
$657,832
636
$88,204
APPLICATIONS APPROVED, NOT ACCEPTED
15
$88,805
113
$84,364
447
$93,244
41
$25,518
4
$350,000
98
$90,231
APPLICATIONS DENIED
27
$96,762
191
$80,149
1,025
$84,090
206
$17,145
2
$43,340
152
$86,594
APPLICATIONS WITHDRAWN
16
$89,490
83
$120,606
511
$91,050
17
$31,587
0
$0
56
$93,898
FILES CLOSED FOR INCOMPLETENESS
9
$101,686
32
$85,776
187
$92,481
6
$29,578
0
$0
34
$77,601
Aggregated Statistics For Year 2002 (Based on 9 full and 16 partial tracts)
A) FHA, FSA/RHS & VA Home Purchase Loans
B) Conventional Home Purchase Loans
C) Refinancings
D) Home Improvement Loans
E) Loans on Dwellings For 5+ Families
F) Non-occupant Loans on < 5 Family Dwellings (A B C & D)
Number
Average Value
Number
Average Value
Number
Average Value
Number
Average Value
Number
Average Value
Number
Average Value
LOANS ORIGINATED
306
$84,665
759
$98,519
2,096
$89,467
168
$20,148
40
$262,324
566
$79,891
APPLICATIONS APPROVED, NOT ACCEPTED
14
$83,314
78
$93,171
291
$83,995
23
$20,080
0
$0
46
$93,015
APPLICATIONS DENIED
36
$94,678
137
$78,321
834
$77,045
198
$11,858
0
$0
117
$69,371
APPLICATIONS WITHDRAWN
33
$79,084
79
$96,272
485
$83,567
34
$31,492
0
$0
44
$81,964
FILES CLOSED FOR INCOMPLETENESS
9
$87,451
46
$97,082
160
$95,049
4
$13,945
0
$0
19
$73,169
Aggregated Statistics For Year 2001 (Based on 9 full and 16 partial tracts)
A) FHA, FSA/RHS & VA Home Purchase Loans
B) Conventional Home Purchase Loans
C) Refinancings
D) Home Improvement Loans
E) Loans on Dwellings For 5+ Families
F) Non-occupant Loans on < 5 Family Dwellings (A B C & D)
Number
Average Value
Number
Average Value
Number
Average Value
Number
Average Value
Number
Average Value
Number
Average Value
LOANS ORIGINATED
305
$81,701
624
$87,256
1,631
$84,562
248
$20,352
19
$594,102
388
$76,684
APPLICATIONS APPROVED, NOT ACCEPTED
22
$78,980
78
$69,763
245
$69,216
57
$23,869
0
$0
58
$67,471
APPLICATIONS DENIED
46
$81,518
168
$66,891
929
$63,585
293
$14,927
0
$0
135
$68,605
APPLICATIONS WITHDRAWN
27
$88,473
54
$83,725
391
$73,595
27
$35,204
2
$175,910
51
$68,047
FILES CLOSED FOR INCOMPLETENESS
12
$87,026
22
$81,069
138
$82,383
8
$27,679
0
$0
12
$52,890
Aggregated Statistics For Year 2000 (Based on 9 full and 16 partial tracts)
A) FHA, FSA/RHS & VA Home Purchase Loans
B) Conventional Home Purchase Loans
C) Refinancings
D) Home Improvement Loans
E) Loans on Dwellings For 5+ Families
F) Non-occupant Loans on < 5 Family Dwellings (A B C & D)
Number
Average Value
Number
Average Value
Number
Average Value
Number
Average Value
Number
Average Value
Number
Average Value
LOANS ORIGINATED
338
$73,649
579
$82,093
696
$61,127
259
$17,297
6
$244,477
269
$63,711
APPLICATIONS APPROVED, NOT ACCEPTED
22
$49,468
99
$71,859
193
$59,443
82
$19,955
0
$0
54
$55,370
APPLICATIONS DENIED
35
$79,152
270
$56,054
595
$53,256
330
$12,642
1
$259,000
143
$50,576
APPLICATIONS WITHDRAWN
33
$76,067
79
$75,737
244
$55,552
25
$50,478
3
$48,330
38
$51,924
FILES CLOSED FOR INCOMPLETENESS
11
$95,615
20
$84,146
112
$62,204
4
$22,210
0
$0
23
$79,399
Aggregated Statistics For Year 1999 (Based on 5 full and 8 partial tracts)
A) FHA, FSA/RHS & VA Home Purchase Loans
B) Conventional Home Purchase Loans
C) Refinancings
D) Home Improvement Loans
E) Loans on Dwellings For 5+ Families
F) Non-occupant Loans on < 5 Family Dwellings (A B C & D)
2002 - 2018 National Fire Incident Reporting System (NFIRS) incidents
Based on the data from the years 2002 - 2018 the average number of fires per year is 149. The highest number of reported fires - 192 took place in 2003, and the least - 107 in 2008. The data has a decreasing trend.
When looking into fire subcategories, the most incidents belonged to: Structure Fires (50.1%), and Outside Fires (27.2%).
Fire incident types reported to NFIRS in Zip Code 49503


 Nearest zip codes: 49507, 49505, 49506, 49504, 49509, 49525.


 Based on the data from the years 2002 - 2018 the average number of fires per year is 149. The highest number of reported fires - 192 took place in 2003, and the least - 107 in 2008. The data has a decreasing trend.
 When looking into fire subcategories, the most incidents belonged to: Structure Fires (50.1%), and Outside Fires (27.2%).