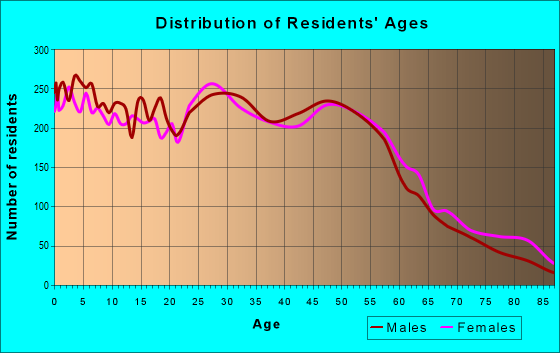
Estimated zip code population in 2022: 34,533 Zip code population in 2010: 30,524 Zip code population in 2000: 31,475
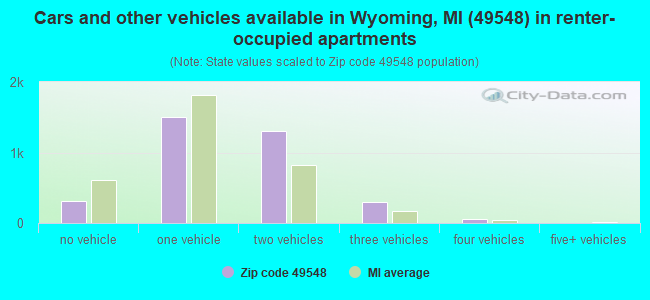
Houses and condos: 13,012 Renter-occupied apartments: 3,503
% of renters here:
28%
State:
27%
March 2022 cost of living index in zip code 49548: 84.9 (less than average, U.S. average is 100)
Land area: 10.6 sq. mi. Water area: 0.0 sq. mi.
Population density: 3,263 people per square mile
(average).
OSM Map
General Map
Google Map
MSN Map
OSM Map
General Map
Google Map
MSN Map
OSM Map
General Map
Google Map
MSN Map
OSM Map
General Map
Google Map
MSN Map
Please wait while loading the map...
Real estate property taxes paid for housing units in 2022:
This zip code:
1.3% ($2,013)
Michigan:
1.2% ($2,746)
Median real estate property taxes paid for housing units with mortgages in 2022: $2,222 (1.3%) Median real estate property taxes paid for housing units with no mortgage in 2022: $1,830 (1.6%)
Averages for the 2020 tax year for zip code 49548, filed in 2021:
Average Adjusted Gross Income (AGI) in 2020: $39,421 (Individual Income Tax Returns)
Here:
$39,421
State:
$68,945
Salary/wage: $36,193 (reported on 86.3% of returns)
Here:
$36,193
State:
$57,142
(% of AGI for various income ranges: 1130.4% for AGIs below $25k, 3631.9% for AGIs $25k-50k, 6795.6% for AGIs $50k-75k, 9978.7% for AGIs $75k-100k, 15151.9% for AGIs $100k-200k)
Taxable interest for individuals: $491 (reported on 19.9% of returns)
This zip code:
$491
Michigan:
$1,630
(% of AGI for various income ranges: 8.0% for AGIs below $25k, 5.6% for AGIs $25k-50k, 16.0% for AGIs $50k-75k, 27.6% for AGIs $75k-100k, 70.6% for AGIs $100k-200k)
Ordinary dividends: $1,832 (reported on 6.7% of returns)
Here:
$1,832
State:
$6,972
(% of AGI for various income ranges: 10.3% for AGIs below $25k, 6.3% for AGIs $25k-50k, 20.9% for AGIs $50k-75k, 38.1% for AGIs $75k-100k, 87.2% for AGIs $100k-200k)
Net capital gain/loss in AGI: +$3,936 (reported on 6.6% of returns)
Here:
+$3,936
State:
+$20,064
(% of AGI for various income ranges: 4.2% for AGIs below $25k, 6.9% for AGIs $25k-50k, 27.9% for AGIs $50k-75k, 104.4% for AGIs $75k-100k, 300.4% for AGIs $100k-200k)
Profit/loss from business: +$8,026 (reported on 12.0% of returns)
Here:
+$8,026
State:
+$11,172
(% of AGI for various income ranges: 81.6% for AGIs below $25k, 83.8% for AGIs $25k-50k, 181.9% for AGIs $50k-75k, 268.4% for AGIs $75k-100k, 563.2% for AGIs $100k-200k)
Taxable individual retirement arrangement distribution: $12,362 (reported on 5.3% of returns)
49548:
$12,362
Michigan:
$19,803
(% of AGI for various income ranges: 48.9% for AGIs below $25k, 46.0% for AGIs $25k-50k, 105.0% for AGIs $50k-75k, 251.5% for AGIs $75k-100k, 551.7% for AGIs $100k-200k)
Total itemized deductions: $29,190 (reported on 2.3% of returns)
Here:
$29,190
State:
$34,117
(% of AGI for various income ranges: 17.0% for AGIs below $25k, 75.5% for AGIs $25k-50k, 121.8% for AGIs $50k-75k, 212.0% for AGIs $75k-100k, 366.0% for AGIs $100k-200k)
Charity contributions: $8,058 (reported on 1.5% of returns)
Here:
$8,058
State:
$13,548
(% of AGI for various income ranges: 2.2% for AGIs below $25k, 7.1% for AGIs $25k-50k, 19.4% for AGIs $50k-75k, 31.5% for AGIs $75k-100k, 120.6% for AGIs $100k-200k)
Taxes paid: $4,818 (reported on 2.3% of returns)
49548:
$4,818
State:
$7,972
(% of AGI for various income ranges: 1.9% for AGIs below $25k, 8.7% for AGIs $25k-50k, 23.3% for AGIs $50k-75k, 36.8% for AGIs $75k-100k, 90.6% for AGIs $100k-200k)
Earned income credit: $2,308 (reported on 23.1% of returns)
Here:
$2,308
State:
$2,251
(% of AGI for various income ranges: 103.5% for AGIs below $25k, 79.4% for AGIs $25k-50k, 2.0% for AGIs $50k-75k)
Percentage of individuals using paid preparers for their 2020 taxes: 92.8%
Here:
93%
State:
93%
(% for various income ranges: 92.4% for AGIs below $25k, 93.6% for AGIs $25k-50k, 91.9% for AGIs $50k-75k, 92.0% for AGIs $75k-100k, 93.2% for AGIs $100k-200k, 100.0% for AGIs over 200k)
Averages for the 2012 tax year for zip code 49548, filed in 2013:
Average Adjusted Gross Income (AGI) in 2012: $31,637 (Individual Income Tax Returns)
Here:
$31,637
State:
$55,609
Salary/wage: $30,590 (reported on 86.6% of returns)
Here:
$30,590
State:
$46,782
(% of AGI for various income ranges: 78.0% for AGIs below $25k, 88.3% for AGIs $25k-50k, 86.8% for AGIs $50k-75k, 85.7% for AGIs $75k-100k, 85.4% for AGIs $100k-200k)
Taxable interest for individuals: $508 (reported on 22.1% of returns)
This zip code:
$508
Michigan:
$1,491
(% of AGI for various income ranges: 0.6% for AGIs below $25k, 0.2% for AGIs $25k-50k, 0.3% for AGIs $50k-75k, 0.3% for AGIs $75k-100k, 0.8% for AGIs $100k-200k)
Ordinary dividends: $1,631 (reported on 8.4% of returns)
Here:
$1,631
State:
$6,225
(% of AGI for various income ranges: 0.6% for AGIs below $25k, 0.3% for AGIs $25k-50k, 0.3% for AGIs $50k-75k, 0.4% for AGIs $75k-100k, 1.0% for AGIs $100k-200k)
Net capital gain/loss in AGI: +$1,867 (reported on 5.6% of returns)
Here:
+$1,867
State:
+$9,326
(% of AGI for various income ranges: 0.1% for AGIs $75k-100k, 4.2% for AGIs $100k-200k)
Profit/loss from business: +$7,613 (reported on 11.2% of returns)
Here:
+$7,613
State:
+$11,523
(% of AGI for various income ranges: 6.6% for AGIs below $25k, 2.1% for AGIs $25k-50k, 1.3% for AGIs $50k-75k, 1.5% for AGIs $75k-100k, 2.4% for AGIs $100k-200k)
Taxable individual retirement arrangement distribution: $10,147 (reported on 7.3% of returns)
49548:
$10,147
Michigan:
$15,298
(% of AGI for various income ranges: 3.0% for AGIs below $25k, 1.7% for AGIs $25k-50k, 2.3% for AGIs $50k-75k, 2.3% for AGIs $75k-100k, 4.3% for AGIs $100k-200k)
Total itemized deductions: $14,301 (24% of AGI, reported on 15.5% of returns)
Here:
$14,301
State:
$21,628
Here:
24.0% of AGI
State:
18.4% of AGI
(% of AGI for various income ranges: 4.2% for AGIs below $25k, 5.5% for AGIs $25k-50k, 8.0% for AGIs $50k-75k, 9.9% for AGIs $75k-100k, 14.4% for AGIs $100k-200k)
Charity contributions: $3,241 (reported on 11.3% of returns)
Here:
$3,241
State:
$4,225
(% of AGI for various income ranges: 0.5% for AGIs below $25k, 0.7% for AGIs $25k-50k, 1.4% for AGIs $50k-75k, 1.7% for AGIs $75k-100k, 3.5% for AGIs $100k-200k)
Taxes paid: $4,341 (reported on 15.4% of returns)
49548:
$4,341
State:
$8,327
(% of AGI for various income ranges: 0.7% for AGIs below $25k, 1.6% for AGIs $25k-50k, 2.5% for AGIs $50k-75k, 3.3% for AGIs $75k-100k, 5.4% for AGIs $100k-200k)
Earned income credit: $2,333 (reported on 27.3% of returns)
Here:
$2,333
State:
$2,306
(% of AGI for various income ranges: 7.8% for AGIs below $25k, 1.4% for AGIs $25k-50k)
Percentage of individuals using paid preparers for their 2012 taxes: 52.5%
Here:
53%
State:
57%
(% for various income ranges: 51.2% for AGIs below $25k, 54.4% for AGIs $25k-50k, 52.5% for AGIs $50k-75k, 52.9% for AGIs $75k-100k, 53.3% for AGIs $100k-200k, 100.0% for AGIs over 200k)
Averages for the 2004 tax year for zip code 49548, filed in 2005:
Average Adjusted Gross Income (AGI) in 2004: $30,808 (Individual Income Tax Returns)
Here:
$30,808
State:
$48,204
Salary/wage: $29,616 (reported on 89.7% of returns)
Here:
$29,616
State:
$42,791
(% of AGI for various income ranges: 84.3% for AGIs below $10k, 82.4% for AGIs $10k-25k, 89.8% for AGIs $25k-50k, 89.2% for AGIs $50k-75k, 88.4% for AGIs $75k-100k, 62.6% for AGIs over 100k)
Taxable interest for individuals: $845 (reported on 29.4% of returns)
This zip code:
$845
Michigan:
$1,725
(% of AGI for various income ranges: 3.2% for AGIs below $10k, 1.1% for AGIs $10k-25k, 0.6% for AGIs $25k-50k, 0.5% for AGIs $50k-75k, 0.5% for AGIs $75k-100k, 2.1% for AGIs over 100k)
Taxable dividends: $1,200 (reported on 11.8% of returns)
Here:
$1,200
State:
$3,420
(% of AGI for various income ranges: 1.5% for AGIs below $10k, 0.6% for AGIs $10k-25k, 0.3% for AGIs $25k-50k, 0.3% for AGIs $50k-75k, 0.2% for AGIs $75k-100k, 1.4% for AGIs over 100k)
Net capital gain/loss: +$3,010 (reported on 7.6% of returns)
Here:
+$3,010
State:
+$8,532
(% of AGI for various income ranges: -1.1% for AGIs below $10k, 0.1% for AGIs $10k-25k, 0.2% for AGIs $25k-50k, 0.5% for AGIs $50k-75k, 1.0% for AGIs $75k-100k, 6.6% for AGIs over 100k)
Profit/loss from business: +$5,095 (reported on 10.1% of returns)
Here:
+$5,095
State:
+$9,547
(% of AGI for various income ranges: 6.4% for AGIs below $10k, 2.8% for AGIs $10k-25k, 1.5% for AGIs $25k-50k, 1.5% for AGIs $50k-75k, 0.7% for AGIs $75k-100k, 0.1% for AGIs over 100k)
IRA payment deduction: $2,290 (reported on 1.3% of returns)
49548:
$2,290
Michigan:
$2,875
(% of AGI for various income ranges: 0.2% for AGIs $10k-25k, 0.1% for AGIs $25k-50k, 0.1% for AGIs $50k-75k, 0.1% for AGIs $75k-100k)
Self-employed pension: $3,538 (reported on 0.1% of returns)
Here:
$3,538
Michigan:
$13,826
Total itemized deductions: $12,882 (25% of AGI, reported on 25.3% of returns)
Here:
$12,882
State:
$18,509
Here:
24.8% of AGI
State:
20.7% of AGI
(% of AGI for various income ranges: 6.8% for AGIs below $10k, 6.5% for AGIs $10k-25k, 10.0% for AGIs $25k-50k, 12.2% for AGIs $50k-75k, 13.4% for AGIs $75k-100k, 14.5% for AGIs over 100k)
Charity contributions deductions: $2,570 (5% of AGI, reported on 19.6% of returns)
Here:
$2,570
State:
$3,365
Here:
4.8% of AGI
State:
3.6% of AGI
(% of AGI for various income ranges: 0.7% for AGIs below $10k, 0.7% for AGIs $10k-25k, 1.2% for AGIs $25k-50k, 2.1% for AGIs $50k-75k, 2.9% for AGIs $75k-100k, 3.0% for AGIs over 100k)
Total tax: $3,279 (reported on 69.4% of returns)
49548:
$3,279
State:
$7,691
(% of AGI for various income ranges: 2.1% for AGIs below $10k, 3.7% for AGIs $10k-25k, 6.3% for AGIs $25k-50k, 8.1% for AGIs $50k-75k, 10.3% for AGIs $75k-100k, 16.9% for AGIs over 100k)
Earned income credit: $1,676 (reported on 21.1% of returns)
Here:
$1,676
State:
$1,737
Percentage of individuals using paid preparers for their 2004 taxes: 54.4%
Here:
54%
State:
60%
(% for various income ranges: 48.7% for AGIs below $10k, 58.2% for AGIs $10k-25k, 54.6% for AGIs $25k-50k, 54.5% for AGIs $50k-75k, 51.8% for AGIs $75k-100k, 62.4% for AGIs over 100k)
Likely homosexual households (counted as self-reported same-sex unmarried-partner households)
Lesbian couples: 0.5% of all households
Gay men: 0.2% of all households
Household received Food Stamps/SNAP in the past 12 months: 2,153 Household did not receive Food Stamps/SNAP in the past 12 months: 10,484
Women who had a birth in the past 12 months: 447 (214 now married, 226 unmarried) Women who did not have a birth in the past 12 months: 7,531 (2,859 now married, 4,674 unmarried)
Housing units in zip code 49548 with a mortgage: 5,004 (388 second mortgage, 268 both second mortgage and home equity loan) Houses without a mortgage: 205
Median monthly owner costs for units with a mortgage: $1,111 Median monthly owner costs for units without a mortgage: $471
Residents with income below the poverty level in 2022:
This zip code:
14.2%
Whole state:
13.4%
Residents with income below 50% of the poverty level in 2022:
This zip code:
7.8%
Whole state:
6.9%
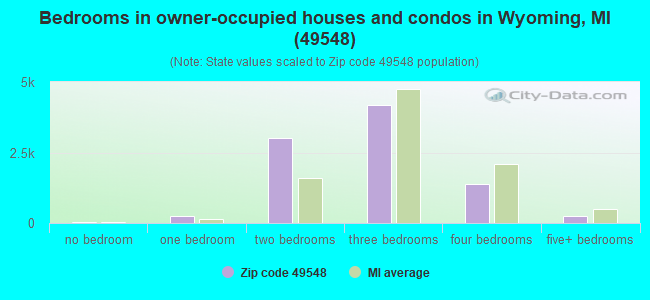
Median number of rooms in houses and condos:
Here:
5.6
State:
6.5
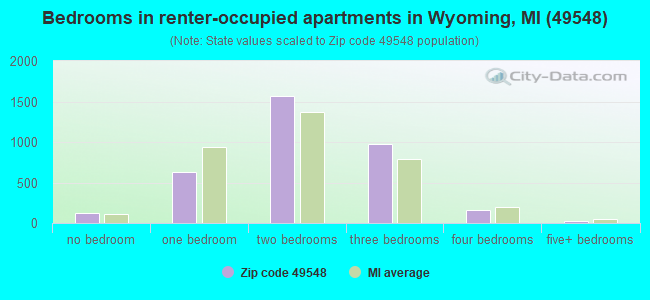
Median number of rooms in apartments:
Here:
4.2
State:
4.3
Notable locations in this zip code not listed on our city pages
Notable locations in zip code 49548: Kent Industrial Center (A), Wyoming Fire Department Station 2 (B), Cutlerville Fire Department (C), Torngren Library (D). Display/hide their locations on the map
Churches in zip code 49548 include: Madison Avenue Missionary Church (A), Garden Park Church of God (B), Home Acres Reformed Church (C), Pentecostals of Kentwood (D), Kelloggsville Christian Church (E), Immanuel Christian Reformed Church (F), Southlawn Church of God (G), Godwin Heights Christian Church (H), Grace Lutheran Church (I). Display/hide their locations on the map
Parks in zip code 49548 include: John Isaac Cutler House Historical Marker (1), Kellogg Woods Park (2), Burgis Park (3), Veteran's Memorial Park (4), Home Acres Park (5), South Lawn Park (6), Ideal Park (7), Kelloggsville Park (8), Hillcroft Park (9). Display/hide their locations on the map
4,364 married couples with children.
3,240 single-parent households (712 men, 2,528 women).
77.5% of residents of 49548 zip code speak English at home.
13.3% of residents speak Spanish at home (62% very well, 25% well, 10% not well, 2% not at all).
2.3% of residents speak other Indo-European language at home (66% very well, 6% well, 27% not well, 2% not at all).
3.6% of residents speak Asian or Pacific Island language at home (19% very well, 19% well, 48% not well, 15% not at all).
3.3% of residents speak other language at home (34% very well, 5% well, 57% not well, 4% not at all).
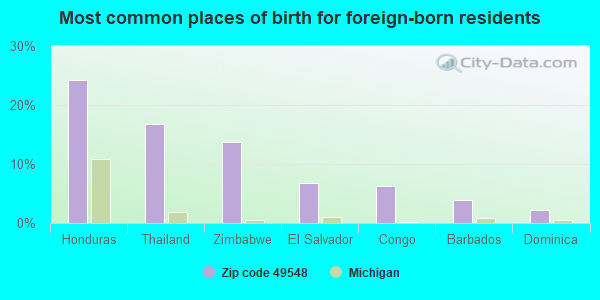
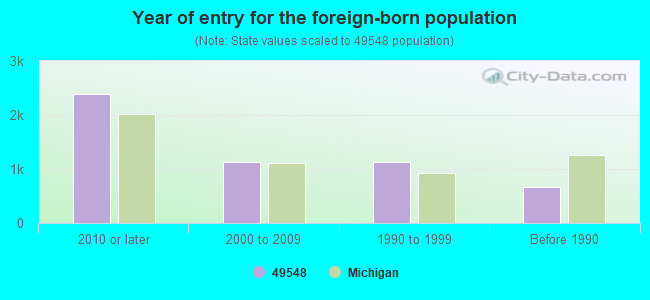
Foreign born population: 4,555 (13.2%) (37.0% of them are naturalized citizens)
Major facilities with environmental interests located in this zip code:
CHEMCENTRAL GRAND RAPIDS (2940 STAFFORD AVENUE in WYOMING, MI)
AIR SYNTHETIC MINOR (AIRS/AFS) SUPERFUND NPL (Superfund database) (Integrated Compliance Information System) - ICIS-05-1987-0224, FORMAL ENFORCEMENT ACTION CRITERIA AND HAZARDOUS AIR POLLUTANT INVENTORY (Inventory of air pollution sources) National Pollutant Discharge Elimination System NON-MAJOR (Tracking pollutant discharge elimination systems) - permit HAZARDOUS WASTE BIENNIAL REPORTER (Resource Conservation and Recovery Act (tracking hazardous waste)) Large Quantity Generators, more that 1000 kg of hazardous waste/month (Resource Conservation and Recovery Act (tracking hazardous waste)) TRI REPORTER (Tracking of toxic chemicals releasing facilities) Business SIC classification: CHEMICALS AND ALLIED PRODUCTS; NONCLASSIFIABLE ESTABLISHMENTS Organizations: CHEMCENTRAL CORPORATION (CONTACT/OPERATOR)
Alternative names: CHEM CENTRAL, CHEMCENTRAL-GRAND RAPIDS SF, CHEMCENTURAL-GRAND RAPIDS SF, WOLVERINE CHEM SOLV & REC
GENERAL MOTORS CORPORATION (300 36TH ST SW in GRAND RAPIDS, MI)
AIR SYNTHETIC MINOR (AIRS/AFS) CRITERIA AND HAZARDOUS AIR POLLUTANT INVENTORY (Inventory of air pollution sources) National Pollutant Discharge Elimination System NON-MAJOR (Tracking pollutant discharge elimination systems) - permit AIR MAJOR ("Best Available" air pollution technologies tracking) HAZARDOUS WASTE BIENNIAL REPORTER (Resource Conservation and Recovery Act (tracking hazardous waste)) Small Quantity Generators, between 100 kg and 1000 kg of hazardous waste/month (Resource Conservation and Recovery Act (tracking hazardous waste)) TRI REPORTER (Tracking of toxic chemicals releasing facilities) Business SIC classification: AUTOMOTIVE STAMPINGS; MOTOR VEHICLES AND PASSENGER CAR BODIES Business NAICS classification: MOTOR VEHICLE METAL STAMPING. Alternative names: GM MFD GRAND RAPIDS METAL CENTER, GM-NAO-GRAND RAPIDS, GMC - CPC GRAND RAPIDS METAL PLANT, GENERAL MOTORS CORPORATION CPC GRAND RAPIDS METAL PLANT, GMC GRAND RAPIDS METAL CENTER, GMC GRAND RAPIDS METAL PLANT
ELECTRO CHEMICAL FINISHING (379 44TH STREET SW in WYOMING, MI)
AIR MINOR (AIRS/AFS) CRITERIA AND HAZARDOUS AIR POLLUTANT INVENTORY (Inventory of air pollution sources) HAZARDOUS WASTE BIENNIAL REPORTER (Resource Conservation and Recovery Act (tracking hazardous waste)) Large Quantity Generators, more that 1000 kg of hazardous waste/month (Resource Conservation and Recovery Act (tracking hazardous waste)) TRI REPORTER (Tracking of toxic chemicals releasing facilities) Business SIC and NAICS classification: ELECTROPLATING, PLATING, POLISHING, ANODIZING, AND COLORING Organizations: TERRY VOLLMER (CONTACT/OPERATOR)
Alternative names: ELECTRO CHEMICAL FINISHING CO PLANT 1
GODWIN HEIGHTS SENIOR HIGH SCHOOL (50 35TH STREET SW in WYOMING, MI)
(National Center for Education Statistics) - STATE ID-01434 Conditionally Exempt Small Quantity Generators, less than 100 kg/month of hazardous waste (Resource Conservation and Recovery Act (tracking hazardous waste)) - notification Organizations: GODWIN HEIGHTS PUBLIC HS (CONTACT/OPERATOR)
, GODWIN HEIGHTS PUBLIC SCHOOLS (SCHOOL DISTRICT)
Alternative names: GODWIN HEIGHTS PUBLIC HS
DISCOVERY ALTERNATIVE H.S. (173 54TH STREET SW in GRAND RAPIDS, MI)
(National Center for Education Statistics) - STATE ID-03308 Organizations: KELLOGGSVILLE PUBLIC SCHOOLS (SCHOOL DISTRICT)
GODWIN HEIGHTS MIDDLE SCHOOL (111 36TH STREET SE in WYOMING, MI)
(National Center for Education Statistics) - STATE ID-04004 Organizations: GODWIN HEIGHTS PUBLIC SCHOOLS (SCHOOL DISTRICT)
GODWIN HEIGHTS LEARNING CENTER (3333 SOUTH DIVISION in WYOMING, MI)
(National Center for Education Statistics) - STATE ID-08423 Organizations: GODWIN HEIGHTS PUBLIC SCHOOLS (SCHOOL DISTRICT)
MD ENTERPRISES,D/B/A ENAMELITE INDUST. (3829 ROGER B CHAFFEE BLVD SE in GRAND RAPIDS, MI)
AIR MINOR (AIRS/AFS) CRITERIA AND HAZARDOUS AIR POLLUTANT INVENTORY (Inventory of air pollution sources) HAZARDOUS WASTE BIENNIAL REPORTER (Resource Conservation and Recovery Act (tracking hazardous waste)) Small Quantity Generators, between 100 kg and 1000 kg of hazardous waste/month (Resource Conservation and Recovery Act (tracking hazardous waste)) - notification Business SIC classification: MOTOR VEHICLE PARTS AND ACCESSORIES; NONCLASSIFIABLE ESTABLISHMENTS Business NAICS classification: ALL OTHER MISCELLANEOUS MANUFACTURING. Organizations: ROGER ROLLMAN (CONTACT/OPERATOR)
, RAY BROWN (CONTACT/OWNER)
Alternative names: ENAMELITE INDUSTRIES INC, MD ENTERPRISES DBA ENAMELITE INDUSTRIES
EAST KELLOGGSVILLE SCHOOL (4656 JEFFERSON SE in GRAND RAPIDS, MI)
(National Center for Education Statistics) - STATE ID-01023 Organizations: KELLOGGSVILLE PUBLIC SCHOOLS (SCHOOL DISTRICT)
DYNA PLATE INCORPORATED (344 MART STREET SW in GRAND RAPIDS, MI)
HAZARDOUS WASTE BIENNIAL REPORTER (Resource Conservation and Recovery Act (tracking hazardous waste)) Large Quantity Generators, more that 1000 kg of hazardous waste/month (Resource Conservation and Recovery Act (tracking hazardous waste)) Business NAICS classification: ELECTROPLATING, PLATING, POLISHING, ANODIZING, AND COLORING. Organizations: CRAIG HILL (CONTACT/OPERATOR)
METAL COMPONENTS INCORPORATED (3281 ROGER CHAFFEE DRIVE in WYOMING, MI)
AIR SYNTHETIC MINOR (AIRS/AFS) CRITERIA AND HAZARDOUS AIR POLLUTANT INVENTORY (Inventory of air pollution sources) Conditionally Exempt Small Quantity Generators, less than 100 kg/month of hazardous waste (Resource Conservation and Recovery Act (tracking hazardous waste)) TRI REPORTER (Tracking of toxic chemicals releasing facilities) Business SIC classification: OFFICE FURNITURE, EXCEPT WOOD; FABRICATED METAL PRODUCTS Business NAICS classification: SHEET METAL WORK MANUFACTURING. Organizations: STAGOOD INC (CONTACT/OWNER)
, STOW DAVIS FURNITURE CO (CONTACT/OWNER)
Alternative names: METAL COMPONENT LLC, STOW DAVIS METAL PRODUCTS DIV
ACI PARTS WAREHOUSING (330 32ND ST SE in WYOMING, MI)
(Resource Conservation and Recovery Act (tracking hazardous waste)) Organizations: ACI PARTS WAREHOUSING INC (CONTACT/OWNER)
, SHIRLEY VANKOEVERING (PROPERTY OWNER) (CONTACT/OWNER)
FARMLAND DAIRIES (5252 CLAY SW in WYOMING, MI)
(Resource Conservation and Recovery Act (tracking hazardous waste)) TRI REPORTER (Tracking of toxic chemicals releasing facilities) Business SIC classification: FLUID MILK Organizations: PARMALAT WHITE KNIGHT (CONTACT/OPERATOR)
Alternative names: FARMLAND DARIRIES, PARMALAT, PARMALAT WHITE KNIGHT PACKAGING
Housing units lacking complete plumbing facilities: 0.3% Housing units lacking complete kitchen facilities: 1.6%
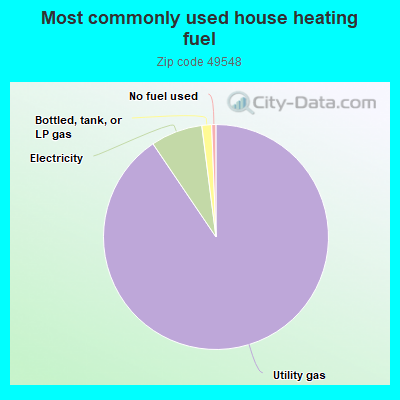
89.9%Utility gas
7.4%Electricity
1.4%Bottled, tank, or LP gas
0.6%No fuel used
Population in 1990: 32,054.
Place of birth for U.S.-born residents:
This state: 25,151
Northeast: 440
Midwest: 1,889
South: 1,019
West: 761
55% of the 49548 zip code residents lived in the same house 5 years ago. Out of people who lived in different houses, 76% lived in this county. Out of people who lived in different counties, 50% lived in Michigan.
89% of the 49548 zip code residents lived in the same house 1 year ago. Out of people who lived in different houses, 72% moved from this county. Out of people who lived in different houses, 16% moved from different county within same state. Out of people who lived in different houses, 6% moved from different state. Out of people who lived in different houses, 3% moved from abroad.
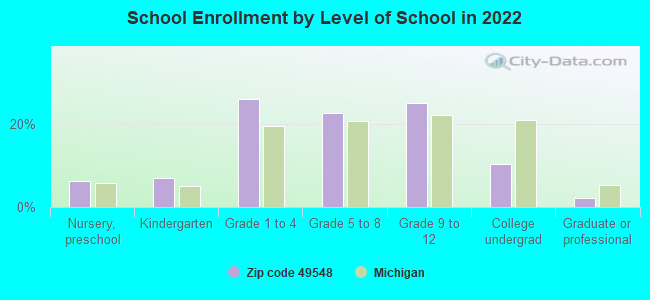
Private vs. public school enrollment:
Students in private schools in grades 1 to 8 (elementary and middle school): 266
Here:
6.4%
Michigan:
12.4%
Students in private schools in grades 9 to 12 (high school): 246
Here:
11.5%
Michigan:
9.8%
Students in private undergraduate colleges: 138
Here:
15.5%
Michigan:
14.9%
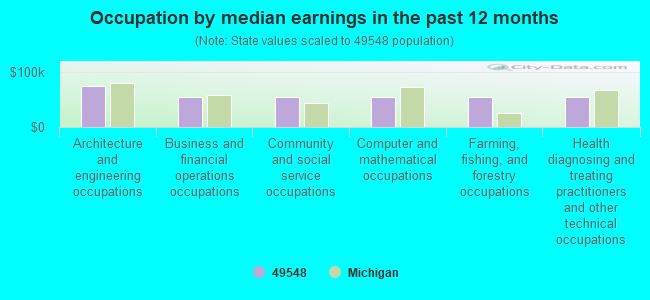
Occupation by median earnings in the past 12 months ($)
74,458Architecture and engineering occupations
54,734Business and financial operations occupations
54,510Community and social service occupations
54,426Computer and mathematical occupations
54,312Farming, fishing, and forestry occupations
53,576Health diagnosing and treating practitioners and other technical occupations
Companies with biggest federal contracts located in this zip code (GRAND RAPIDS, MI):
HOPE NETWORK SERVICES CORPORATION (3375 S DIV AVE STE 200) 1569 employees, $82136894 revenue: $811,825 in 7 contractsfrom 2000 to 2003
Contracts for Custodial Janitorial Services by Public Buildings Service, Department of Veterans Affairs Signed by year:2000: $397,000; 2001: $208,000; 2002: $207,000; 2003: -$175; 2004: $0; 2005: $0; 2006: $0.
Biggest contracts:
$208,000 with Public Buildings Service for Custodial Janitorial Services. Signed on 2001-01-15. Completion date: 2001-01-15.
$207,000, same as above.Signed on 2002-01-15. Completion date: 2003-01-15.
$199,000 with Department of Veterans Affairs for Custodial Janitorial Services. Signed on 2000-05-15. Completion date: 2000-09-15.
$198,000 with Public Buildings Service for Custodial Janitorial Services. Signed on 2000-01-15. Completion date: 2001-01-15.
J & P INTERNATIONAL (5282 WYNDTREE LN SE; small business) 50 employees, $0 revenue. : $527,887 in 5 contractsin 2003
Contracts for Miscellaneous Vehicular Components by Army Signed by year:2000: $0; 2001: $0; 2002: $0; 2003: $527,887; 2004: $0; 2005: $0; 2006: $0.
Biggest contracts:
$237,820 with Army for Miscellaneous Vehicular Components. Signed on 2003-10-06. Completion date: 2008-12-31.
$150,242, same as above.Signed on 2003-06-16. Completion date: 2008-12-31.
$113,505, same as above.Signed on 2003-08-11. Completion date: 2008-12-31.
$26,320, same as above.Signed on 2003-10-03. Completion date: 2008-12-31.
UNIQUE TRUCK EQUIPMENT INC (6051 DIVISION AVE S; small business) : $222,821 in 14 contractsfrom 2003 to 2006
Contracts for Weapons Systems Specific Vehicular Accessories, Motor Vehicle Maintenance and Repair Shop Specialized Equipment, Pipe and Conduit, Nonmetallic, Hand Tools, Power Driven, and moreby Army, Defense Logistics Agency, Air Force Signed by year:2000: $0; 2001: $0; 2002: $0; 2003: $9,450; 2004: $32,588; 2005: $88,932; 2006: $91,851.
Biggest contracts:
$47,472 with Army for Weapons Systems Specific Vehicular Accessories. Signed on 2006-02-22. Completion date: 2006-08-16.
$39,946 with Defense Logistics Agency for Motor Vehicle Maintenance and Repair Shop Specialized Equipment. Signed on 2006-03-29. Completion date: 2006-04-27.
$31,995 with Air Force for Motor Vehicle Maintenance and Repair Shop Specialized Equipment. Signed on 2005-09-17. Completion date: 2005-10-18.
$20,003 with Army for Pipe and Conduit, Nonmetallic. Taking place in TX. Signed on 2004-09-22. Completion date: 2005-09-30.
LEEP PAVEMENT MAINTENANCE (5130 MARLOWE AVE SE)
$120,364 with Navy for Purchase of Structures and Facilities -- Other Non-Building Facilities. Taking place in HI. Signed on 2001-03-05. Completion date: 2001-09-30.
CLEAN ROOMS INTERNATIONAL INC (3718 BUCHANAN AVE SW; small business) : $97,322 in 3 contractsfrom 2001 to 2005
$44,000 with NASA for Prefabricated and Portable Buildings. Signed on 2001-09-15. Completion date: 2001-10-15.
$38,125 with NASA for Laboratory Equipment and Supplies. Signed on 2003-08-15. Completion date: 2003-10-15.
$15,197 with Army for Miscellaneous Items. Taking place in NJ. Signed on 2005-09-13. Completion date: 2005-10-14.
TRANE, DIV AMERICAN STANDARD I (3353 LOUSMA DRIVE SE) : $70,989 in 3 contractsfrom 2000 to 2003
$40,989 with Army for Air Conditioning Equipment. Signed on 2003-07-08. Completion date: 2003-07-30.
$29,000 with Public Buildings Service for Maintenance, Repair or Alteration of Real Property -- Office Buildings. Signed on 2000-02-15. Completion date: 2000-03-15.
$1,000, same as above.Signed on 2000-03-15. Completion date: 2000-03-15.
K-MAC PLASTICS , LLC (3821 CLAY AVE SW; small business) : $38,100 in 2 contractsin 2006
$37,707 with Army for Miscellaneous Fabricated Nonmetallic Materials. Signed on 2006-02-02. Completion date: 2006-04-03.
$393, same as above.Signed on 2006-02-16. Completion date: 2006-04-03.
WHEELER ELECTRONIC BUSINESS MA (16 FRONTENAC ST SE; small business) : $35,150 in 5 contractsfrom 2004 to 2005
Contracts for Office Devices and Accessories, Typewriters and Office Type Composing Machines, Office Furniture, Sound Recording and Reproducing Equipment by Army, Bureau of Prisoners/Federal Prison System Signed by year:2000: $0; 2001: $0; 2002: $0; 2003: $0; 2004: $12,652; 2005: $22,498; 2006: $0.
Biggest contracts:
$9,483 with Army for Office Devices and Accessories. Signed on 2004-09-08. Completion date: 2004-09-30.
$8,200 with Bureau of Prisoners/Federal Prison System for Typewriters and Office Type Composing Machines. Signed on 2005-01-18. Completion date: 2005-03-30.
$8,070 with Army for Office Furniture. Signed on 2005-09-30. Completion date: 2005-10-12.
$6,228 with Army for Sound Recording and Reproducing Equipment. Taking place in NC. Signed on 2005-01-21. Completion date: 2005-02-18.
A I S CONSTRUCTION EQUIPMENT C (600 44TH ST SW) : $19,760 in 2 contractsin 2005
$9,880 with Army for Certifications and Accreditations for Educational Institutions. Taking place in WI. Signed on 2005-04-25. Completion date: 2005-05-13.
$9,880 with U.S. Army Corps of Engineers - civil program financing only for Certifications and Accreditations for Educational Institutions. Taking place in WI. Signed on 2005-04-25. Completion date: 2005-05-13.
DH-1, LLC (510 68TH ST SW; small business)
$8,171 with Army for Trailers. Signed on 2005-08-15. Completion date: 2005-10-11.
Top industries in this zip code by the number of employees in 2005:
Wholesale Trade: Other Grocery and Related Products Merchant Wholesalers (over 1000 employees: 1 establishment, 20-49 employees: 1 establishment, 10-19 employees: 1 establishment, 1-4 employees: 1 establishment)
Administrative and Support and Waste Management and Remediation Services: Temporary Help Services (250-499: 1, 100-249: 3, 50-99: 1, 20-49: 2, 10-19: 1)
2002 - 2018 National Fire Incident Reporting System (NFIRS) incidents
Based on the data from the years 2002 - 2018 the average number of fires per year is 96. The highest number of reported fires - 150 took place in 2018, and the least - 48 in 2011. The data has an increasing trend.
When looking into fire subcategories, the most incidents belonged to: Structure Fires (45.3%), and Mobile Property/Vehicle Fires (25.7%).
Fire incident types reported to NFIRS in Zip Code 49548


 Nearest zip codes: 49509, 49508, 49507, 49519, 49506, 49503.
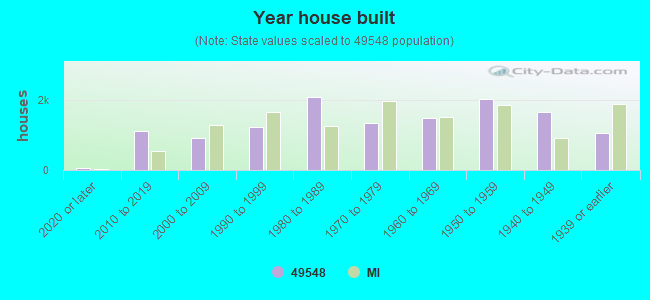


 Based on the data from the years 2002 - 2018 the average number of fires per year is 96. The highest number of reported fires - 150 took place in 2018, and the least - 48 in 2011. The data has an increasing trend.
 When looking into fire subcategories, the most incidents belonged to: Structure Fires (45.3%), and Mobile Property/Vehicle Fires (25.7%).