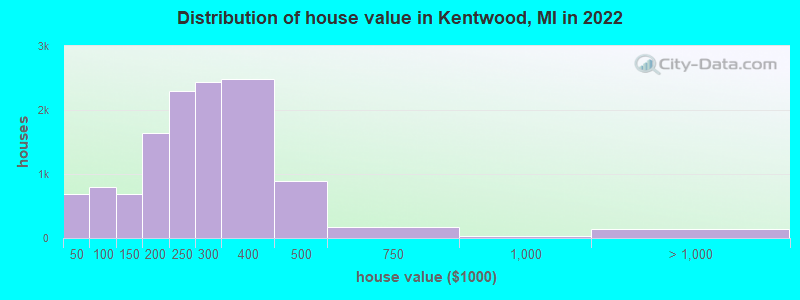
Estimated median house or condo value in 2022: $263,552 (it was $114,000 in 2000)
Kentwood:
$263,552
MI:
$224,400
Mean prices in 2022:all housing units: $264,632; detached houses: $297,829; townhouses or other attached units: $180,981; in 2-unit structures: $306,155; in 3-to-4-unit structures: $142,524; in 5-or-more-unit structures: $152,547; mobile homes: $41,576
Median gross rent in 2022: $1,208.
March 2022 cost of living index in Kentwood: 86.2 (less than average, U.S. average is 100)
Percentage of residents living in poverty in 2022: 9.9%
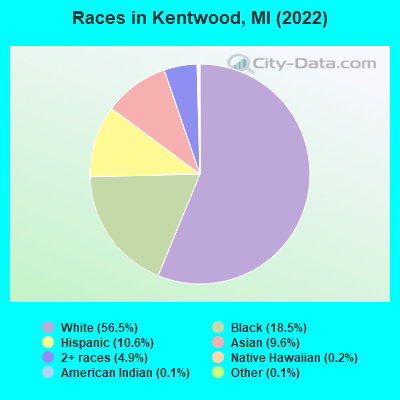
(5.7% for White Non-Hispanic residents, 26.8% for Black residents, 8.8% for Hispanic or Latino residents, 12.7% for other race residents, 10.6% for two or more races residents)
According to our research of Michigan and other state lists, there were 138 registered sex offenders living in Kentwood, Michigan as of April 27, 2024. The ratio of all residents to sex offenders in Kentwood is 375 to 1. The ratio of registered sex offenders to all residents in this city is near the state average.
Crime rates in Kentwood by year
Type
2009
2010
2011
2012
2013
2014
2015
2016
2017
2018
2019
2020
2021
2022
Murders (per 100,000)
0 (0.0)
1 (2.1)
0 (0.0)
1 (2.0)
2 (4.0)
1 (2.0)
0 (0.0)
1 (1.9)
1 (1.9)
0 (0.0)
1 (1.9)
4 (7.7)
1 (1.9)
2 (3.7)
Rapes (per 100,000)
7 (14.7)
18 (37.0)
24 (49.3)
21 (42.7)
34 (68.0)
23 (45.4)
23 (44.8)
27 (52.0)
29 (55.6)
28 (53.6)
23 (44.0)
28 (53.6)
37 (71.1)
32 (59.3)
Robberies (per 100,000)
52 (109.1)
47 (96.5)
53 (108.9)
39 (79.2)
23 (46.0)
36 (71.1)
40 (78.0)
33 (63.6)
24 (46.0)
37 (70.9)
20 (38.3)
26 (49.7)
22 (42.3)
25 (46.3)
Assaults (per 100,000)
126 (264.5)
142 (291.5)
102 (209.6)
108 (219.4)
82 (163.9)
121 (239.1)
126 (245.7)
101 (194.6)
117 (224.2)
127 (243.3)
121 (231.5)
164 (313.8)
119 (228.7)
182 (337.2)
Burglaries (per 100,000)
369 (774.5)
336 (689.8)
289 (593.8)
306 (621.7)
238 (475.8)
236 (466.2)
230 (448.5)
207 (398.9)
175 (335.3)
183 (350.6)
171 (327.1)
167 (319.5)
143 (274.9)
114 (211.2)
Thefts (per 100,000)
1,144 (2,401)
1,135 (2,330)
1,026 (2,108)
1,028 (2,089)
936 (1,871)
1,176 (2,323)
1,080 (2,106)
1,177 (2,268)
955 (1,830)
851 (1,631)
854 (1,634)
839 (1,605)
892 (1,714)
798 (1,478)
Auto thefts (per 100,000)
93 (195.2)
89 (182.7)
56 (115.1)
54 (109.7)
42 (84.0)
58 (114.6)
56 (109.2)
87 (167.6)
76 (145.6)
67 (128.4)
92 (176.0)
204 (390.3)
241 (463.2)
291 (539.1)
Arson (per 100,000)
9 (18.9)
10 (20.5)
4 (8.2)
4 (8.1)
6 (12.0)
4 (7.9)
8 (15.6)
4 (7.7)
4 (7.7)
3 (5.7)
5 (9.6)
4 (7.7)
11 (21.1)
3 (5.6)
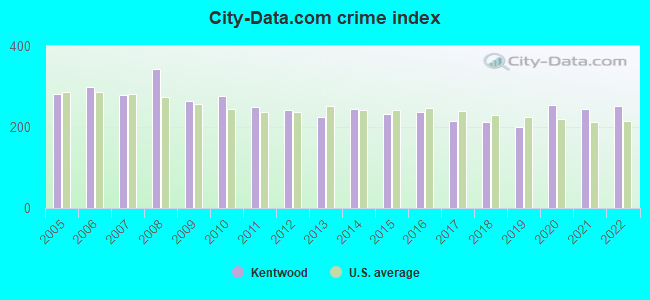
City-Data.com crime index
263.3
277.0
249.1
241.7
223.8
244.2
232.8
235.5
215.2
212.9
199.1
253.7
244.0
253.2
The City-Data.com crime index weighs serious crimes and violent crimes more heavily. Higher means more crime, U.S. average is 246.1. It adjusts for the number of visitors and daily workers commuting into cities.
- means the value is smaller than the state average. - means the value is about the same as the state average. - means the value is bigger than the state average. - means the value is much bigger than the state average.
Latest news from Kentwood, MI collected exclusively by city-data.com from local newspapers, TV, and radio stations
Ancestries: Dutch (11.5%), German (8.0%), Liberian (5.0%), English (4.8%), American (4.7%), Yugoslavian (4.4%).
Current Local Time: EST time zone
Elevation: 689 feet
Land area: 21.0 square miles.
Population density: 2,570 people per square mile (average).
9,896 residents are foreign born (8.0% Asia, 4.2% Africa, 3.5% Europe, 2.5% Latin America).
This city:
18.3%
Michigan:
6.9%
Median real estate property taxes paid for housing units with mortgages in 2022: $3,300 (1.2%) Median real estate property taxes paid for housing units with no mortgage in 2022: $2,938 (1.2%)
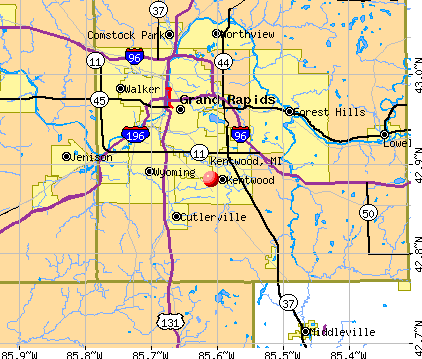
Nearest city with pop. 50,000+: Wyoming, MI (4.7 miles , pop. 69,368).
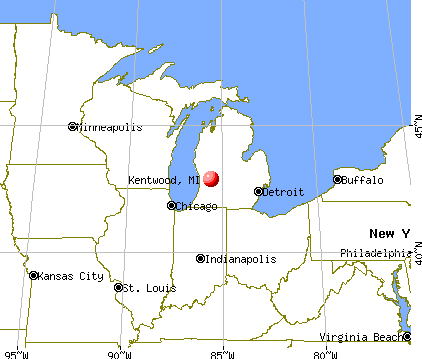
Nearest city with pop. 200,000+: Milwaukee, WI (119.3 miles , pop. 596,974).
Nearest city with pop. 1,000,000+: Chicago, IL (128.0 miles , pop. 2,896,016).
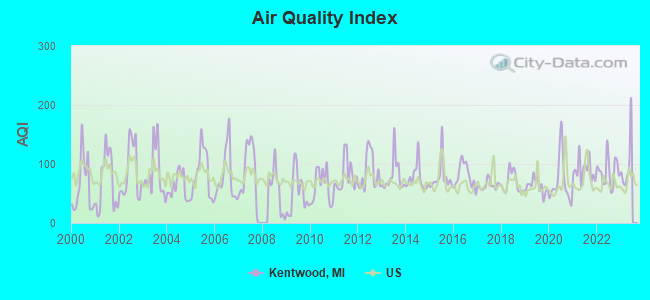
Air Quality Index (AQI) level in 2022 was 87.0. This is about average.
City:
87.0
U.S.:
72.6
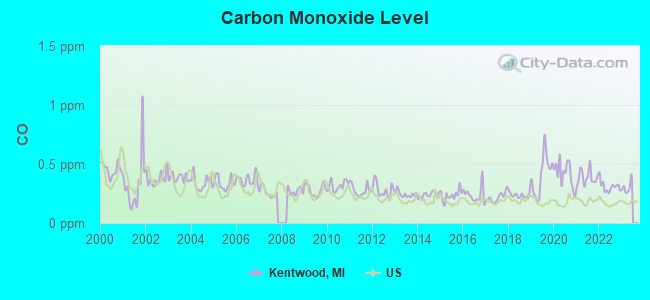
Carbon Monoxide (CO) [ppm] level in 2022 was 0.310. This is worse than average.Closest monitor was 7.2 miles away from the city center.
City:
0.310
U.S.:
0.251
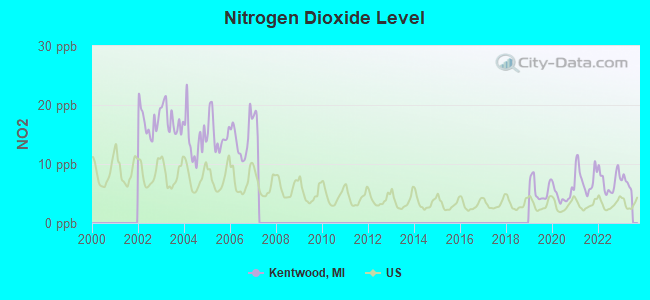
Nitrogen Dioxide (NO2) [ppb] level in 2022 was 7.01. This is worse than average.Closest monitor was 6.3 miles away from the city center.
City:
7.01
U.S.:
5.11
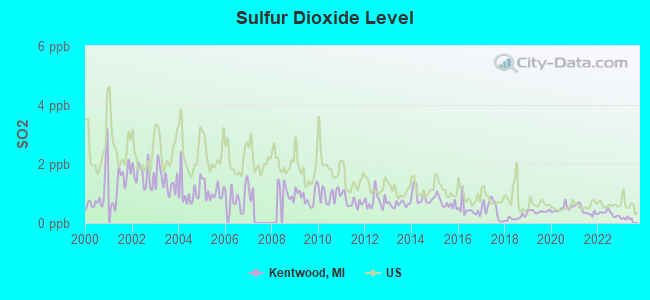
Sulfur Dioxide (SO2) [ppb] level in 2022 was 0.321. This is significantly better than average.Closest monitor was 6.3 miles away from the city center.
City:
0.321
U.S.:
1.515
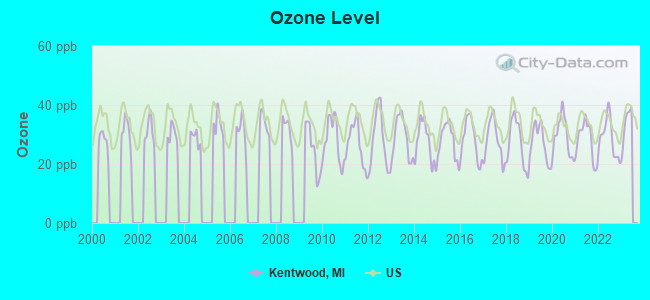
Ozone [ppb] level in 2022 was 28.8. This is about average.Closest monitor was 7.2 miles away from the city center.
City:
28.8
U.S.:
33.3
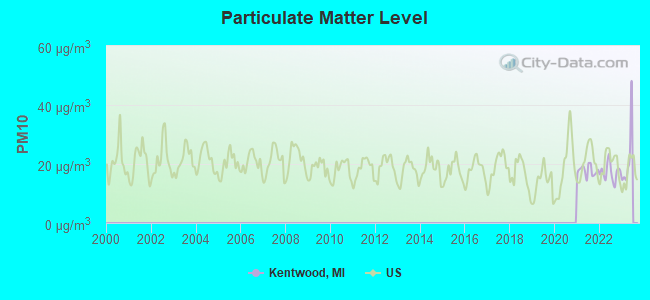
Particulate Matter (PM10) [µg/m3] level in 2022 was 17.2. This is about average.Closest monitor was 6.2 miles away from the city center.
City:
17.2
U.S.:
19.2
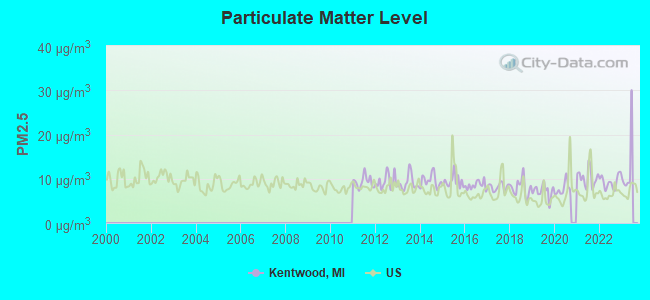
Particulate Matter (PM2.5) [µg/m3] level in 2022 was 9.31. This is about average.Closest monitor was 6.2 miles away from the city center.
City:
9.31
U.S.:
8.11
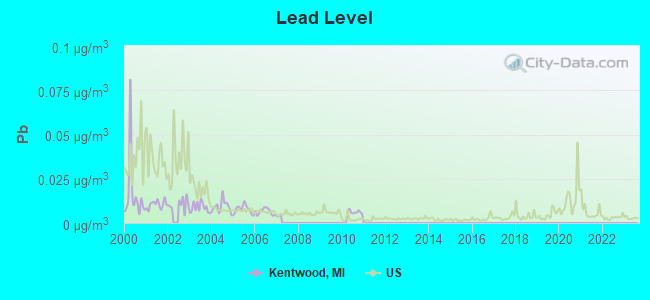
Lead (Pb) [µg/m3] level in 2010 was 0.00613. This is significantly better than average.Closest monitor was 4.7 miles away from the city center.
City:
0.00613
U.S.:
0.00931
Tornado activity:
Kentwood-area historical tornado activity is slightly above Michigan state average. It is 12% greater than the overall U.S. average.
On 4/3/1956, a category F5 (max. wind speeds 261-318 mph) tornado 34.3 miles away from the Kentwood city center killed 18 peopleand injured 340 peopleand causedbetween $50,000 and $500,000 in damages.
On 4/11/1965, a category F4 (max. wind speeds 207-260 mph) tornado 18.4 miles away from the city center killed 5 peopleand injured 142 peopleand causedbetween $500,000 and $5,000,000 in damages.
Earthquake activity:
Kentwood-area historical earthquake activity is significantly above Michigan state average. It is 26% smaller than the overall U.S. average.
On 5/2/2015 at 16:23:07, a magnitude 4.2 (4.2 MW, Depth: 2.8 mi, Class: Light, Intensity: IV - V) earthquake occurred 45.7 miles away from Kentwood center On 1/31/1986 at 16:46:43, a magnitude 5.0 (5.0 MB, Class: Moderate, Intensity: VI - VII) earthquake occurred 244.4 miles away from Kentwood center On 9/25/1998 at 19:52:52, a magnitude 5.2 (4.8 MB, 4.3 MS, 5.2 LG, 4.5 MW, Depth: 3.1 mi) earthquake occurred 283.9 miles away from the city center On 4/18/2008 at 09:36:59, a magnitude 5.4 (5.1 MB, 4.8 MS, 5.4 MW, 5.2 MW) earthquake occurred 328.9 miles away from the city center On 7/12/1986 at 08:19:37, a magnitude 4.5 (4.5 MB) earthquake occurred 174.4 miles away from Kentwood center On 6/10/1987 at 23:48:54, a magnitude 5.1 (4.9 MB, 4.4 MS, 4.6 MS, 5.1 LG) earthquake occurred 305.1 miles away from the city center Magnitude types: regional Lg-wave magnitude (LG), body-wave magnitude (MB), surface-wave magnitude (MS), moment magnitude (MW)
Natural disasters:
The number of natural disasters in Kent County (11) is smaller than the US average (15). Major Disasters (Presidential) Declared: 6 Emergencies Declared: 4
Causes of natural disasters: Storms: 5, Floods: 4, Tornadoes: 3, Winter Storms: 2, Blizzard: 1, Hurricane: 1, Snowstorm: 1, Wind: 1, Other: 1 (Note: some incidents may be assigned to more than one category).
Main business address for: AUTOCAM CORP/MI (MOTOR VEHICLE PARTS & ACCESSORIES).
Hospitals and medical centers near Kentwood:
SPECTRUM HEALTH HOSPICE (Hospital, about 1 miles away; GRAND RAPIDS, MI)
HOLLAND HOME - BRETON REHABILITATION LIVING CENTRE (Nursing Home, about 1 miles away; GRAND RAPIDS, MI)
HEARTLAND HEALTH CARE CENTER-GRAND RAPIDS (Nursing Home, about 3 miles away; GRAND RAPIDS, MI)
HOLLAND HOME - RAYBROOK MANOR (Nursing Home, about 4 miles away; GRAND RAPIDS, MI)
HOMECARE OF HOLLAND HOME (Home Health Center, about 4 miles away; GRAND RAPIDS, MI)
FAITH HOSPICE (Hospital, about 4 miles away; GRAND RAPIDS, MI)
HEARTLAND HEALTH CARE CENTER-CRESTVIEW (Nursing Home, about 4 miles away; WYOMING, MI)
Amtrak stations near Kentwood:
7 miles: GRAND RAPIDS (MARKET & WEALTHY STS.) . Services: enclosed waiting area, public restrooms, public payphones, free short-term parking, free long-term parking, call for taxi service, public transit connection.
17 miles: ROCKFORD (39 S. MAIN ST.) - Bus Station . Services: fully wheelchair accessible.
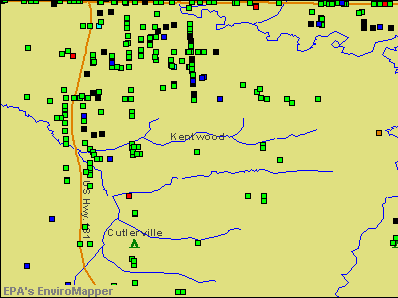
Notable locations in Kentwood: Meadowlane Golf Course (A), Christian Reformed Recreation Center and Fellowship Greens Golf Course (B), Kentwood Fire Department Station 3 (C), Kentwood Fire Department Station 2 (D), Torngren Library (E), Kentwood Library (F), Kentwood Fire Department Station 1 (G), Kentwood Police Department (H). Display/hide their locations on the map
Shopping Centers: Bretwood Mall (1), Breton Meadows Shopping Center (2), Kentwood Towne Center Mall (3), Southridge Center Mall (4), Woodland Shopping Center (5), Kentwood Shopping Center (6). Display/hide their locations on the map
Churches in Kentwood include: Church of the Holy Cross (A), Grace Apostolic Assembly (B), Madison Avenue Missionary Church (C), Garden Park Church of God (D), Home Acres Reformed Church (E), Meadow Springs Community Church (F), Faith Baptist Church (G), Word of Faith Christian Center (H), Centerpointe Church (I). Display/hide their locations on the map
Parks in Kentwood include: Breton Valley Park (1), Stanaback Park (2), Meadowbrook Park (3), Lamberts Park (4), Muuse Park (5), Bailey's Grove Park (6), Paris County Park (7), Old Farm Park (8), Pinewood Park (9). Display/hide their locations on the map
Kent County has a predicted average indoor radon screening level between 2 and 4 pCi/L (pico curies per liter) - Moderate Potential
Drinking water stations with addresses in Kentwood and their reported violations in the past:
MCL, Monthly (TCR) - In JUL-2010, Contaminant: Coliform. Follow-up actions: St Public Notif issued (JUL-06-2010), St Violation/Reminder Notice (JUL-06-2010), St Site Visit (enforcement) (JUL-08-2010), St Public Notif received (JUL-12-2010), St Compliance achieved (JUL-12-2010)
Past monitoring violations:
One routine major monitoring violation
WHISPERING PINES CONDO ASSOCIATION (Population served: 26, Groundwater):
Past monitoring violations:
4 routine major monitoring violations
Drinking water stations with addresses in Kentwood that have no violations reported:
RUSSO'S MAIN ST SPORTS BAR AND GRILL (Population served: 50,Primary Water Source Type: Groundwater)
Average household size:
This city:
2.5 people
Michigan:
2.5 people
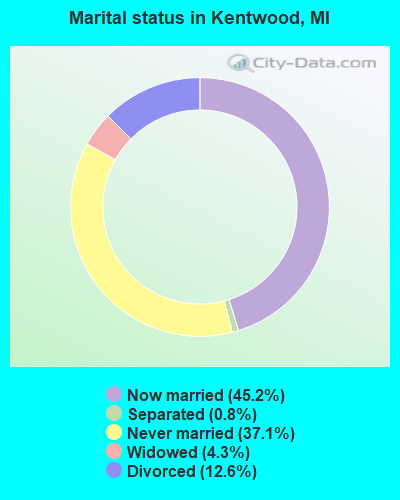
Percentage of family households:
This city:
62.5%
Whole state:
66.0%
Percentage of households with unmarried partners:
This city:
6.3%
Whole state:
6.4%
Likely homosexual households (counted as self-reported same-sex unmarried-partner households)
Lesbian couples: 0.4% of all households
Gay men: 0.2% of all households
People in group quarters in Kentwood in 2010:
132 people in residential treatment centers for juveniles (non-correctional)
127 people in group homes intended for adults
114 people in nursing facilities/skilled-nursing facilities
22 people in residential treatment centers for adults
People in group quarters in Kentwood in 2000:
125 people in nursing homes
66 people in other group homes
63 people in homes for the mentally retarded
55 people in residential treatment centers for emotionally disturbed children
38 people in homes or halfway houses for drug/alcohol abuse
10 people in other noninstitutional group quarters
5 people in homes for the mentally ill
Banks with branches in Kentwood (2011 data):
Fifth Third Bank: 6210 Kalamazoo Branch, Breton Terrace Branch, Patterson / 44th Banking Center Bran. Info updated 2009/10/05: Bank assets: $114,540.4 mil, Deposits: $89,689.1 mil, headquarters in Cincinnati, OH, positive income, Commercial Lending Specialization, 1378 total offices, Holding Company: Fifth Third Bancorp
PNC Bank, National Association: Kentwood Branch at 2380 44th Street, S.E., branch established on 1888/01/01; Marketplace Crossings Branch at 6616 Crossings Drive Se, branch established on 2009/03/02. Info updated 2012/03/20: Bank assets: $263,309.6 mil, Deposits: $197,343.0 mil, headquarters in Wilmington, DE, positive income, Commercial Lending Specialization, 3085 total offices, Holding Company: Pnc Financial Services Group, Inc., The
RBS Citizens, National Association: Grand Rapids Mi Lpo Branch at 4660 Kalamazoo Ave. Se, branch established on 2002/07/01. Info updated 2007/09/19: Bank assets: $106,940.6 mil, Deposits: $75,690.2 mil, headquarters in Providence, RI, positive income, 1135 total offices, Holding Company: Uk Financial Investments Limited
JPMorgan Chase Bank, National Association: Clocktower Branch at 6261 Kalamazoo Avenue, S.E., branch established on 1967/02/15. Info updated 2011/11/10: Bank assets: $1,811,678.0 mil, Deposits: $1,190,738.0 mil, headquarters in Columbus, OH, positive income, International Specialization, 5577 total offices, Holding Company: Jpmorgan Chase & Co.
Mercantile Bank of Michigan: Kentwood Branch at 4860 Broadmoor Avenue S.E., branch established on 2002/12/03. Info updated 2006/11/03: Bank assets: $1,428.1 mil, Deposits: $1,112.6 mil, headquarters in Grand Rapids, MI, positive income, Commercial Lending Specialization, 8 total offices, Holding Company: Mercantile Bank Corporation
Comerica Bank: 52nd Street - Kalamazoo Branch at 5135 Kalamazoo Southeast, branch established on 1980/03/12. Info updated 2011/07/29: Bank assets: $60,970.5 mil, Deposits: $48,300.9 mil, headquarters in Dallas, TX, positive income, Commercial Lending Specialization, 497 total offices, Holding Company: Comerica Incorporated
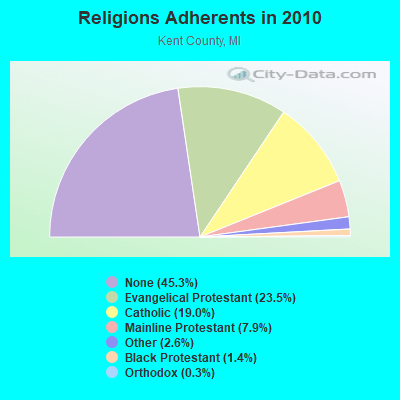
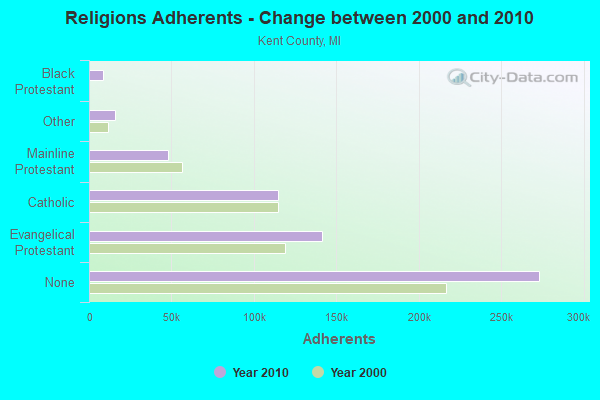
Religion statistics for Kentwood, MI (based on Kent County data)
Religion
Adherents
Congregations
Evangelical Protestant
141,345
354
Catholic
114,437
37
Mainline Protestant
47,892
117
Other
15,674
41
Black Protestant
8,454
11
Orthodox
1,730
6
None
273,090
-
Source: Clifford Grammich, Kirk Hadaway, Richard Houseal, Dale E.Jones, Alexei Krindatch, Richie Stanley and Richard H.Taylor. 2012. 2010 U.S.Religion Census: Religious Congregations & Membership Study. Association of Statisticians of American Religious Bodies. Jones, Dale E., et al. 2002. Congregations and Membership in the United States 2000. Nashville, TN: Glenmary Research Center. Graphs represent county-level data
Aircraft: DJI T600 (Category: Land, Engines: 4), Engine: Electric N-Number: 147US, N147US, N-147US, Serial Number: W21ADB21020366 Registrant (Individual): Reported Sale, 3900 S Greenbrooke Dr Se, Kentwood, MI 49512 Deregistered:Cancel Date: 05/23/2002
Aircraft: PIPER PA-28R-201 (Category: Land, Seats: 4, Weight: Up to 12,499 Pounds, Speed: 108 mph), Engine: LYCOMING I0360 SER (180 HP) (Reciprocating) N-Number: 286AA, N286AA, N-286AA, Serial Number: 28R-7837152, Year manufactured: 1978, Airworthiness Date: 02/08/1978, Certificate Issue Date: 08/08/2019 Registrant (LLC): Sky By LLC, 5808 Division Ave S, Kentwood, MI 49548 Deregistered:Cancel Date: 11/06/2008
Aircraft: CESSNA R182 (Category: Land, Seats: 4, Weight: Up to 12,499 Pounds, Speed: 111 mph), Engine: Reciprocating N-Number: 4871T, N4871T, N-4871T, Serial Number: R18201779, Airworthiness Date: 08/06/1981, Certificate Issue Date: 05/16/2007 Registrant (Individual): Benjamin J Handlogten, 1837 Mapleview St Se, Kentwood, MI 49508
Aircraft: GARRETT CRAIG G CG3 (Category: Land, Weight: Up to 12,499 Pounds), Engine: CONT MOTOR C85 SERIES (85 HP) (Reciprocating) N-Number: 7023K, N7023K, N-7023K, Serial Number: 083342, Year manufactured: 1989, Airworthiness Date: 06/30/1989, Certificate Issue Date: 01/11/2012 Registrant (Individual): Craig G Garrett, 5424 Greenboro Dr Se, Kentwood, MI 49508
Aircraft: CESSNA 560XL (Category: Land, Engines: 2, Seats: 13, Weight: 12,500 - 19,999 Pounds), Engine: P&W CANADA PW545B (4119 Pounds of Thrust) (Turbo-fan) N-Number: 721RN, N721RN, N-721RN, Serial Number: 560-5785, Year manufactured: 2008, Airworthiness Date: 04/03/2013, Certificate Issue Date: 12/09/2014 Registrant (LLC): Amd Leasing LLC, 4152 East Paris Se, Kentwood, MI 49512
Aircraft: CESSNA 182Q (Category: Land, Seats: 4, Weight: Up to 12,499 Pounds, Speed: 112 mph), Engine: CONT MOTOR O-470 SERIES (230 HP) (Reciprocating) N-Number: 759GE, N759GE, N-759GE, Serial Number: 18265976, Year manufactured: 1977, Airworthiness Date: 11/07/1977, Certificate Issue Date: 06/28/2010 Registrant (Individual): Daniel Vandyke, 3791 Shaffer Ave Se, Kentwood, MI 49512
Aircraft: PIPER PA-28-151 (Category: Land, Seats: 4, Weight: Up to 12,499 Pounds, Speed: 80 mph), Engine: LYCOMING 0-320 SERIES (180 HP) (Reciprocating) N-Number: 8233C, N8233C, N-8233C, Serial Number: 28-7615083, Year manufactured: 1975, Airworthiness Date: 12/30/1975, Certificate Issue Date: 04/26/1993 Registrant (Corporation): Airquest Aviation Inc, 4931 Kimball Ave Se, Kentwood, MI 49508
Home Mortgage Disclosure Act Aggregated Statistics For Year 2009 (Based on 8 full and 3 partial tracts)
A) FHA, FSA/RHS & VA Home Purchase Loans
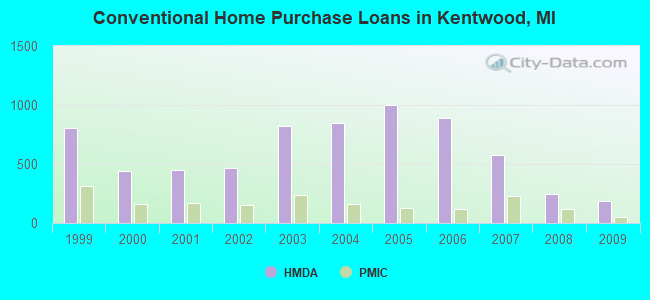
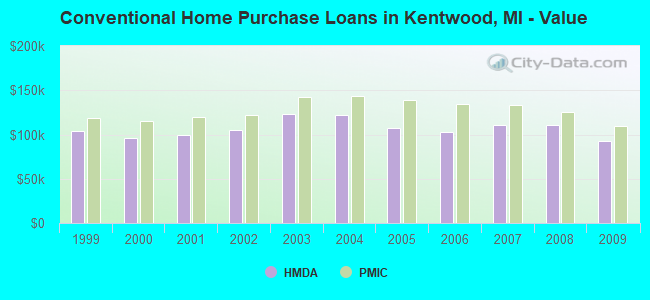
B) Conventional Home Purchase Loans
C) Refinancings
D) Home Improvement Loans
E) Loans on Dwellings For 5+ Families
F) Non-occupant Loans on < 5 Family Dwellings (A B C & D)
G) Loans On Manufactured Home Dwelling (A B C & D)
Number
Average Value
Number
Average Value
Number
Average Value
Number
Average Value
Number
Average Value
Number
Average Value
Number
Average Value
LOANS ORIGINATED
315
$109,083
185
$93,126
777
$121,454
27
$36,297
2
$542,500
55
$94,060
5
$21,078
APPLICATIONS APPROVED, NOT ACCEPTED
11
$83,123
12
$59,215
83
$138,567
5
$14,764
0
$0
6
$110,625
4
$34,000
APPLICATIONS DENIED
46
$90,632
27
$92,216
267
$127,785
29
$28,426
0
$0
13
$78,449
3
$25,390
APPLICATIONS WITHDRAWN
31
$98,849
30
$101,338
260
$131,190
2
$74,000
0
$0
11
$85,905
1
$27,000
FILES CLOSED FOR INCOMPLETENESS
5
$112,558
4
$106,995
46
$126,586
5
$99,694
0
$0
1
$109,030
0
$0
Aggregated Statistics For Year 2008 (Based on 8 full and 3 partial tracts)
A) FHA, FSA/RHS & VA Home Purchase Loans
B) Conventional Home Purchase Loans
C) Refinancings
D) Home Improvement Loans
E) Loans on Dwellings For 5+ Families
F) Non-occupant Loans on < 5 Family Dwellings (A B C & D)
G) Loans On Manufactured Home Dwelling (A B C & D)
Number
Average Value
Number
Average Value
Number
Average Value
Number
Average Value
Number
Average Value
Number
Average Value
Number
Average Value
LOANS ORIGINATED
207
$122,880
250
$110,712
418
$127,284
83
$25,963
1
$101,980
53
$107,502
5
$22,382
APPLICATIONS APPROVED, NOT ACCEPTED
11
$113,491
37
$109,075
71
$121,669
7
$27,683
0
$0
4
$101,922
5
$31,666
APPLICATIONS DENIED
35
$128,109
65
$92,609
371
$135,671
59
$30,368
0
$0
30
$101,652
9
$17,836
APPLICATIONS WITHDRAWN
23
$123,738
33
$111,287
123
$132,292
7
$61,867
0
$0
8
$75,571
0
$0
FILES CLOSED FOR INCOMPLETENESS
5
$122,556
19
$112,138
52
$134,233
4
$18,750
0
$0
6
$136,635
1
$16,690
Aggregated Statistics For Year 2007 (Based on 8 full and 3 partial tracts)
A) FHA, FSA/RHS & VA Home Purchase Loans
B) Conventional Home Purchase Loans
C) Refinancings
D) Home Improvement Loans
E) Loans on Dwellings For 5+ Families
F) Non-occupant Loans on < 5 Family Dwellings (A B C & D)
G) Loans On Manufactured Home Dwelling (A B C & D)
Number
Average Value
Number
Average Value
Number
Average Value
Number
Average Value
Number
Average Value
Number
Average Value
Number
Average Value
LOANS ORIGINATED
47
$135,086
579
$110,810
523
$113,942
117
$38,180
3
$1,804,400
73
$109,185
8
$20,310
APPLICATIONS APPROVED, NOT ACCEPTED
3
$140,333
80
$98,468
171
$123,742
20
$31,569
0
$0
12
$101,164
6
$34,098
APPLICATIONS DENIED
18
$135,154
130
$98,151
515
$137,664
76
$53,527
0
$0
43
$125,922
24
$25,978
APPLICATIONS WITHDRAWN
7
$122,176
64
$123,455
213
$128,656
16
$47,552
0
$0
17
$115,654
1
$145,000
FILES CLOSED FOR INCOMPLETENESS
1
$198,000
29
$127,598
74
$136,763
5
$56,062
0
$0
7
$131,599
0
$0
Aggregated Statistics For Year 2006 (Based on 8 full and 3 partial tracts)
A) FHA, FSA/RHS & VA Home Purchase Loans
B) Conventional Home Purchase Loans
C) Refinancings
D) Home Improvement Loans
E) Loans on Dwellings For 5+ Families
F) Non-occupant Loans on < 5 Family Dwellings (A B C & D)
G) Loans On Manufactured Home Dwelling (A B C & D)
Number
Average Value
Number
Average Value
Number
Average Value
Number
Average Value
Number
Average Value
Number
Average Value
Number
Average Value
LOANS ORIGINATED
51
$143,036
890
$102,840
730
$108,435
148
$32,519
2
$1,198,150
112
$115,429
13
$18,416
APPLICATIONS APPROVED, NOT ACCEPTED
2
$144,505
104
$109,563
176
$118,712
15
$40,442
0
$0
18
$122,816
7
$22,593
APPLICATIONS DENIED
13
$118,975
257
$99,167
591
$120,204
119
$55,145
2
$248,500
66
$109,459
45
$33,607
APPLICATIONS WITHDRAWN
6
$124,777
96
$107,213
338
$125,948
22
$60,875
0
$0
30
$112,060
1
$4,910
FILES CLOSED FOR INCOMPLETENESS
1
$148,000
26
$94,209
103
$138,795
5
$84,766
0
$0
3
$172,110
0
$0
Aggregated Statistics For Year 2005 (Based on 8 full and 3 partial tracts)
A) FHA, FSA/RHS & VA Home Purchase Loans
B) Conventional Home Purchase Loans
C) Refinancings
D) Home Improvement Loans
E) Loans on Dwellings For 5+ Families
F) Non-occupant Loans on < 5 Family Dwellings (A B C & D)
G) Loans On Manufactured Home Dwelling (A B C & D)
Number
Average Value
Number
Average Value
Number
Average Value
Number
Average Value
Number
Average Value
Number
Average Value
Number
Average Value
LOANS ORIGINATED
64
$127,943
1,002
$107,203
962
$115,041
136
$40,012
3
$17,425,627
119
$122,822
22
$18,550
APPLICATIONS APPROVED, NOT ACCEPTED
24
$102,327
223
$99,342
210
$116,559
19
$36,284
1
$60,000
19
$129,131
17
$23,988
APPLICATIONS DENIED
15
$135,099
302
$92,113
724
$124,402
114
$38,790
1
$225,000
46
$123,250
55
$27,577
APPLICATIONS WITHDRAWN
11
$124,275
188
$140,388
494
$135,096
39
$110,096
0
$0
24
$134,148
5
$26,144
FILES CLOSED FOR INCOMPLETENESS
2
$108,455
37
$122,882
130
$127,923
10
$21,426
0
$0
5
$101,864
1
$140,000
Aggregated Statistics For Year 2004 (Based on 8 full and 3 partial tracts)
A) FHA, FSA/RHS & VA Home Purchase Loans
B) Conventional Home Purchase Loans
C) Refinancings
D) Home Improvement Loans
E) Loans on Dwellings For 5+ Families
F) Non-occupant Loans on < 5 Family Dwellings (A B C & D)
G) Loans On Manufactured Home Dwelling (A B C & D)
Number
Average Value
Number
Average Value
Number
Average Value
Number
Average Value
Number
Average Value
Number
Average Value
Number
Average Value
LOANS ORIGINATED
88
$132,344
848
$122,322
1,166
$114,252
151
$36,806
0
$0
95
$121,662
21
$31,876
APPLICATIONS APPROVED, NOT ACCEPTED
25
$113,658
136
$108,449
201
$111,343
19
$28,563
1
$124,000
18
$105,936
17
$30,932
APPLICATIONS DENIED
18
$141,136
185
$103,428
566
$118,640
109
$31,074
3
$173,667
28
$115,097
47
$33,289
APPLICATIONS WITHDRAWN
12
$137,602
78
$122,718
313
$127,240
34
$48,802
0
$0
7
$112,577
2
$126,000
FILES CLOSED FOR INCOMPLETENESS
4
$115,010
34
$120,118
178
$137,238
8
$21,080
0
$0
3
$110,277
1
$18,650
Aggregated Statistics For Year 2003 (Based on 8 full and 3 partial tracts)
A) FHA, FSA/RHS & VA Home Purchase Loans
B) Conventional Home Purchase Loans
C) Refinancings
D) Home Improvement Loans
E) Loans on Dwellings For 5+ Families
F) Non-occupant Loans on < 5 Family Dwellings (A B C & D)
Number
Average Value
Number
Average Value
Number
Average Value
Number
Average Value
Number
Average Value
Number
Average Value
LOANS ORIGINATED
144
$125,346
825
$123,442
3,047
$110,016
134
$26,831
3
$417,107
125
$121,288
APPLICATIONS APPROVED, NOT ACCEPTED
9
$128,760
105
$107,964
390
$109,517
28
$17,489
1
$248,000
23
$97,357
APPLICATIONS DENIED
18
$128,238
157
$67,297
636
$103,328
103
$18,976
0
$0
24
$115,690
APPLICATIONS WITHDRAWN
8
$130,778
61
$122,756
349
$115,924
19
$30,477
0
$0
8
$104,662
FILES CLOSED FOR INCOMPLETENESS
12
$126,042
36
$123,421
157
$115,476
3
$18,100
0
$0
7
$144,959
Aggregated Statistics For Year 2002 (Based on 6 full and 1 partial tracts)
A) FHA, FSA/RHS & VA Home Purchase Loans
B) Conventional Home Purchase Loans
C) Refinancings
D) Home Improvement Loans
E) Loans on Dwellings For 5+ Families
F) Non-occupant Loans on < 5 Family Dwellings (A B C & D)
Number
Average Value
Number
Average Value
Number
Average Value
Number
Average Value
Number
Average Value
Number
Average Value
LOANS ORIGINATED
126
$117,246
462
$104,694
1,606
$99,873
146
$25,108
1
$938,000
53
$103,986
APPLICATIONS APPROVED, NOT ACCEPTED
5
$127,400
48
$85,890
230
$99,068
12
$18,297
0
$0
10
$85,300
APPLICATIONS DENIED
21
$122,634
105
$74,344
402
$93,185
85
$13,344
0
$0
14
$103,091
APPLICATIONS WITHDRAWN
8
$111,752
35
$99,755
244
$103,921
10
$46,100
0
$0
5
$113,400
FILES CLOSED FOR INCOMPLETENESS
2
$100,000
18
$95,932
104
$104,151
2
$26,735
0
$0
2
$103,500
Aggregated Statistics For Year 2001 (Based on 6 full and 1 partial tracts)
A) FHA, FSA/RHS & VA Home Purchase Loans
B) Conventional Home Purchase Loans
C) Refinancings
D) Home Improvement Loans
E) Loans on Dwellings For 5+ Families
F) Non-occupant Loans on < 5 Family Dwellings (A B C & D)
Number
Average Value
Number
Average Value
Number
Average Value
Number
Average Value
Number
Average Value
Number
Average Value
LOANS ORIGINATED
136
$115,505
451
$98,982
1,231
$95,737
157
$23,959
1
$327,000
53
$106,132
APPLICATIONS APPROVED, NOT ACCEPTED
6
$111,473
51
$73,451
139
$85,483
27
$17,214
0
$0
7
$96,857
APPLICATIONS DENIED
12
$113,083
131
$57,436
345
$81,746
110
$19,011
0
$0
14
$59,643
APPLICATIONS WITHDRAWN
9
$105,300
33
$90,665
205
$95,833
16
$25,840
0
$0
11
$106,620
FILES CLOSED FOR INCOMPLETENESS
4
$106,750
10
$119,542
80
$103,656
1
$35,000
0
$0
0
$0
Aggregated Statistics For Year 2000 (Based on 6 full and 1 partial tracts)
A) FHA, FSA/RHS & VA Home Purchase Loans
B) Conventional Home Purchase Loans
C) Refinancings
D) Home Improvement Loans
E) Loans on Dwellings For 5+ Families
F) Non-occupant Loans on < 5 Family Dwellings (A B C & D)
Number
Average Value
Number
Average Value
Number
Average Value
Number
Average Value
Number
Average Value
Number
Average Value
LOANS ORIGINATED
142
$105,995
438
$95,916
333
$69,856
174
$19,180
1
$13,000
20
$73,002
APPLICATIONS APPROVED, NOT ACCEPTED
8
$117,161
67
$63,010
89
$70,031
41
$15,507
0
$0
5
$50,200
APPLICATIONS DENIED
8
$86,514
304
$48,409
225
$63,809
90
$17,748
0
$0
22
$45,025
APPLICATIONS WITHDRAWN
9
$113,556
32
$98,833
97
$84,949
14
$60,353
0
$0
2
$46,500
FILES CLOSED FOR INCOMPLETENESS
3
$108,667
9
$105,627
46
$96,492
2
$9,000
0
$0
2
$80,500
Aggregated Statistics For Year 1999 (Based on 7 full and 3 partial tracts)
A) FHA, FSA/RHS & VA Home Purchase Loans
B) Conventional Home Purchase Loans
C) Refinancings
D) Home Improvement Loans
E) Loans on Dwellings For 5+ Families
F) Non-occupant Loans on < 5 Family Dwellings (A B C & D)
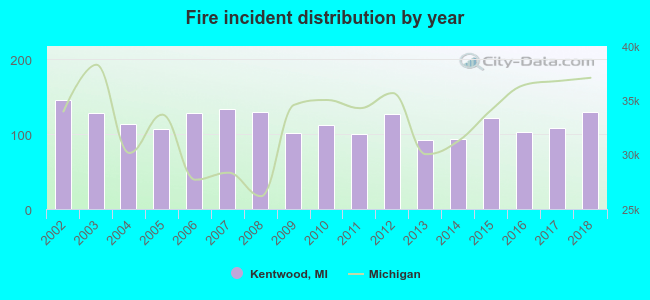
2002 - 2018 National Fire Incident Reporting System (NFIRS) incidents
According to the data from the years 2002 - 2018 the average number of fire incidents per year is 116. The highest number of reported fire incidents - 145 took place in 2002, and the least - 92 in 2013. The data has a decreasing trend.
When looking into fire subcategories, the most incidents belonged to: Structure Fires (50.2%), and Outside Fires (28.1%).
Fire incident types reported to NFIRS in Kentwood, MI
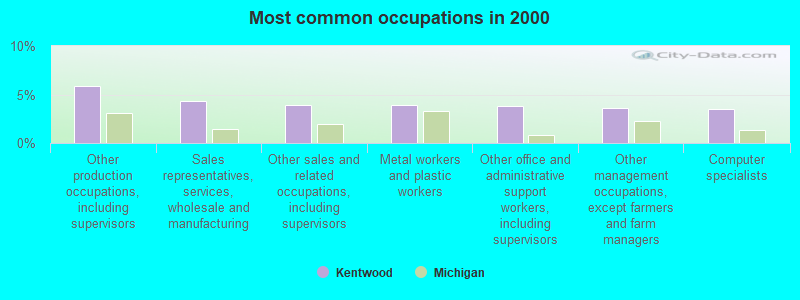
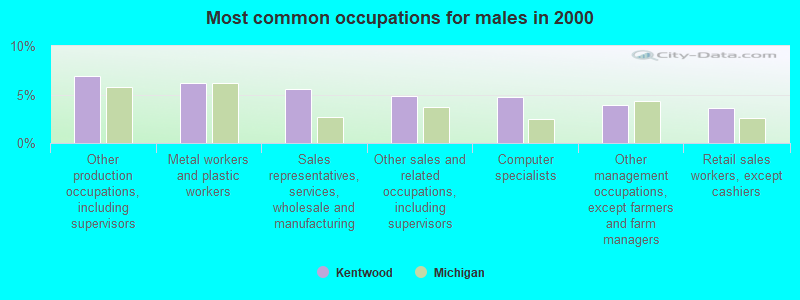
#4 on the list of "Top 101 cities with largest percentage of males in occupations: office and administrative support occupations (population 50,000+)"
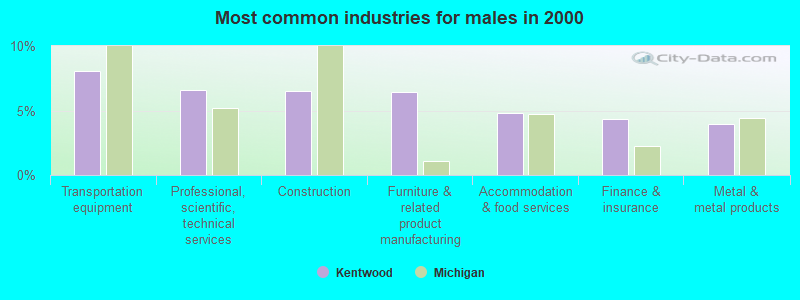
#5 on the list of "Top 101 cities with largest percentage of males in industries: manufacturing (population 50,000+)"
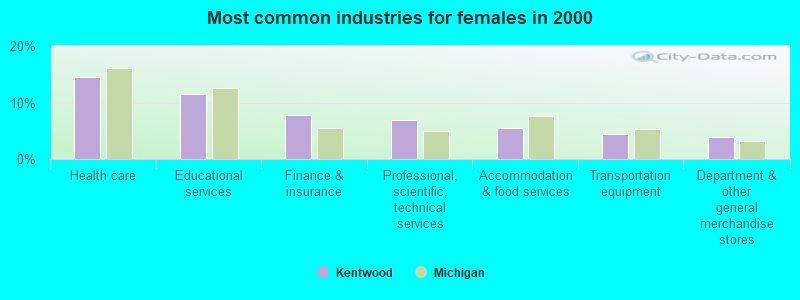
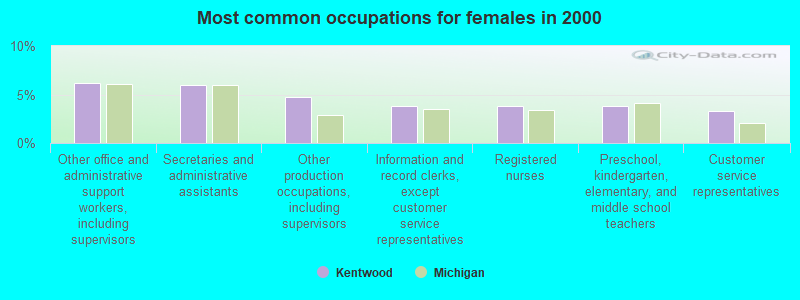
#12 on the list of "Top 101 cities with largest percentage of females in industries: manufacturing (population 50,000+)"
#13 on the list of "Top 101 cities with the highest ratio of rapes to murders between 2002 and 2012 (population 50,000+)"
#20 on the list of "Top 101 cities with largest percentage of males in occupations: production occupations (population 50,000+)"
#23 on the list of "Top 101 cities with the lowest number of murders per 100,000 residents (population 50,000+)"
#25 on the list of "Top 101 cities with the most residents born in Bosnia and Herzegovina (population 500+)"
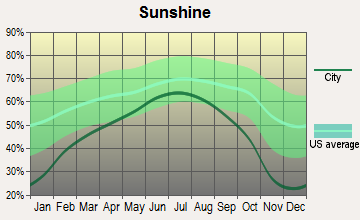
#27 on the list of "Top 101 cities with the lowest average sunshine amount (population 50,000+)"
#31 on the list of "Top 101 cities with largest percentage of females in occupations: production occupations (population 50,000+)"
#35 on the list of "Top 101 cities with the lowest minimum monthly sunshine amount (population 50,000+)"
#40 on the list of "Top 101 larger cities with the largest decrease or smallest increase in house/condo value from 2000 (population 50,000+)"
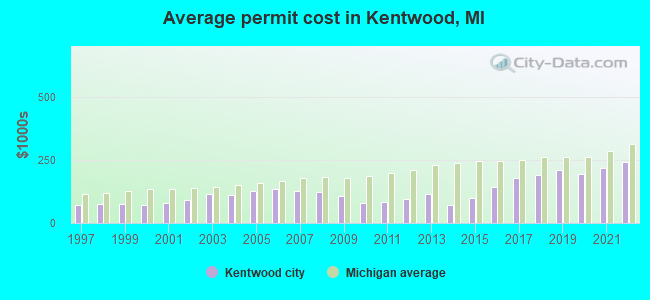
#42 on the list of "Top 101 cities with the lowest cost per building permit (population 50,000+)"
#60 on the list of "Top 101 cities with the most residents born in Other South Central Asia (population 500+)"
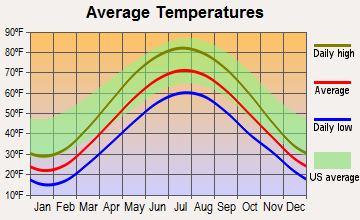
#67 on the list of "Top 101 cities with the lowest average temperatures (population 50,000+)"
#80 on the list of "Top 101 cities with the coldest winters (population 50,000+)"
#83 on the list of "Top 100 cities with highest percentage of college students (pop. 50,000+)"
#84 on the list of "Top 101 larger cities with the largest decrease or smallest increase in household income from 2000 (population 50,000+)"
#96 on the list of "Top 101 cities with the largest percentage of people in residential treatment centers for emotionally disturbed children (population 1,000+)"
#20 (49508) on the list of "Top 101 zip codes with the largest percentage of Dutch first ancestries (pop 5,000+)"
#16 on the list of "Top 101 counties with the highest carbon monoxide air pollution readings in 2012 (ppm)"
#39 on the list of "Top 101 counties with the largest decrease in the number of infant deaths per 1000 residents 2000-2006 to 2007-2013 (pop. 50,000+)"
#46 on the list of "Top 101 counties with the lowest Particulate Matter (PM10) Annual air pollution readings in 2012 (µg/m3)"
#48 on the list of "Top 101 counties with the most Evangelical Protestant adherents"
#53 on the list of "Top 101 counties with the highest percentage of residents that visited a dentist within the past year"


 Recent articles from our blog. Our writers, many of them Ph.D. graduates or candidates, create easy-to-read articles on a wide variety of topics.

 (4.7 miles
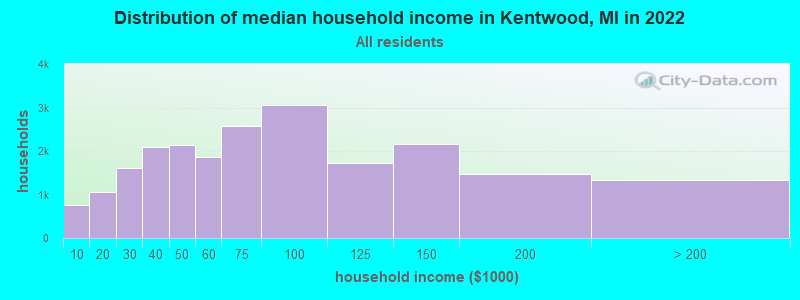


 According to the data from the years 2002 - 2018 the average number of fire incidents per year is 116. The highest number of reported fire incidents - 145 took place in 2002, and the least - 92 in 2013. The data has a decreasing trend.
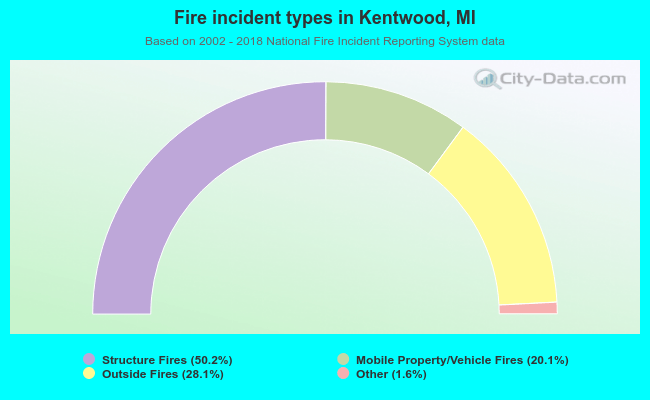 When looking into fire subcategories, the most incidents belonged to: Structure Fires (50.2%), and Outside Fires (28.1%).