Estimated zip code population in 2022: 7,433 Zip code population in 2010: 7,042 Zip code population in 2000: 7,329
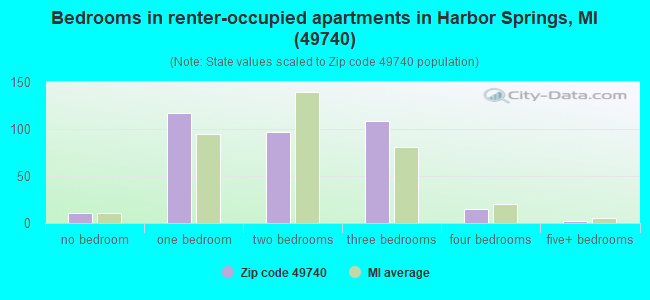
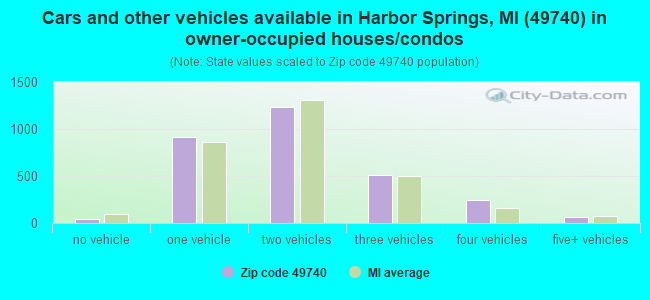
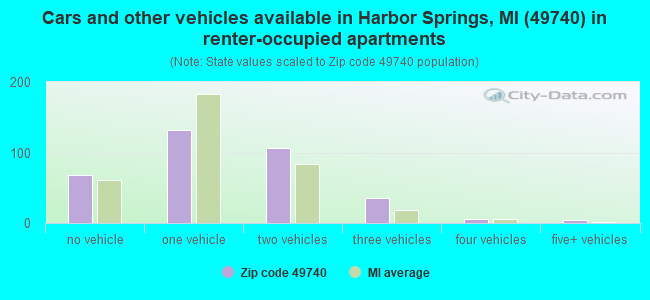
Houses and condos: 6,118 Renter-occupied apartments: 353
% of renters here:
11%
State:
27%
March 2022 cost of living index in zip code 49740: 83.4 (less than average, U.S. average is 100)
Land area: 123.7 sq. mi. Water area: 16.9 sq. mi.
Population density: 60 people per square mile
(very low).
OSM Map
General Map
Google Map
MSN Map
OSM Map
General Map
Google Map
MSN Map
OSM Map
General Map
Google Map
MSN Map
OSM Map
General Map
Google Map
MSN Map
Please wait while loading the map...
Real estate property taxes paid for housing units in 2022:
This zip code:
0.8% ($2,775)
Michigan:
1.2% ($2,746)
Median real estate property taxes paid for housing units with mortgages in 2022: $2,680 (0.8%) Median real estate property taxes paid for housing units with no mortgage in 2022: $2,919 (0.9%)
Business Search- 14 Million verified businesses
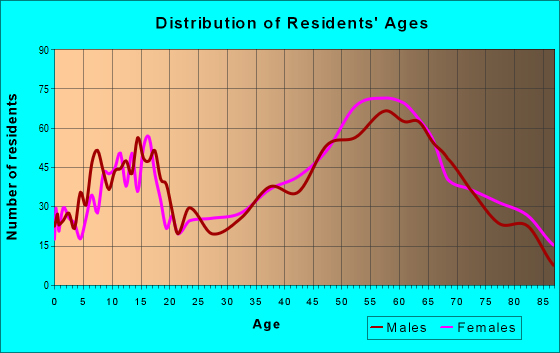
Males: 3,974
(53.5%)
Females: 3,458
(46.5%)
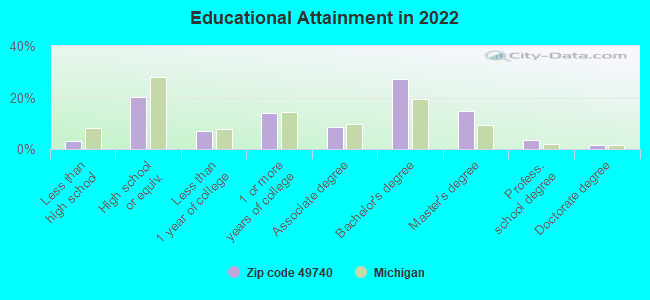
For population 25 years and over in 49740:
High school or higher: 97.3%
Bachelor's degree or higher: 47.2%
Graduate or professional degree: 20.1%
Unemployed: 3.1%
Mean travel time to work (commute): 20.1 minutes
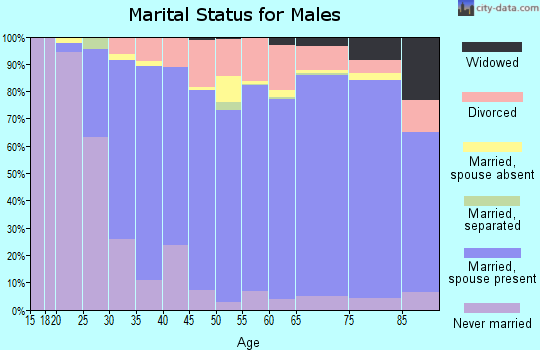
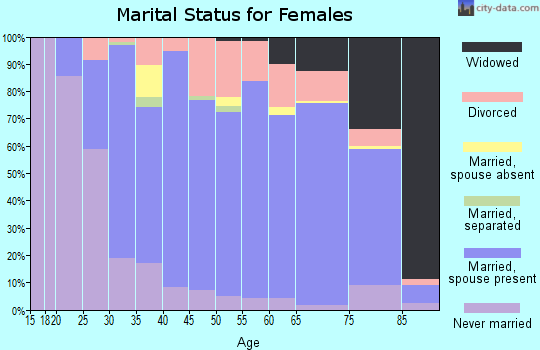
For population 15 years and over in 49740:
Never married: 20.1%
Now married: 63.1%
Separated: 0.5%
Widowed: 7.7%
Divorced: 8.6%
Zip code 49740 compared to state average:
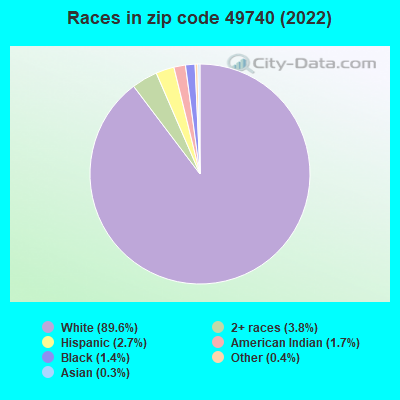
Black race population percentage significantly below state average.
Hispanic race population percentage below state average.
Median age significantly above state average.
Foreign-born population percentage significantly below state average.
Renting percentage significantly below state average.
Length of stay since moving in significantly above state average.
Percentage of population with a bachelor's degree or higher above state average.
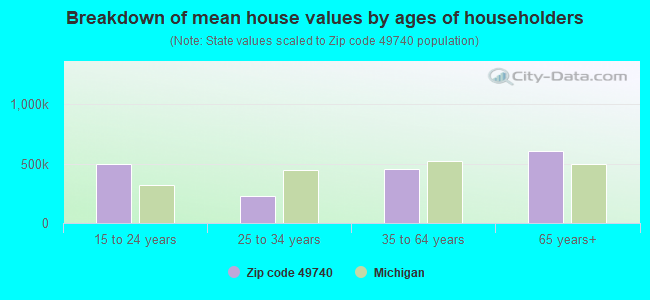
Estimated median house/condo value in 2022: $332,304
49740:
$332,304
Michigan:
$224,400
According to our research of Michigan and other state lists, there were 17 registered sex offenders living in 49740 zip code as of April 27, 2024. The ratio of all residents to sex offenders in zip code 49740 is 423 to 1. The ratio of registered sex offenders to all residents in this zip code is lower than the state average.
Median resident age:
This zip code:
55.5 years
Michigan median age:
40.3 years
Average household size:
This zip code:
2.2 people
Michigan:
2.4 people
Averages for the 2020 tax year for zip code 49740, filed in 2021:
Average Adjusted Gross Income (AGI) in 2020: $100,095 (Individual Income Tax Returns)
Here:
$100,095
State:
$68,945
Salary/wage: $57,831 (reported on 70.4% of returns)
Here:
$57,831
State:
$57,142
(% of AGI for various income ranges: 1063.1% for AGIs below $25k, 3271.9% for AGIs $25k-50k, 6270.0% for AGIs $50k-75k, 7961.9% for AGIs $75k-100k, 14119.4% for AGIs $100k-200k, 72633.8% for AGIs over 200k)
Taxable interest for individuals: $3,798 (reported on 43.8% of returns)
This zip code:
$3,798
Michigan:
$1,630
(% of AGI for various income ranges: 39.7% for AGIs below $25k, 38.7% for AGIs $25k-50k, 72.6% for AGIs $50k-75k, 155.7% for AGIs $75k-100k, 382.4% for AGIs $100k-200k, 5695.0% for AGIs over 200k)
Ordinary dividends: $19,805 (reported on 35.3% of returns)
Here:
$19,805
State:
$6,972
(% of AGI for various income ranges: 84.9% for AGIs below $25k, 119.4% for AGIs $25k-50k, 302.9% for AGIs $50k-75k, 821.4% for AGIs $75k-100k, 1933.6% for AGIs $100k-200k, 23348.8% for AGIs over 200k)
Net capital gain/loss in AGI: +$30,638 (reported on 32.9% of returns)
Here:
+$30,638
State:
+$20,064
(% of AGI for various income ranges: 13.7% for AGIs below $25k, 72.2% for AGIs $25k-50k, 251.0% for AGIs $50k-75k, 549.5% for AGIs $75k-100k, 1964.8% for AGIs $100k-200k, 41250.0% for AGIs over 200k)
Profit/loss from business: +$19,456 (reported on 19.7% of returns)
Here:
+$19,456
State:
+$11,172
(% of AGI for various income ranges: 126.3% for AGIs below $25k, 297.1% for AGIs $25k-50k, 379.4% for AGIs $50k-75k, 682.9% for AGIs $75k-100k, 1354.5% for AGIs $100k-200k, 7568.8% for AGIs over 200k)
Taxable individual retirement arrangement distribution: $34,658 (reported on 18.3% of returns)
49740:
$34,658
Michigan:
$19,803
(% of AGI for various income ranges: 98.5% for AGIs below $25k, 190.5% for AGIs $25k-50k, 511.0% for AGIs $50k-75k, 894.3% for AGIs $75k-100k, 2634.8% for AGIs $100k-200k, 15305.0% for AGIs over 200k)
Self-employed (Keogh) retirement plans: $22,250 (reported on 1.0% of returns)
49740:
$22,250
Michigan:
$25,132
(% of AGI for various income ranges: 1112.5% for AGIs over 200k)
Total itemized deductions: $41,937 (reported on 11.8% of returns)
Here:
$41,937
State:
$34,117
(% of AGI for various income ranges: 128.8% for AGIs below $25k, 174.9% for AGIs $25k-50k, 469.4% for AGIs $50k-75k, 626.7% for AGIs $75k-100k, 1433.9% for AGIs $100k-200k, 13722.5% for AGIs over 200k)
Charity contributions: $17,683 (reported on 9.9% of returns)
Here:
$17,683
State:
$13,548
(% of AGI for various income ranges: 7.6% for AGIs below $25k, 18.7% for AGIs $25k-50k, 89.0% for AGIs $50k-75k, 127.1% for AGIs $75k-100k, 280.3% for AGIs $100k-200k, 7008.8% for AGIs over 200k)
Taxes paid: $8,369 (reported on 11.8% of returns)
49740:
$8,369
State:
$7,972
(% of AGI for various income ranges: 19.5% for AGIs below $25k, 37.9% for AGIs $25k-50k, 89.4% for AGIs $50k-75k, 160.5% for AGIs $75k-100k, 367.0% for AGIs $100k-200k, 2363.8% for AGIs over 200k)
Earned income credit: $1,703 (reported on 7.7% of returns)
Here:
$1,703
State:
$2,251
(% of AGI for various income ranges: 43.1% for AGIs below $25k, 35.2% for AGIs $25k-50k)
Percentage of individuals using paid preparers for their 2020 taxes: 92.5%
Here:
93%
State:
93%
(% for various income ranges: 89.4% for AGIs below $25k, 93.2% for AGIs $25k-50k, 94.2% for AGIs $50k-75k, 94.7% for AGIs $75k-100k, 93.4% for AGIs $100k-200k, 94.9% for AGIs over 200k)
Averages for the 2012 tax year for zip code 49740, filed in 2013:
Average Adjusted Gross Income (AGI) in 2012: $84,879 (Individual Income Tax Returns)
Here:
$84,879
State:
$55,609
Salary/wage: $47,925 (reported on 74.4% of returns)
Here:
$47,925
State:
$46,782
(% of AGI for various income ranges: 64.0% for AGIs below $25k, 68.0% for AGIs $25k-50k, 61.5% for AGIs $50k-75k, 55.6% for AGIs $75k-100k, 48.9% for AGIs $100k-200k, 26.1% for AGIs over 200k)
Taxable interest for individuals: $3,295 (reported on 44.6% of returns)
This zip code:
$3,295
Michigan:
$1,491
(% of AGI for various income ranges: 1.9% for AGIs below $25k, 0.9% for AGIs $25k-50k, 2.0% for AGIs $50k-75k, 1.0% for AGIs $75k-100k, 1.2% for AGIs $100k-200k, 2.2% for AGIs over 200k)
Ordinary dividends: $16,804 (reported on 31.6% of returns)
Here:
$16,804
State:
$6,225
(% of AGI for various income ranges: 4.0% for AGIs below $25k, 2.8% for AGIs $25k-50k, 3.2% for AGIs $50k-75k, 3.8% for AGIs $75k-100k, 4.7% for AGIs $100k-200k, 8.8% for AGIs over 200k)
Net capital gain/loss in AGI: +$45,731 (reported on 28.2% of returns)
Here:
+$45,731
State:
+$9,326
(% of AGI for various income ranges: 0.3% for AGIs $25k-50k, 0.5% for AGIs $50k-75k, 1.6% for AGIs $75k-100k, 2.5% for AGIs $100k-200k, 30.0% for AGIs over 200k)
Profit/loss from business: +$21,712 (reported on 21.7% of returns)
Here:
+$21,712
State:
+$11,523
(% of AGI for various income ranges: 10.7% for AGIs below $25k, 6.0% for AGIs $25k-50k, 5.0% for AGIs $50k-75k, 5.6% for AGIs $75k-100k, 5.4% for AGIs $100k-200k, 5.1% for AGIs over 200k)
Taxable individual retirement arrangement distribution: $24,796 (reported on 18.3% of returns)
49740:
$24,796
Michigan:
$15,298
(% of AGI for various income ranges: 4.4% for AGIs below $25k, 4.0% for AGIs $25k-50k, 5.1% for AGIs $50k-75k, 6.4% for AGIs $75k-100k, 9.9% for AGIs $100k-200k, 3.7% for AGIs over 200k)
Self-employment retirement plans: $27,550 (reported on 1.0% of returns)
49740:
$27,550
Michigan:
$20,834
Total itemized deductions: $29,997 (18% of AGI, reported on 38.1% of returns)
Here:
$29,997
State:
$21,628
Here:
17.7% of AGI
State:
18.4% of AGI
(% of AGI for various income ranges: 18.6% for AGIs below $25k, 14.8% for AGIs $25k-50k, 15.1% for AGIs $50k-75k, 14.4% for AGIs $75k-100k, 15.7% for AGIs $100k-200k, 11.3% for AGIs over 200k)
Charity contributions: $5,922 (reported on 32.9% of returns)
Here:
$5,922
State:
$4,225
(% of AGI for various income ranges: 1.0% for AGIs below $25k, 1.2% for AGIs $25k-50k, 1.6% for AGIs $50k-75k, 1.7% for AGIs $75k-100k, 2.1% for AGIs $100k-200k, 3.0% for AGIs over 200k)
Taxes paid: $11,154 (reported on 38.1% of returns)
49740:
$11,154
State:
$8,327
(% of AGI for various income ranges: 3.3% for AGIs below $25k, 3.8% for AGIs $25k-50k, 4.3% for AGIs $50k-75k, 4.9% for AGIs $75k-100k, 6.1% for AGIs $100k-200k, 5.1% for AGIs over 200k)
Earned income credit: $1,773 (reported on 11.5% of returns)
Here:
$1,773
State:
$2,306
(% of AGI for various income ranges: 3.2% for AGIs below $25k, 0.9% for AGIs $25k-50k)
Percentage of individuals using paid preparers for their 2012 taxes: 60.8%
Here:
61%
State:
57%
(% for various income ranges: 51.0% for AGIs below $25k, 58.4% for AGIs $25k-50k, 63.3% for AGIs $50k-75k, 68.6% for AGIs $75k-100k, 73.9% for AGIs $100k-200k, 88.0% for AGIs over 200k)
Averages for the 2004 tax year for zip code 49740, filed in 2005:
Average Adjusted Gross Income (AGI) in 2004: $64,623 (Individual Income Tax Returns)
Here:
$64,623
State:
$48,204
Salary/wage: $41,089 (reported on 76.9% of returns)
Here:
$41,089
State:
$42,791
(% of AGI for various income ranges: 105.8% for AGIs below $10k, 67.2% for AGIs $10k-25k, 70.2% for AGIs $25k-50k, 65.2% for AGIs $50k-75k, 62.5% for AGIs $75k-100k, 34.9% for AGIs over 100k)
Taxable interest for individuals: $4,202 (reported on 56.6% of returns)
This zip code:
$4,202
Michigan:
$1,725
(% of AGI for various income ranges: 10.2% for AGIs below $10k, 3.5% for AGIs $10k-25k, 2.2% for AGIs $25k-50k, 2.2% for AGIs $50k-75k, 1.9% for AGIs $75k-100k, 4.6% for AGIs over 100k)
Taxable dividends: $9,269 (reported on 37.3% of returns)
Here:
$9,269
State:
$3,420
(% of AGI for various income ranges: 13.3% for AGIs below $10k, 3.4% for AGIs $10k-25k, 2.5% for AGIs $25k-50k, 3.9% for AGIs $50k-75k, 3.5% for AGIs $75k-100k, 6.7% for AGIs over 100k)
Net capital gain/loss: +$23,077 (reported on 33.2% of returns)
Here:
+$23,077
State:
+$8,532
(% of AGI for various income ranges: -3.7% for AGIs below $10k, 1.2% for AGIs $10k-25k, 1.0% for AGIs $25k-50k, 1.9% for AGIs $50k-75k, 3.8% for AGIs $75k-100k, 19.4% for AGIs over 100k)
Profit/loss from business: +$18,335 (reported on 21.4% of returns)
Here:
+$18,335
State:
+$9,547
(% of AGI for various income ranges: 5.6% for AGIs below $10k, 7.8% for AGIs $10k-25k, 7.7% for AGIs $25k-50k, 5.1% for AGIs $50k-75k, 6.5% for AGIs $75k-100k, 5.8% for AGIs over 100k)
IRA payment deduction: $3,103 (reported on 3.8% of returns)
49740:
$3,103
Michigan:
$2,875
(% of AGI for various income ranges: 0.3% for AGIs $10k-25k, 0.5% for AGIs $25k-50k, 0.3% for AGIs $50k-75k, 0.2% for AGIs $75k-100k, 0.1% for AGIs over 100k)
Self-employed pension: $21,556 (reported on 1.5% of returns)
Here:
$21,556
Michigan:
$13,826
Total itemized deductions: $24,168 (21% of AGI, reported on 43.2% of returns)
Here:
$24,168
State:
$18,509
Here:
21.0% of AGI
State:
20.7% of AGI
(% of AGI for various income ranges: 39.7% for AGIs below $10k, 19.1% for AGIs $10k-25k, 16.4% for AGIs $25k-50k, 19.2% for AGIs $50k-75k, 16.9% for AGIs $75k-100k, 14.4% for AGIs over 100k)
Charity contributions deductions: $3,946 (3% of AGI, reported on 38.1% of returns)
Here:
$3,946
State:
$3,365
Here:
3.2% of AGI
State:
3.6% of AGI
(% of AGI for various income ranges: 1.8% for AGIs below $10k, 1.7% for AGIs $10k-25k, 1.4% for AGIs $25k-50k, 2.2% for AGIs $50k-75k, 1.9% for AGIs $75k-100k, 2.7% for AGIs over 100k)
Total tax: $12,401 (reported on 75.4% of returns)
49740:
$12,401
State:
$7,691
(% of AGI for various income ranges: 4.1% for AGIs below $10k, 4.6% for AGIs $10k-25k, 6.9% for AGIs $25k-50k, 8.2% for AGIs $50k-75k, 10.3% for AGIs $75k-100k, 19.5% for AGIs over 100k)
Earned income credit: $1,379 (reported on 8.8% of returns)
Here:
$1,379
State:
$1,737
Percentage of individuals using paid preparers for their 2004 taxes: 64.4%
Here:
64%
State:
60%
(% for various income ranges: 53.3% for AGIs below $10k, 63.0% for AGIs $10k-25k, 63.5% for AGIs $25k-50k, 67.3% for AGIs $50k-75k, 64.2% for AGIs $75k-100k, 83.2% for AGIs over 100k)
Likely homosexual households (counted as self-reported same-sex unmarried-partner households)
Lesbian couples: 0.1% of all households
Gay men: 0.0% of all households
Household received Food Stamps/SNAP in the past 12 months: 149 Household did not receive Food Stamps/SNAP in the past 12 months: 3,165
Women who had a birth in the past 12 months: 27 (17 now married, 10 unmarried) Women who did not have a birth in the past 12 months: 1,034 (539 now married, 492 unmarried)
Housing units in zip code 49740 with a mortgage: 1,566 (196 second mortgage, 20 home equity loan, 179 both second mortgage and home equity loan) Houses without a mortgage: 58
Median monthly owner costs for units with a mortgage: $1,574 Median monthly owner costs for units without a mortgage: $610
Residents with income below the poverty level in 2022:
This zip code:
6.8%
Whole state:
13.4%
Residents with income below 50% of the poverty level in 2022:
This zip code:
3.9%
Whole state:
6.9%
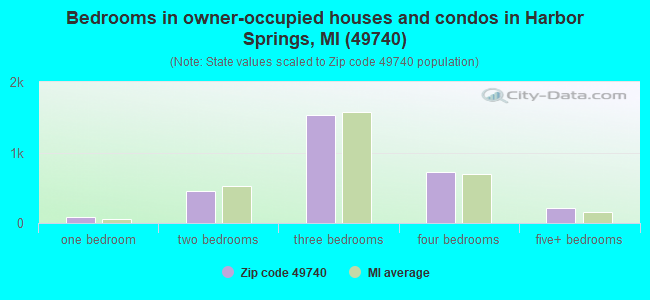
Median number of rooms in houses and condos:
Here:
6.8
State:
6.5
Median number of rooms in apartments:
Here:
4.1
State:
4.3
Notable locations in this zip code not listed on our city pages
Notable locations in zip code 49740: Ryans Corners (A), Beckons Corners (B), Johnsons Corners (C), Harbor Highlands Ski Club (D), Boyne Highlands Ski Area (E), Chestnut Valley Golf Club (F), Wequetonsing Golf Club (G), True North Golf Club (H), Harbor Point Golf Course (I), Birchwood Farm Golf and Country Club (J), Boyne Highlands Golf Course (K), Harbor Point Lighthouse (L), Little Traverse Bay Golf Club (M), Lakeshore Campground (N), Nubs Nob Ski Area (O), Little Traverse Light (P), Readmond / Friendship / Cross Village Fire and Rescue (Q), Allied Emergency Medical Services Systems (R), Blackbird Museum (S), Harbor Springs Police Department (T). Display/hide their locations on the map
Churches in zip code 49740 include: Holy Cross Church (A), Stutsmanville Chapel (B), Holy Childhood Church (C), Saint Johns Episcopal Church (D), Main Street Baptist Church (E), United Methodist Church (F), Shepherd in the Pines Lutheran Church (G), First Presbyterian Church (H), Harbor Springs Wesleyan Church (I). Display/hide their locations on the map
Cemeteries: Readmond Township Cemetery (1), Frienship Township Cemetery (2), Indian Cemetery (3), Starr Cemetery (4), Holy Cross Cemetery (5), Lakeview Cemetery (6), Beran Baptist Cemetery (7). Display/hide their locations on the map
Parks in zip code 49740 include: Zorn Park (1), Josephine Ford Park (2), Zoll Street Park (3), Holy Childhood of Jesus School Historical Marker (4), Ephraim Shay Historical Marker (5), Andrew J Blackbird House Historical Marker (6), Kosequat Park (7), Harbor Springs Kiwanis Winter Park (8), Port of Cross Village Park (9). Display/hide their locations on the map
714 married couples with children.
219 single-parent households (67 men, 152 women).
99.2% of residents of 49740 zip code speak English at home.
0.6% of residents speak Spanish at home (81% very well, 7% well, 12% not well).
0.6% of residents speak other Indo-European language at home (100% very well).
0.2% of residents speak Asian or Pacific Island language at home (25% very well, 75% well).
0.2% of residents speak other language at home (50% very well, 50% well).
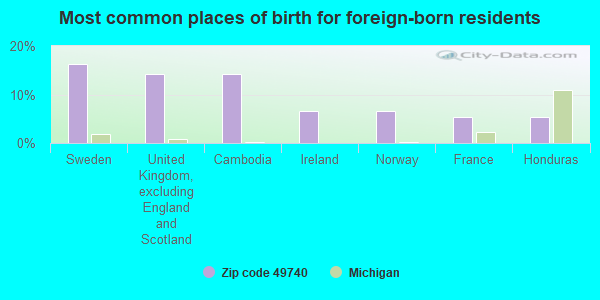
Foreign born population: 92 (1.2%) (70.6% of them are naturalized citizens)
This zip code:
1.2%
Whole state:
6.9%
16%Sweden
14%United Kingdom, excluding England and Scotland
14%Cambodia
7%Ireland
7%Norway
5%France
5%Honduras
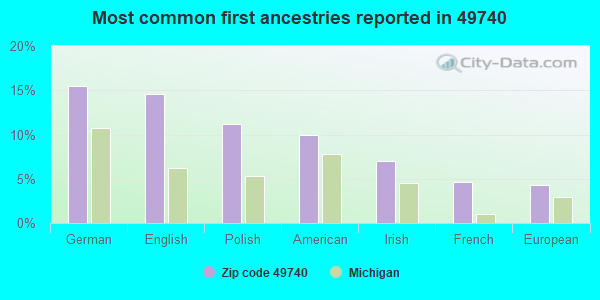
15%German
15%English
11%Polish
10%American
7%Irish
5%French
4%European
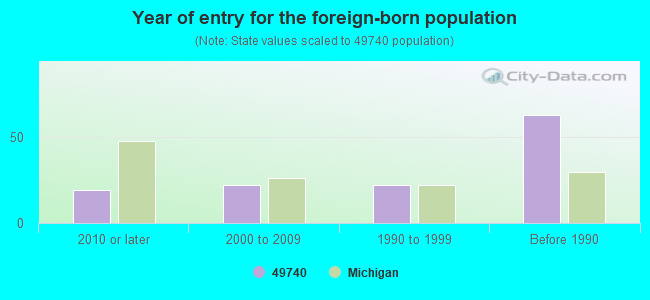
Year of entry for the foreign-born population
192010 or later
222000 to 2009
221990 to 1999
63Before 1990
Facilities with environmental interests located in this zip code:
BLACKBIRD ELEMENTARY SCHOOL (421 EAST LAKE STREET in HARBOR SPRINGS, MI)
(National Center for Education Statistics) - STATE ID-07741 Organizations: HARBOR SPRINGS SCHOOL DISTRICT (SCHOOL DISTRICT)
DEVELOPMENTAL NEEDS PRE-PRIM (421 E. LAKE ROAD in HARBOR SPRINGS, MI)
(National Center for Education Statistics) - STATE ID-07047 Organizations: CHARLEVOIX-EMMET ISD (SCHOOL DISTRICT)
EARLY TRANSITION PROGRAM (421 E. LAKE ROAD in HARBOR SPRINGS, MI)
(National Center for Education Statistics) - STATE ID-07049 Organizations: CHARLEVOIX-EMMET ISD (SCHOOL DISTRICT)
FISHERS CROSSLAND FURNITURE (891 W CONWAY RD in HARBOR SPRINGS, MI)
(Resource Conservation and Recovery Act (tracking hazardous waste))
BIRCHWOOD CONSTRUCTION (165 FRANKLIN PARK in HARBOR SPRINGS, MI)
Conditionally Exempt Small Quantity Generators, less than 100 kg/month of hazardous waste (Resource Conservation and Recovery Act (tracking hazardous waste)) Organizations: BIRCHWOOD CONSTRUCTION COMPANY (CONTACT/OPERATOR)
Housing units lacking complete plumbing facilities: 0.4% Housing units lacking complete kitchen facilities: 0.6%
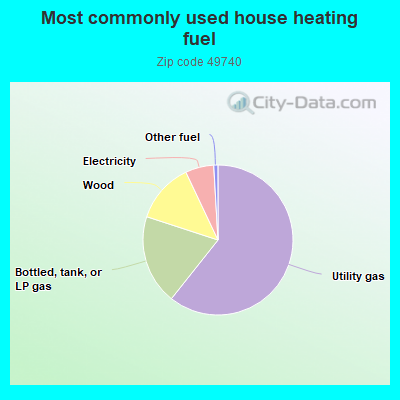
60.5%Utility gas
19.3%Bottled, tank, or LP gas
12.9%Wood
6.1%Electricity
0.9%Other fuel
Population in 1990: 5,473. Population change in the 1990s: +1,856 (+33.9%).
Place of birth for U.S.-born residents:
This state: 5,603
Northeast: 317
Midwest: 880
South: 282
West: 235
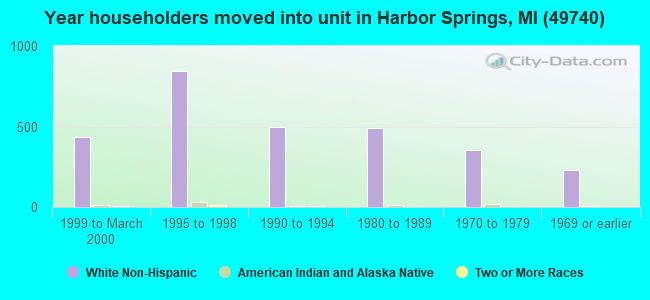
57% of the 49740 zip code residents lived in the same house 5 years ago. Out of people who lived in different houses, 50% lived in this county. Out of people who lived in different counties, 50% lived in Michigan.
91% of the 49740 zip code residents lived in the same house 1 year ago. Out of people who lived in different houses, 45% moved from this county. Out of people who lived in different houses, 38% moved from different county within same state. Out of people who lived in different houses, 17% moved from different state. Out of people who lived in different houses, 0% moved from abroad.
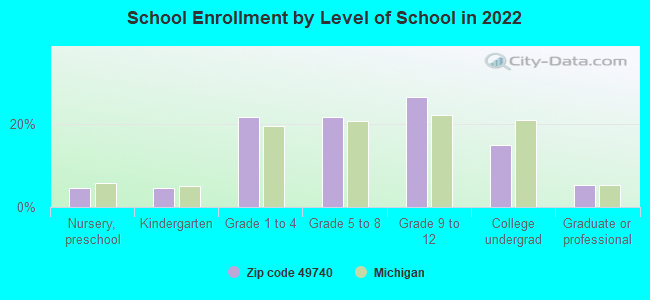
Private vs. public school enrollment:
Students in private schools in grades 1 to 8 (elementary and middle school): 20
Here:
4.3%
Michigan:
12.4%
Students in private schools in grades 9 to 12 (high school): 9
Here:
3.3%
Michigan:
9.8%
Students in private undergraduate colleges: 29
Here:
18.0%
Michigan:
14.9%
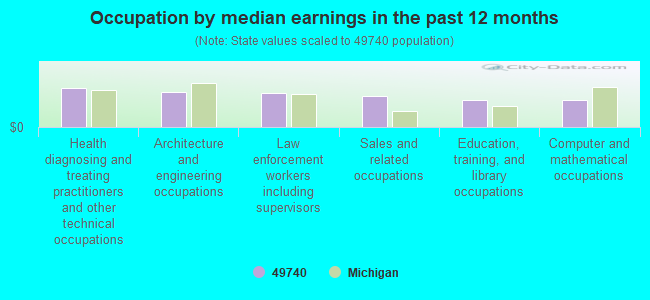
Occupation by median earnings in the past 12 months ($)
91,877Health diagnosing and treating practitioners and other technical occupations
83,725Architecture and engineering occupations
80,020Law enforcement workers including supervisors
72,081Sales and related occupations
62,839Education, training, and library occupations
62,722Computer and mathematical occupations
Companies with federal contracts located in this zip code:
CONTROL ENGINEERING COMPANY (8212 M-119 in HARBOR SPRINGS, MI) : $223,966 in 4 contractsfrom 2002 to 2003
$96,609 with Army for Conveyors. Signed on 2003-07-10. Completion date: 2003-11-06.
$50,000 with Defense Logistics Agency for X-Ray Equipment and Supplies: Medical, Dental, Veterinary. Signed on 2003-10-01. Completion date: 2004-01-31.
$50,000, same as above.Signed on 2003-12-19. Completion date: 2004-02-29.
$27,357 with Army for Conveyors. Signed on 2002-04-30. Completion date: 2002-07-31.
UNI-WASH INCORPORATED (370 FRANKLIN CT in HARBOR SPRINGS, MI; small business) : $44,988 in 3 contractsfrom 2003 to 2004
$29,543 with Army for Miscellaneous Special Industry Machinery. Signed on 2003-02-05. Completion date: 2003-03-07.
$9,765 with Army for Fans, Air Circulators, and Blower Equipment. Signed on 2004-04-05. Completion date: 2004-05-06.
$5,680, same as above.Signed on 2004-12-21. Completion date: 2005-01-13.
Top industries in this zip code by the number of employees in 2005:
Other Services (except Public Administration): Civic and Social Organizations (50-99: 1, 5-9: 1, 1-4: 3)
People in group quarters in 2010:
119 people in nursing facilities/skilled-nursing facilities
People in group quarters in 2000:
134 people in state prisons
102 people in nursing homes
7 people in religious group quarters
2 people in other group homes
2 people in agriculture workers' dormitories on farms
Fatal accident statistics in 2014:
Fatal accident count: 1
Vehicles involved in fatal accidents: 1
Fatal accidents caused by drunken drivers: 0
Fatalities: 1
Persons involved in fatal accidents: 1
Pedestrians involved in fatal accidents: 0
Fatal accident statistics in 2013:
Fatal accident count: 1
Vehicles involved in fatal accidents: 1
Fatal accidents caused by drunken drivers: 0
Fatalities: 1
Persons involved in fatal accidents: 1
Pedestrians involved in fatal accidents: 0
2002 - 2018 National Fire Incident Reporting System (NFIRS) incidents
Based on the data from the years 2002 - 2018 the average number of fire incidents per year is 10. The highest number of reported fires - 35 took place in 2018, and the least - 0 in 2006. The data has a growing trend.
When looking into fire subcategories, the most reports belonged to: Structure Fires (39.9%), and Outside Fires (32.7%).
Fire incident types reported to NFIRS in Zip Code 49740


 Nearest zip codes: 49769, 49722, 49764, 49770, 49755, 49706.
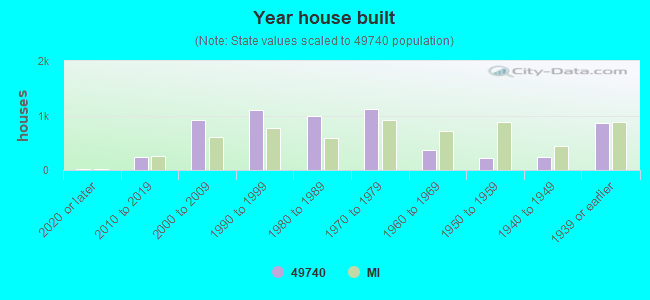


 Based on the data from the years 2002 - 2018 the average number of fire incidents per year is 10. The highest number of reported fires - 35 took place in 2018, and the least - 0 in 2006. The data has a growing trend.
 When looking into fire subcategories, the most reports belonged to: Structure Fires (39.9%), and Outside Fires (32.7%).