Estimated zip code population in 2022: 33,343 Zip code population in 2010: 31,653 Zip code population in 2000: 30,269
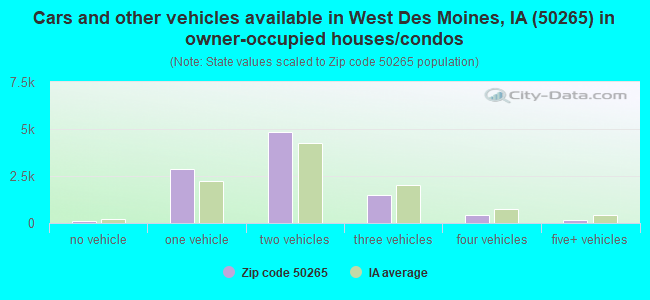
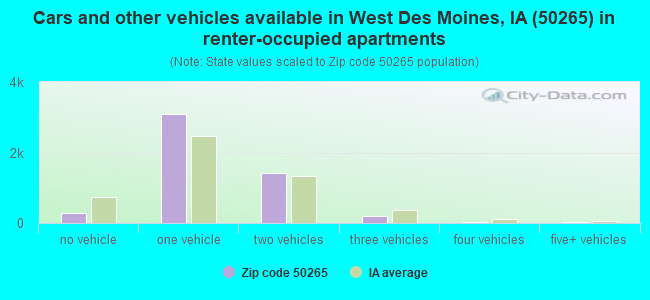
Houses and condos: 15,450 Renter-occupied apartments: 5,043
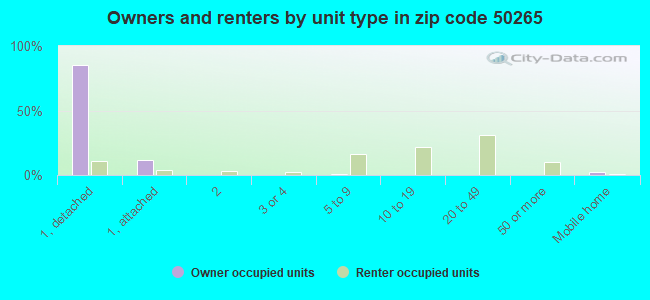
% of renters here:
34%
State:
28%
March 2022 cost of living index in zip code 50265: 89.9 (less than average, U.S. average is 100)
Land area: 17.1 sq. mi. Water area: 0.8 sq. mi.
Population density: 1,946 people per square mile
(low).
OSM Map
General Map
Google Map
MSN Map
OSM Map
General Map
Google Map
MSN Map
OSM Map
General Map
Google Map
MSN Map
OSM Map
General Map
Google Map
MSN Map
Please wait while loading the map...
Real estate property taxes paid for housing units in 2022:
This zip code:
1.6% ($4,173)
Iowa:
1.4% ($2,724)
Median real estate property taxes paid for housing units with mortgages in 2022: $4,072 (1.6%) Median real estate property taxes paid for housing units with no mortgage in 2022: $4,398 (1.6%)
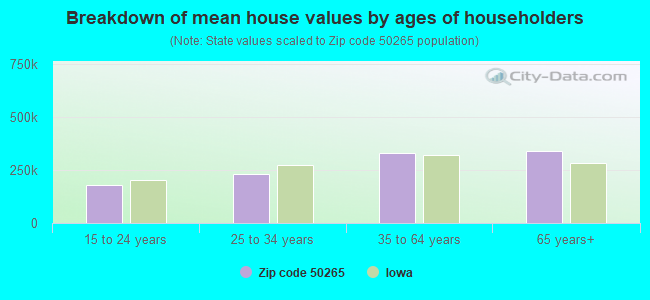
Estimated median house/condo value in 2022: $259,109
50265:
$259,109
Iowa:
$194,600
According to our research of Iowa and other state lists, there were 35 registered sex offenders living in 50265 zip code as of April 27, 2024. The ratio of all residents to sex offenders in zip code 50265 is 920 to 1. The ratio of registered sex offenders to all residents in this zip code is lower than the state average.
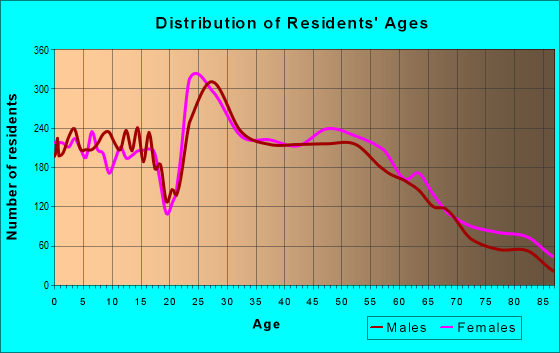
Median resident age:
This zip code:
38.4 years
Iowa median age:
38.9 years
Average household size:
This zip code:
2.2 people
Iowa:
2.3 people
Averages for the 2020 tax year for zip code 50265, filed in 2021:
Average Adjusted Gross Income (AGI) in 2020: $103,896 (Individual Income Tax Returns)
Here:
$103,896
State:
$71,087
Salary/wage: $72,452 (reported on 84.5% of returns)
Here:
$72,452
State:
$57,361
(% of AGI for various income ranges: 1159.6% for AGIs below $25k, 3645.2% for AGIs $25k-50k, 6620.1% for AGIs $50k-75k, 9420.9% for AGIs $75k-100k, 18335.5% for AGIs $100k-200k, 83730.3% for AGIs over 200k)
Taxable interest for individuals: $3,954 (reported on 35.8% of returns)
This zip code:
$3,954
Iowa:
$1,633
(% of AGI for various income ranges: 20.5% for AGIs below $25k, 25.1% for AGIs $25k-50k, 41.6% for AGIs $50k-75k, 97.1% for AGIs $75k-100k, 183.3% for AGIs $100k-200k, 4417.2% for AGIs over 200k)
Ordinary dividends: $9,781 (reported on 29.5% of returns)
Here:
$9,781
State:
$5,432
(% of AGI for various income ranges: 41.3% for AGIs below $25k, 41.7% for AGIs $25k-50k, 116.1% for AGIs $50k-75k, 216.9% for AGIs $75k-100k, 544.3% for AGIs $100k-200k, 8121.8% for AGIs over 200k)
Net capital gain/loss in AGI: +$54,382 (reported on 25.5% of returns)
Here:
+$54,382
State:
+$15,243
(% of AGI for various income ranges: 18.7% for AGIs below $25k, 26.2% for AGIs $25k-50k, 81.2% for AGIs $50k-75k, 182.9% for AGIs $75k-100k, 560.7% for AGIs $100k-200k, 55568.5% for AGIs over 200k)
Profit/loss from business: +$15,895 (reported on 14.6% of returns)
Here:
+$15,895
State:
+$11,763
(% of AGI for various income ranges: 107.0% for AGIs below $25k, 133.3% for AGIs $25k-50k, 210.8% for AGIs $50k-75k, 327.7% for AGIs $75k-100k, 573.5% for AGIs $100k-200k, 3545.1% for AGIs over 200k)
Taxable individual retirement arrangement distribution: $25,638 (reported on 11.9% of returns)
50265:
$25,638
Iowa:
$17,324
(% of AGI for various income ranges: 76.2% for AGIs below $25k, 118.3% for AGIs $25k-50k, 212.0% for AGIs $50k-75k, 479.3% for AGIs $75k-100k, 942.6% for AGIs $100k-200k, 4981.8% for AGIs over 200k)
Self-employed (Keogh) retirement plans: $22,060 (reported on 0.9% of returns)
50265:
$22,060
Iowa:
$22,144
(% of AGI for various income ranges: 10.7% for AGIs $50k-75k, 38.1% for AGIs $100k-200k, 632.6% for AGIs over 200k)
Total itemized deductions: $39,510 (reported on 10.5% of returns)
Here:
$39,510
State:
$33,775
(% of AGI for various income ranges: 71.8% for AGIs below $25k, 104.3% for AGIs $25k-50k, 293.4% for AGIs $50k-75k, 502.2% for AGIs $75k-100k, 876.3% for AGIs $100k-200k, 9656.9% for AGIs over 200k)
Charity contributions: $22,252 (reported on 8.2% of returns)
Here:
$22,252
State:
$13,075
(% of AGI for various income ranges: 3.8% for AGIs below $25k, 17.7% for AGIs $25k-50k, 37.4% for AGIs $50k-75k, 70.1% for AGIs $75k-100k, 214.8% for AGIs $100k-200k, 6332.1% for AGIs over 200k)
Taxes paid: $8,270 (reported on 10.3% of returns)
50265:
$8,270
State:
$7,704
(% of AGI for various income ranges: 9.4% for AGIs below $25k, 23.1% for AGIs $25k-50k, 88.2% for AGIs $50k-75k, 169.9% for AGIs $75k-100k, 282.9% for AGIs $100k-200k, 1241.0% for AGIs over 200k)
Earned income credit: $2,059 (reported on 9.8% of returns)
Here:
$2,059
State:
$2,195
(% of AGI for various income ranges: 65.8% for AGIs below $25k, 44.6% for AGIs $25k-50k, 1.0% for AGIs $50k-75k)
Percentage of individuals using paid preparers for their 2020 taxes: 94.4%
Here:
94%
State:
95%
(% for various income ranges: 91.9% for AGIs below $25k, 94.6% for AGIs $25k-50k, 95.4% for AGIs $50k-75k, 94.6% for AGIs $75k-100k, 96.0% for AGIs $100k-200k, 95.1% for AGIs over 200k)
Averages for the 2012 tax year for zip code 50265, filed in 2013:
Average Adjusted Gross Income (AGI) in 2012: $83,378 (Individual Income Tax Returns)
Here:
$83,378
State:
$58,860
Salary/wage: $64,607 (reported on 87.9% of returns)
Here:
$64,607
State:
$46,659
(% of AGI for various income ranges: 79.0% for AGIs below $25k, 84.7% for AGIs $25k-50k, 79.0% for AGIs $50k-75k, 78.2% for AGIs $75k-100k, 77.7% for AGIs $100k-200k, 51.8% for AGIs over 200k)
Taxable interest for individuals: $2,380 (reported on 40.2% of returns)
This zip code:
$2,380
Iowa:
$1,537
(% of AGI for various income ranges: 1.2% for AGIs below $25k, 0.7% for AGIs $25k-50k, 0.9% for AGIs $50k-75k, 0.8% for AGIs $75k-100k, 1.1% for AGIs $100k-200k, 1.4% for AGIs over 200k)
Ordinary dividends: $8,345 (reported on 28.6% of returns)
Here:
$8,345
State:
$4,542
(% of AGI for various income ranges: 2.3% for AGIs below $25k, 1.1% for AGIs $25k-50k, 1.6% for AGIs $50k-75k, 1.4% for AGIs $75k-100k, 2.2% for AGIs $100k-200k, 4.4% for AGIs over 200k)
Net capital gain/loss in AGI: +$16,587 (reported on 22.9% of returns)
Here:
+$16,587
State:
+$11,802
(% of AGI for various income ranges: 0.6% for AGIs $25k-50k, 0.7% for AGIs $50k-75k, 0.5% for AGIs $75k-100k, 1.5% for AGIs $100k-200k, 9.8% for AGIs over 200k)
Profit/loss from business: +$18,067 (reported on 14.4% of returns)
Here:
+$18,067
State:
+$10,509
(% of AGI for various income ranges: 5.1% for AGIs below $25k, 2.4% for AGIs $25k-50k, 2.8% for AGIs $50k-75k, 2.9% for AGIs $75k-100k, 2.8% for AGIs $100k-200k, 3.4% for AGIs over 200k)
Taxable individual retirement arrangement distribution: $19,359 (reported on 11.5% of returns)
50265:
$19,359
Iowa:
$11,773
(% of AGI for various income ranges: 3.8% for AGIs below $25k, 2.2% for AGIs $25k-50k, 2.8% for AGIs $50k-75k, 3.0% for AGIs $75k-100k, 2.9% for AGIs $100k-200k, 2.4% for AGIs over 200k)
Self-employment retirement plans: $22,259 (reported on 1.0% of returns)
50265:
$22,259
Iowa:
$18,614
(% of AGI for various income ranges: 0.2% for AGIs $50k-75k, 0.2% for AGIs $100k-200k, 0.5% for AGIs over 200k)
Total itemized deductions: $26,551 (17% of AGI, reported on 41.1% of returns)
Here:
$26,551
State:
$21,278
Here:
17.0% of AGI
State:
18.9% of AGI
(% of AGI for various income ranges: 11.2% for AGIs below $25k, 8.7% for AGIs $25k-50k, 13.1% for AGIs $50k-75k, 14.4% for AGIs $75k-100k, 15.1% for AGIs $100k-200k, 13.0% for AGIs over 200k)
Charity contributions: $6,035 (reported on 34.9% of returns)
Here:
$6,035
State:
$4,044
(% of AGI for various income ranges: 0.8% for AGIs below $25k, 0.8% for AGIs $25k-50k, 1.4% for AGIs $50k-75k, 1.9% for AGIs $75k-100k, 2.3% for AGIs $100k-200k, 3.7% for AGIs over 200k)
Taxes paid: $12,298 (reported on 40.9% of returns)
50265:
$12,298
State:
$8,846
(% of AGI for various income ranges: 2.4% for AGIs below $25k, 2.7% for AGIs $25k-50k, 4.8% for AGIs $50k-75k, 6.0% for AGIs $75k-100k, 7.5% for AGIs $100k-200k, 6.8% for AGIs over 200k)
Earned income credit: $1,852 (reported on 9.9% of returns)
Here:
$1,852
State:
$2,098
(% of AGI for various income ranges: 3.5% for AGIs below $25k, 0.5% for AGIs $25k-50k)
Percentage of individuals using paid preparers for their 2012 taxes: 53.0%
Here:
53%
State:
65%
(% for various income ranges: 46.1% for AGIs below $25k, 48.1% for AGIs $25k-50k, 56.0% for AGIs $50k-75k, 56.1% for AGIs $75k-100k, 60.3% for AGIs $100k-200k, 80.0% for AGIs over 200k)
Averages for the 2004 tax year for zip code 50265, filed in 2005:
Average Adjusted Gross Income (AGI) in 2004: $69,914 (Individual Income Tax Returns)
Here:
$69,914
State:
$43,875
Salary/wage: $57,860 (reported on 87.7% of returns)
Here:
$57,860
State:
$38,265
(% of AGI for various income ranges: 140.1% for AGIs below $10k, 77.2% for AGIs $10k-25k, 83.8% for AGIs $25k-50k, 79.8% for AGIs $50k-75k, 81.7% for AGIs $75k-100k, 64.9% for AGIs over 100k)
Taxable interest for individuals: $2,506 (reported on 54.8% of returns)
This zip code:
$2,506
Iowa:
$1,768
(% of AGI for various income ranges: 13.3% for AGIs below $10k, 2.7% for AGIs $10k-25k, 1.6% for AGIs $25k-50k, 1.7% for AGIs $50k-75k, 1.4% for AGIs $75k-100k, 2.0% for AGIs over 100k)
Taxable dividends: $3,965 (reported on 37.1% of returns)
Here:
$3,965
State:
$2,510
(% of AGI for various income ranges: 8.6% for AGIs below $10k, 2.2% for AGIs $10k-25k, 1.3% for AGIs $25k-50k, 1.5% for AGIs $50k-75k, 1.5% for AGIs $75k-100k, 2.5% for AGIs over 100k)
Net capital gain/loss: +$13,162 (reported on 29.1% of returns)
Here:
+$13,162
State:
+$6,139
(% of AGI for various income ranges: -4.1% for AGIs below $10k, 0.3% for AGIs $10k-25k, 0.9% for AGIs $25k-50k, 0.8% for AGIs $50k-75k, 1.1% for AGIs $75k-100k, 9.2% for AGIs over 100k)
Profit/loss from business: +$18,243 (reported on 14.9% of returns)
Here:
+$18,243
State:
+$8,574
(% of AGI for various income ranges: 6.5% for AGIs below $10k, 4.3% for AGIs $10k-25k, 3.0% for AGIs $25k-50k, 3.6% for AGIs $50k-75k, 3.5% for AGIs $75k-100k, 4.2% for AGIs over 100k)
IRA payment deduction: $3,166 (reported on 2.4% of returns)
50265:
$3,166
Iowa:
$2,970
(% of AGI for various income ranges: 0.2% for AGIs $10k-25k, 0.2% for AGIs $25k-50k, 0.2% for AGIs $50k-75k, 0.1% for AGIs $75k-100k, 0.1% for AGIs over 100k)
Self-employed pension: $13,859 (reported on 1.7% of returns)
Here:
$13,859
Iowa:
$11,928
(% of AGI for various income ranges: 0.1% for AGIs $10k-25k, 0.1% for AGIs $25k-50k, 0.2% for AGIs $50k-75k, 0.3% for AGIs $75k-100k, 0.5% for AGIs over 100k)
Total itemized deductions: $21,592 (18% of AGI, reported on 47.3% of returns)
Here:
$21,592
State:
$16,976
Here:
18.1% of AGI
State:
20.8% of AGI
(% of AGI for various income ranges: 24.4% for AGIs below $10k, 10.7% for AGIs $10k-25k, 12.3% for AGIs $25k-50k, 16.7% for AGIs $50k-75k, 18.0% for AGIs $75k-100k, 14.1% for AGIs over 100k)
Charity contributions deductions: $4,195 (3% of AGI, reported on 42.5% of returns)
Here:
$4,195
State:
$3,089
Here:
3.3% of AGI
State:
3.6% of AGI
(% of AGI for various income ranges: 1.0% for AGIs below $10k, 1.0% for AGIs $10k-25k, 1.4% for AGIs $25k-50k, 2.0% for AGIs $50k-75k, 2.3% for AGIs $75k-100k, 3.2% for AGIs over 100k)
Total tax: $12,820 (reported on 83.7% of returns)
50265:
$12,820
State:
$6,177
(% of AGI for various income ranges: 3.7% for AGIs below $10k, 4.9% for AGIs $10k-25k, 8.1% for AGIs $25k-50k, 9.5% for AGIs $50k-75k, 10.4% for AGIs $75k-100k, 20.6% for AGIs over 100k)
Earned income credit: $1,361 (reported on 6.5% of returns)
Here:
$1,361
State:
$1,540
Percentage of individuals using paid preparers for their 2004 taxes: 58.3%
Here:
58%
State:
70%
(% for various income ranges: 51.3% for AGIs below $10k, 57.2% for AGIs $10k-25k, 56.4% for AGIs $25k-50k, 60.8% for AGIs $50k-75k, 58.9% for AGIs $75k-100k, 67.2% for AGIs over 100k)
Likely homosexual households (counted as self-reported same-sex unmarried-partner households)
Lesbian couples: 0.1% of all households
Gay men: 0.1% of all households
Household received Food Stamps/SNAP in the past 12 months: 1,187 Household did not receive Food Stamps/SNAP in the past 12 months: 13,787
Women who had a birth in the past 12 months: 286 (215 now married, 71 unmarried) Women who did not have a birth in the past 12 months: 7,754 (3,233 now married, 4,521 unmarried)
Housing units in zip code 50265 with a mortgage: 6,969 (802 second mortgage, 7 home equity loan, 697 both second mortgage and home equity loan) Houses without a mortgage: 242
Median monthly owner costs for units with a mortgage: $1,539 Median monthly owner costs for units without a mortgage: $691
Residents with income below the poverty level in 2022:
This zip code:
8.2%
Whole state:
11.0%
Residents with income below 50% of the poverty level in 2022:
This zip code:
3.3%
Whole state:
5.5%
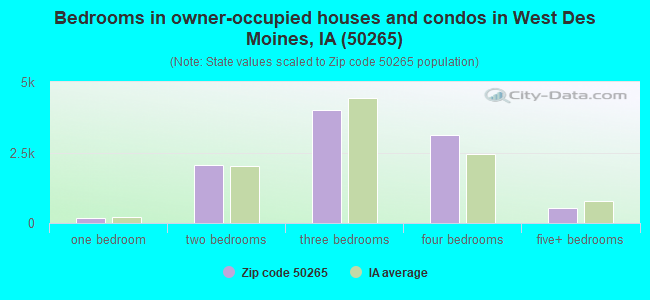
Median number of rooms in houses and condos:
Here:
6.8
State:
6.8
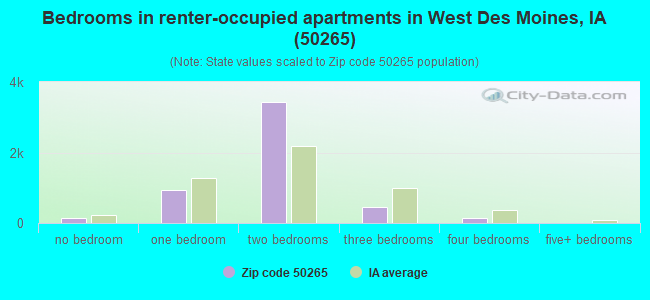
Median number of rooms in apartments:
Here:
3.9
State:
4.2
Notable locations in this zip code not listed on our city pages
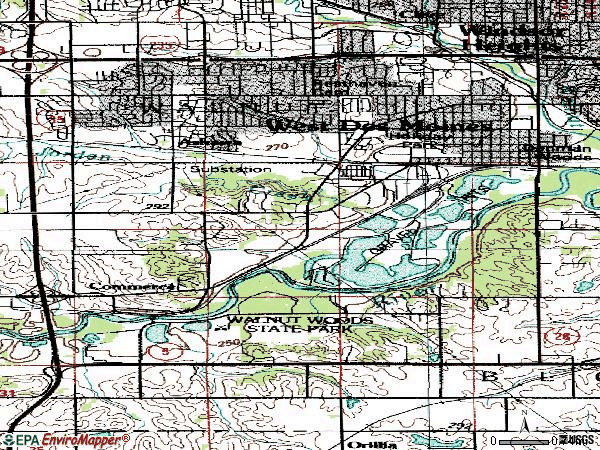
Notable locations in zip code 50265: Commerce (A), Willow Creek Golf Course (B), West Des Moines Fire Department Station 17 (C), West Des Moines Fire Department Station 18 (D), Jordan House (E), West Des Moines Police Department (F), West Des Moines Library (G), City of West Des Moines Emergency Medical Services Station 17 (H), City of West Des Moines Emergency Medical Services Station 18 (I), West Des Moines City Hall (J). Display/hide their locations on the map
Churches in zip code 50265 include: Saint Mark Lutheran Church (A), West Des Moines Christian Church (B), Covenant Presbyterian Church (C), Beautiful Savior Lutheran Church (D), Jehovah's Witnesses Congregation (E), Commerce Community Church (F), Point of Grace Church (G), Valley Assembly of God Church (H), Baptist Mission (I). Display/hide their locations on the map
Parks in zip code 50265 include: Beh Glen Park (1), Fairmeadows Park (2), Jordan Creek Park (3), Southwood Park (4), Kiwanis Park (5), Florer Park (6), Knolls Park (7), Western Hills Park (8), Walnut Woods State Park (9). Display/hide their locations on the map
5,349 married couples with children.
1,729 single-parent households (442 men, 1,287 women).
86.6% of residents of 50265 zip code speak English at home.
4.7% of residents speak Spanish at home (47% very well, 25% well, 17% not well, 11% not at all).
2.5% of residents speak other Indo-European language at home (58% very well, 37% well, 4% not well).
2.9% of residents speak Asian or Pacific Island language at home (65% very well, 26% well, 2% not well, 8% not at all).
3.5% of residents speak other language at home (58% very well, 17% well, 16% not well, 8% not at all).
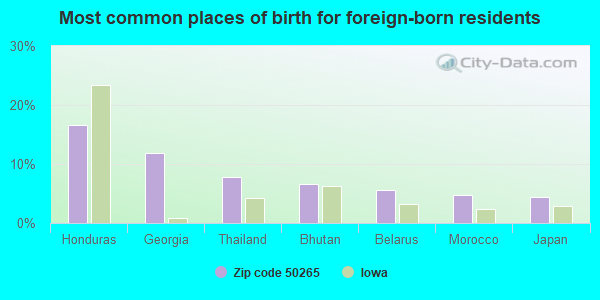
Foreign born population: 3,646 (10.9%) (53.6% of them are naturalized citizens)
Major facilities with environmental interests located in this zip code:
DELAVAN INC GAS TURBINE PRODUCTS DIV (811 4TH STREET in WEST DES MOINES, IA)
AIR SYNTHETIC MINOR (AIRS/AFS) COMPLIANCE ACTIVITY (Tracking inspections of insecticide, fungicide, and rodenticide, and toxic substances) HAZARDOUS WASTE BIENNIAL REPORTER (Resource Conservation and Recovery Act (tracking hazardous waste)) - ICIS-, ENFORCEMENT/COMPLIANCE ACTIVITY Small Quantity Generators, between 100 kg and 1000 kg of hazardous waste/month (Resource Conservation and Recovery Act (tracking hazardous waste)) - ICIS-, ENFORCEMENT/COMPLIANCE ACTIVITY TRI REPORTER (Tracking of toxic chemicals releasing facilities) Business SIC classification: AIRCRAFT ENGINES AND ENGINE PARTS; NONCLASSIFIABLE ESTABLISHMENTS Organizations: GOODRICH CORPORATION (CONTACT/OWNER)
Alternative names: TURBINE FUEL TECHNOLOGIES
BELCHER & LONG DBA NORMANDY TERRACE APARTMENTS (1800 GRAND AVENUE in WEST DES MOINES, IA)
ENFORCEMENT/COMPLIANCE ACTIVITY (Integrated Compliance Information System) - ICIS-07-2005-0011, FORMAL ENFORCEMENT ACTION (Integrated Compliance Information System) - ICIS-07-2005-0011, FORMAL ENFORCEMENT ACTION COMPLIANCE ACTIVITY (Tracking inspections of insecticide, fungicide, and rodenticide, and toxic substances) Alternative names: BELCHER & LONG CORPORATION, LB BELCHER & GL LONG DBA HORIZONS W APTS
ROTO ROOTER CORP (300 ASHWORTH RD in W DES MOINES, IA)
STATE MASTER (New Jersey environmental info) - NJEMS-001362, PESTICIDES - MANUFACTURE Conditionally Exempt Small Quantity Generators, less than 100 kg/month of hazardous waste (Resource Conservation and Recovery Act (tracking hazardous waste)) Business NAICS classification: OTHER COMMERCIAL AND SERVICE INDUSTRY MACHINERY MANUFACTURING. Organizations: ROTO-ROOTER CORP (CONTACT/OPERATOR)
DANIELS ROSS INC. (1720 FULLER ROAD in WEST DES MOINES, IA)
AIR MINOR (AIRS/AFS) COMPLIANCE ACTIVITY (Tracking inspections of insecticide, fungicide, and rodenticide, and toxic substances) (Resource Conservation and Recovery Act (tracking hazardous waste)) Business SIC classification: NONCLASSIFIABLE ESTABLISHMENTS Organizations: JOHN MCROBERTS/AMERICAN HOME SALES (CONTACT/OWNER)
Alternative names: 1720 LC (VACANT PROPERTY), CLOSED FACILITY -- DANIELS ROSS INC., ROSS DANIELS INC
STEEL TREATING (2250 FULLER ROAD in WEST DES MOINES, IA)
AIR MINOR (AIRS/AFS) CRITERIA AND HAZARDOUS AIR POLLUTANT INVENTORY (Inventory of air pollution sources) (Resource Conservation and Recovery Act (tracking hazardous waste)) TRI REPORTER (Tracking of toxic chemicals releasing facilities) Business SIC classification: METAL HEAT TREATING; NONCLASSIFIABLE ESTABLISHMENTS Business NAICS classification: METAL HEAT TREATING. Organizations: GOODRICH CORPORATION (CONTACT/OWNER)
Alternative names: TURBINE FUEL TECHNOLOGIES
REX MATHES SCHOOL (1401 VINE ST in WEST DES MOINES, IA)
(Geographic Names Information System) (National Center for Education Statistics) - STATE ID-776957 454 Organizations: WEST DES MOINES COMM SCHOOL DISTRICT (SCHOOL DISTRICT)
CLEGG PARK ELEMENTARY SCHOOL (1020 8TH ST in WEST DES MOINES, IA)
(National Center for Education Statistics) - STATE ID-776957 409 Organizations: WEST DES MOINES COMM SCHOOL DISTRICT (SCHOOL DISTRICT)
CRETEX CONCRETE PRODUCTS MIDWEST INC (525 SOUTH 11TH STREET in WEST DES MOINES, IA)
AIR MINOR (AIRS/AFS) (Resource Conservation and Recovery Act (tracking hazardous waste)) Business SIC classification: CONCRETE PRODUCTS, EXCEPT BLOCK AND BRICK Organizations: IOWA CONCRETE PRODUCTS CO (CONTACT/OWNER)
Alternative names: IOWA CONCRETE PRODUCTS CO
VALLEY SOUTHWOODS (625 S 35TH ST in WEST DES MOINES, IA)
(National Center for Education Statistics) - STATE ID-776957 235 Organizations: WEST DES MOINES COMM SCHOOL DISTRICT (SCHOOL DISTRICT)
PHENIX ELEMENTARY SCHOOL (415 7TH ST in WEST DES MOINES, IA)
(National Center for Education Statistics) - STATE ID-776957 463 Organizations: WEST DES MOINES COMM SCHOOL DISTRICT (SCHOOL DISTRICT)
STILWELL JUNIOR HIGH SCHOOL (1601 VINE ST in WEST DES MOINES, IA)
(National Center for Education Statistics) - STATE ID-776957 236 Organizations: WEST DES MOINES COMM SCHOOL DISTRICT (SCHOOL DISTRICT)
CHESAPEAK DISPLAY (520 S 18TH in WEST DES MOINES, IA)
AIR MINOR (AIRS/AFS) (Resource Conservation and Recovery Act (tracking hazardous waste)) Business SIC classification: NONCLASSIFIABLE ESTABLISHMENTS Organizations: CHESAPEAKE DISPLAY & PACKAGING (CONTACT/OWNER)
Alternative names: CHESAPEAKE DISPLAY & PACKAGING CO, CLOSED FACILITY -- CHESAPEAK DISPLAY
ACME PLATING (1115 MAPLE in WEST DES MOINES, IA)
AIR MINOR (AIRS/AFS) (Resource Conservation and Recovery Act (tracking hazardous waste)) Business SIC classification: NONCLASSIFIABLE ESTABLISHMENTS Business NAICS classification: CUTLERY AND FLATWARE (EXCEPT PRECIOUS) MANUFACTURING. Alternative names: ACME PLATING COMPANY-FORMER SITE OF, CLOSED FACILITY -- ACME PLATING
Housing units lacking complete plumbing facilities: 0.1% Housing units lacking complete kitchen facilities: 0.2%
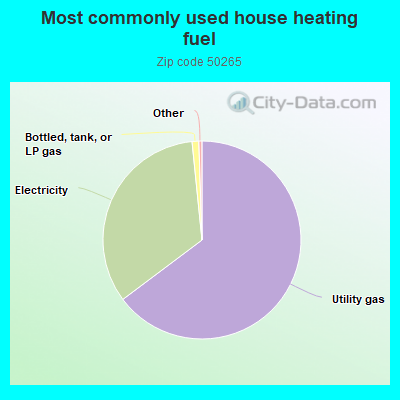
64.7%Utility gas
33.6%Electricity
1.1%Bottled, tank, or LP gas
Population in 1990: 31,896.
Place of birth for U.S.-born residents:
This state: 20,664
Northeast: 746
Midwest: 4,661
South: 1,721
West: 1,584
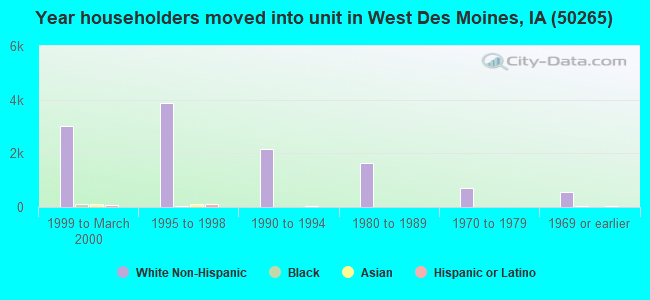
44% of the 50265 zip code residents lived in the same house 5 years ago. Out of people who lived in different houses, 54% lived in this county. Out of people who lived in different counties, 50% lived in Iowa.
86% of the 50265 zip code residents lived in the same house 1 year ago. Out of people who lived in different houses, 50% moved from this county. Out of people who lived in different houses, 22% moved from different county within same state. Out of people who lived in different houses, 21% moved from different state. Out of people who lived in different houses, 6% moved from abroad.
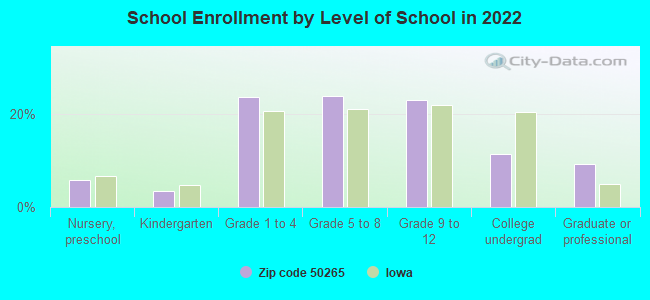
Private vs. public school enrollment:
Students in private schools in grades 1 to 8 (elementary and middle school): 358
Here:
9.6%
Iowa:
10.6%
Students in private schools in grades 9 to 12 (high school): 228
Here:
12.7%
Iowa:
7.9%
Students in private undergraduate colleges: 157
Here:
17.4%
Iowa:
23.9%
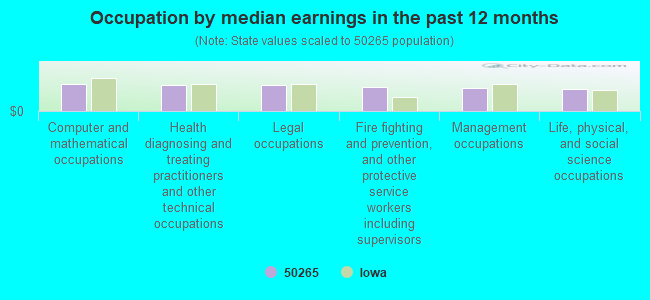
Occupation by median earnings in the past 12 months ($)
97,393Computer and mathematical occupations
93,898Health diagnosing and treating practitioners and other technical occupations
92,117Legal occupations
87,884Fire fighting and prevention, and other protective service workers including supervisors
84,201Management occupations
77,467Life, physical, and social science occupations
Companies with federal contracts located in this zip code (WEST DES MOINE, IA):
DELAVAN INC (811 4TH ST) : $74,409,773 in 424 contractsfrom 1999 to 2006
Contracts for Engine Fuel System Components, Aircraft and Missile Prime Movers, Ship and Boat Propulsion Components, Gas Turbines and Jet Engines, Aircraft; Prime Moving, and Components, Miscellaneous Items, and moreby Defense Logistics Agency, Navy, Army, Air Force, and others Signed by year:2000: $10,096,737; 2001: $12,008,953; 2002: $11,856,614; 2003: $16,365,057; 2004: $7,893,150; 2005: $8,711,957; 2006: $5,432,589.
Biggest contracts:
$2,870,406 with Defense Logistics Agency for Engine Fuel System Components, Aircraft and Missile Prime Movers. Signed on 2003-11-24. Completion date: 2005-12-13.
$2,567,100 with Navy for Engine Fuel System Components, Aircraft and Missile Prime Movers. Signed on 2002-11-04. Completion date: 2003-11-04.
$2,490,000 with Navy for Ship and Boat Propulsion Components. Signed on 2003-02-03. Completion date: 2004-08-31.
$2,064,857 with Army for Engine Fuel System Components, Aircraft and Missile Prime Movers. Signed on 2003-10-23. Completion date: 2005-09-30.
DELAVAN INC (811 - 4TH STREET) : $236,925 in 2 contractsfrom 2000 to 2001
$187,625 with Defense Logistics Agency for Engine Fuel System Components, Aircraft and Missile Prime Movers. Signed on 2001-04-17. Completion date: 2001-10-23.
$49,300 with Defense Logistics Agency for Engine Fuel System Components, Aircraft and Missile Prime Movers. Taking place in MI. Signed on 2000-04-12. Completion date: 2000-06-11.
DELAVAN INC (811 4TH STREET) : $113,500 in 2 contractsfrom 1999 to 2001
$70,950 with Defense Logistics Agency for Engine Fuel System Components, Nonaircraft. Taking place in AZ. Signed on 1999-10-12. Completion date: 2000-02-09.
$42,550 with Defense Logistics Agency for Engine Fuel System Components, Nonaircraft. Signed on 2001-09-19. Completion date: 2002-01-21.
WIMMER ASPHALT CONSTRUCTION CO (1630 FULLER ROAD; small business) : $25,336 in 2 contractsin 2000
$17,296 with Army for Maintenance, Repair or Alteration of Real Property -- Other Airfield Structures. Signed on 2000-09-25. Completion date: 2000-11-30.
$8,040, same as above.Signed on 2000-09-25. Completion date: 2000-11-30.
RAIN KING (205 FOURTH STREET; small business) : $18,459 in 2 contractsfrom 2000 to 2004
$15,404 with Army for Maintenance, Repair or Alteration of Real Property -- Other Utilities. Signed on 2004-09-02. Completion date: 2004-10-02.
$3,055 with Army for Maintenance, Repair or Alteration of Real Property -- Office Buildings. Signed on 2000-09-05. Completion date: 2000-09-30.
GONGOL, D J & ASSOCIATES INC (4801 POMMEL PLACE; small business)
$15,952 with Army for Power and Hand Pumps. Signed on 2006-01-10. Completion date: 2006-02-20.
NETWORKS, INC (2045 GRAND AVE STE F; small business)
$4,720 with Air Force for ADP Input/Output and Storage Devices. Signed on 2004-07-08. Completion date: 2004-07-16.
Top industries in this zip code by the number of employees in 2005:
2002 - 2018 National Fire Incident Reporting System (NFIRS) incidents
According to the data from the years 2002 - 2018 the average number of fires per year is 66. The highest number of fire incidents - 96 took place in 2012, and the least - 38 in 2004. The data has a dropping trend.
When looking into fire subcategories, the most reports belonged to: Structure Fires (40.8%), and Outside Fires (38.2%).
Fire incident types reported to NFIRS in Zip Code 50265


 Nearest zip codes: 50266, 50324, 50312, 50061, 50325, 50322.
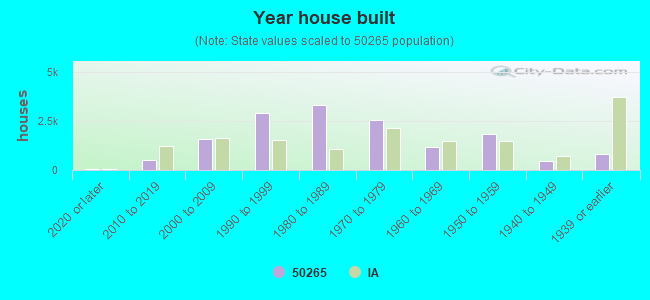


 According to the data from the years 2002 - 2018 the average number of fires per year is 66. The highest number of fire incidents - 96 took place in 2012, and the least - 38 in 2004. The data has a dropping trend.
 When looking into fire subcategories, the most reports belonged to: Structure Fires (40.8%), and Outside Fires (38.2%).