Estimated zip code population in 2022: 1,202 Zip code population in 2010: 1,346 Zip code population in 2000: 1,388
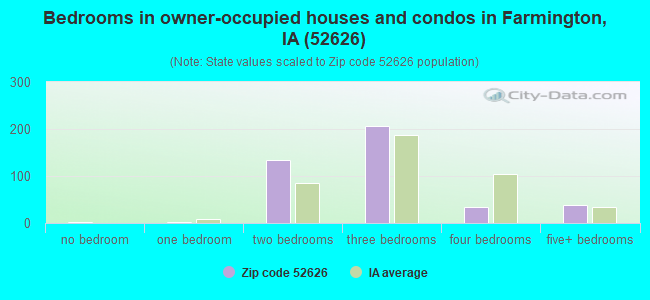
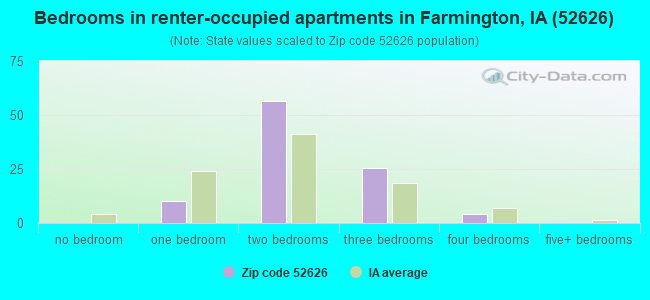
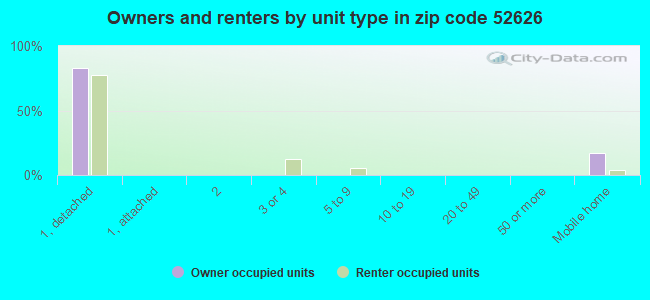
Houses and condos: 630 Renter-occupied apartments: 96
% of renters here:
19%
State:
28%
March 2022 cost of living index in zip code 52626: 81.7 (low, U.S. average is 100)
Land area: 94.1 sq. mi. Water area: 1.5 sq. mi.
Population density: 13 people per square mile
(very low).
OSM Map
General Map
Google Map
MSN Map
OSM Map
General Map
Google Map
MSN Map
OSM Map
General Map
Google Map
MSN Map
OSM Map
General Map
Google Map
MSN Map
Please wait while loading the map...
Real estate property taxes paid for housing units in 2022:
This zip code:
1.4% ($1,185)
Iowa:
1.4% ($2,724)
Median real estate property taxes paid for housing units with mortgages in 2022: $1,387 (0.9%) Median real estate property taxes paid for housing units with no mortgage in 2022: $869 (1.6%)
Business Search- 14 Million verified businesses
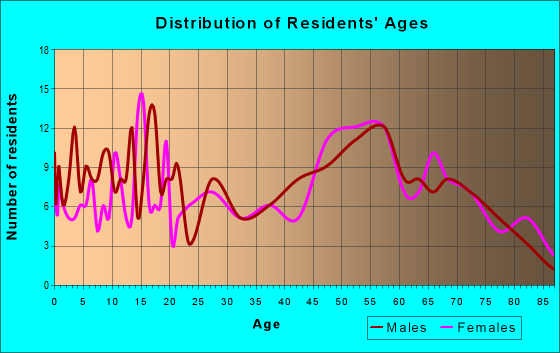
Males: 555
(46.2%)
Females: 647
(53.8%)
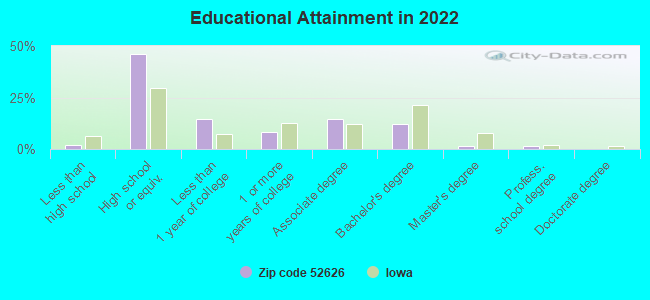
For population 25 years and over in 52626:
High school or higher: 96.5%
Bachelor's degree or higher: 14.8%
Graduate or professional degree: 2.7%
Unemployed: 5.2%
Mean travel time to work (commute): 31.1 minutes
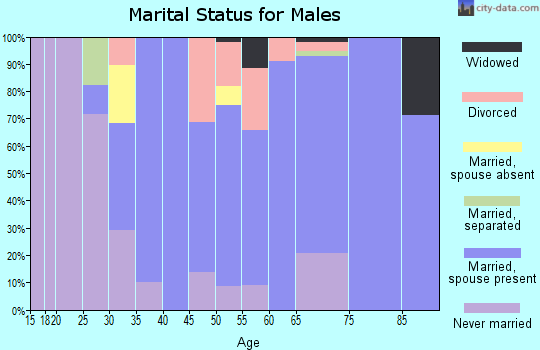
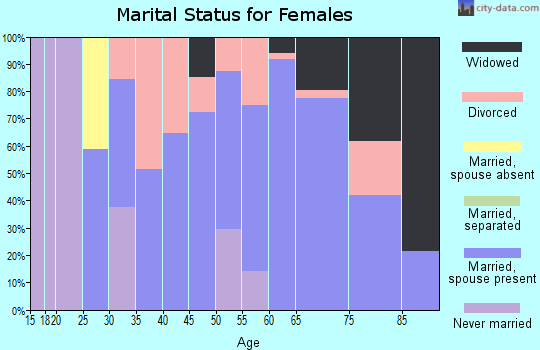
For population 15 years and over in 52626:
Never married: 23.3%
Now married: 49.3%
Separated: 0.9%
Widowed: 10.8%
Divorced: 15.7%
Zip code 52626 compared to state average:
Median house value significantly below state average.
Unemployed percentage above state average.
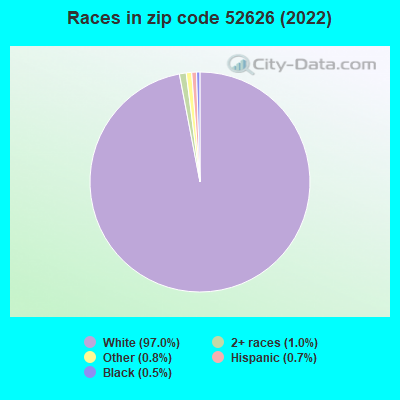
Black race population percentage significantly below state average.
Hispanic race population percentage significantly below state average.
Median age above state average.
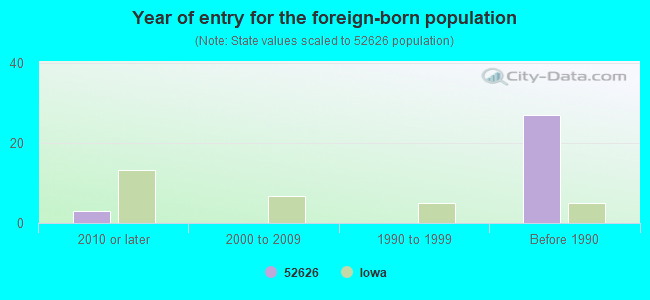
Foreign-born population percentage significantly below state average.
Renting percentage below state average.
Length of stay since moving in significantly above state average.
Number of college students significantly below state average.
Percentage of population with a bachelor's degree or higher below state average.
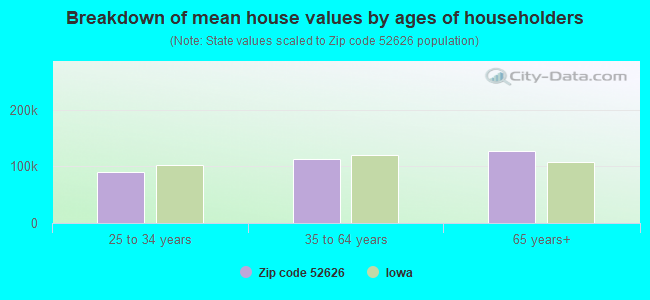
Estimated median house/condo value in 2022: $85,405
52626:
$85,405
Iowa:
$194,600
According to our research of Iowa and other state lists, there were 4 registered sex offenders living in 52626 zip code as of April 27, 2024. The ratio of all residents to sex offenders in zip code 52626 is 403 to 1. The ratio of registered sex offenders to all residents in this zip code is near the state average.
Median resident age:
This zip code:
46.2 years
Iowa median age:
38.9 years
Average household size:
This zip code:
2.3 people
Iowa:
2.3 people
Averages for the 2020 tax year for zip code 52626, filed in 2021:
Average Adjusted Gross Income (AGI) in 2020: $48,736 (Individual Income Tax Returns)
Here:
$48,736
State:
$71,087
Salary/wage: $42,155 (reported on 75.5% of returns)
Here:
$42,155
State:
$57,361
(% of AGI for various income ranges: 1187.3% for AGIs below $25k, 3617.5% for AGIs $25k-50k, 7361.7% for AGIs $50k-75k, 8890.0% for AGIs $75k-100k, 13770.0% for AGIs $100k-200k)
Taxable interest for individuals: $605 (reported on 39.6% of returns)
This zip code:
$605
Iowa:
$1,633
(% of AGI for various income ranges: 18.2% for AGIs below $25k, 16.7% for AGIs $25k-50k, 71.7% for AGIs $50k-75k, 110.0% for AGIs $75k-100k, 36.7% for AGIs $100k-200k)
Ordinary dividends: $1,733 (reported on 17.0% of returns)
Here:
$1,733
State:
$5,432
(% of AGI for various income ranges: 50.0% for AGIs $25k-50k, 320.0% for AGIs $75k-100k)
Net capital gain/loss in AGI: +$4,378 (reported on 17.0% of returns)
Here:
+$4,378
State:
+$15,243
(% of AGI for various income ranges: 19.1% for AGIs below $25k, 401.7% for AGIs $50k-75k, 440.0% for AGIs $75k-100k)
Profit/loss from business: +$4,211 (reported on 17.0% of returns)
Here:
+$4,211
State:
+$11,763
(% of AGI for various income ranges: 156.4% for AGIs below $25k, 131.7% for AGIs $25k-50k, 163.3% for AGIs $75k-100k)
Taxable individual retirement arrangement distribution: $8,980 (reported on 9.4% of returns)
52626:
$8,980
Iowa:
$17,324
(% of AGI for various income ranges: 195.5% for AGIs below $25k, 390.0% for AGIs $50k-75k)
Earned income credit: $2,543 (reported on 13.2% of returns)
Here:
$2,543
State:
$2,195
(% of AGI for various income ranges: 89.1% for AGIs below $25k, 66.7% for AGIs $25k-50k)
Percentage of individuals using paid preparers for their 2020 taxes: 96.2%
Here:
96%
State:
95%
(% for various income ranges: 94.1% for AGIs below $25k, 93.8% for AGIs $25k-50k, 100.0% for AGIs $50k-75k, 100.0% for AGIs $75k-100k, 100.0% for AGIs $100k-200k)
Averages for the 2012 tax year for zip code 52626, filed in 2013:
Average Adjusted Gross Income (AGI) in 2012: $39,513 (Individual Income Tax Returns)
Here:
$39,513
State:
$58,860
Salary/wage: $34,157 (reported on 77.8% of returns)
Here:
$34,157
State:
$46,659
(% of AGI for various income ranges: 75.8% for AGIs below $25k, 74.6% for AGIs $25k-50k, 72.5% for AGIs $50k-75k, 106.8% for AGIs $75k-100k)
Taxable interest for individuals: $612 (reported on 48.1% of returns)
This zip code:
$612
Iowa:
$1,537
(% of AGI for various income ranges: 1.9% for AGIs below $25k, 0.7% for AGIs $25k-50k, 0.5% for AGIs $50k-75k, 1.0% for AGIs $75k-100k)
Ordinary dividends: $922 (reported on 16.7% of returns)
Here:
$922
State:
$4,542
Net capital gain/loss in AGI: +$2,971 (reported on 13.0% of returns)
Here:
+$2,971
State:
+$11,802
Profit/loss from business: +$4,300 (reported on 20.4% of returns)
Here:
+$4,300
State:
+$10,509
(% of AGI for various income ranges: 6.7% for AGIs below $25k, 2.9% for AGIs $25k-50k, 2.2% for AGIs $50k-75k)
Taxable individual retirement arrangement distribution: $6,383 (reported on 11.1% of returns)
52626:
$6,383
Iowa:
$11,773
Total itemized deductions: $16,562 (22% of AGI, reported on 14.8% of returns)
Here:
$16,562
State:
$21,278
Here:
22.3% of AGI
State:
18.9% of AGI
(% of AGI for various income ranges: 8.7% for AGIs $25k-50k, 6.6% for AGIs $50k-75k, 12.5% for AGIs $75k-100k)
Charity contributions: $2,240 (reported on 9.3% of returns)
Here:
$2,240
State:
$4,044
Taxes paid: $5,288 (reported on 14.8% of returns)
52626:
$5,288
State:
$8,846
(% of AGI for various income ranges: 1.5% for AGIs $25k-50k, 1.8% for AGIs $50k-75k, 6.4% for AGIs $75k-100k)
Earned income credit: $2,464 (reported on 20.4% of returns)
Here:
$2,464
State:
$2,098
(% of AGI for various income ranges: 7.4% for AGIs below $25k, 1.0% for AGIs $25k-50k)
Percentage of individuals using paid preparers for their 2012 taxes: 85.2%
Here:
85%
State:
65%
(% for various income ranges: 78.3% for AGIs below $25k, 87.5% for AGIs $25k-50k, 100.0% for AGIs $50k-75k, 120.0% for AGIs $75k-100k)
Averages for the 2004 tax year for zip code 52626, filed in 2005:
Average Adjusted Gross Income (AGI) in 2004: $30,649 (Individual Income Tax Returns)
Here:
$30,649
State:
$43,875
Salary/wage: $29,159 (reported on 79.3% of returns)
Here:
$29,159
State:
$38,265
(% of AGI for various income ranges: 122.2% for AGIs below $10k, 69.2% for AGIs $10k-25k, 82.6% for AGIs $25k-50k, 81.4% for AGIs $50k-75k, 77.0% for AGIs $75k-100k, 39.5% for AGIs over 100k)
Taxable interest for individuals: $977 (reported on 51.1% of returns)
This zip code:
$977
Iowa:
$1,768
(% of AGI for various income ranges: 15.1% for AGIs below $10k, 2.5% for AGIs $10k-25k, 1.2% for AGIs $25k-50k, 1.0% for AGIs $50k-75k, 0.9% for AGIs $75k-100k, 1.3% for AGIs over 100k)
Taxable dividends: $625 (reported on 21.5% of returns)
Here:
$625
State:
$2,510
(% of AGI for various income ranges: 3.8% for AGIs below $10k, 0.8% for AGIs $10k-25k, 0.4% for AGIs $25k-50k, 0.1% for AGIs $50k-75k, 0.6% for AGIs $75k-100k)
Net capital gain/loss: +$1,579 (reported on 16.0% of returns)
Here:
+$1,579
State:
+$6,139
(% of AGI for various income ranges: -0.5% for AGIs below $10k, 0.5% for AGIs $10k-25k, 0.2% for AGIs $25k-50k, 2.9% for AGIs $50k-75k)
Profit/loss from business: +$1,252 (reported on 19.3% of returns)
Here:
+$1,252
State:
+$8,574
(% of AGI for various income ranges: 16.1% for AGIs below $10k, 3.0% for AGIs $10k-25k, -0.3% for AGIs $25k-50k, 0.4% for AGIs $50k-75k)
Total itemized deductions: $12,622 (22% of AGI, reported on 16.5% of returns)
Here:
$12,622
State:
$16,976
Here:
22.3% of AGI
State:
20.8% of AGI
(% of AGI for various income ranges: 7.9% for AGIs $10k-25k, 5.2% for AGIs $25k-50k, 7.1% for AGIs $50k-75k, 8.9% for AGIs $75k-100k, 9.2% for AGIs over 100k)
Charity contributions deductions: $1,653 (3% of AGI, reported on 12.6% of returns)
Here:
$1,653
State:
$3,089
Here:
3.0% of AGI
State:
3.6% of AGI
(% of AGI for various income ranges: 5.6% for AGIs below $10k, 0.4% for AGIs $25k-50k, 1.5% for AGIs $50k-75k, 0.4% for AGIs over 100k)
Total tax: $3,240 (reported on 72.9% of returns)
52626:
$3,240
State:
$6,177
(% of AGI for various income ranges: 6.1% for AGIs below $10k, 4.7% for AGIs $10k-25k, 6.4% for AGIs $25k-50k, 8.5% for AGIs $50k-75k, 12.1% for AGIs $75k-100k, 10.8% for AGIs over 100k)
Earned income credit: $1,436 (reported on 18.5% of returns)
Here:
$1,436
State:
$1,540
Percentage of individuals using paid preparers for their 2004 taxes: 85.4%
Here:
85%
State:
70%
(% for various income ranges: 89.1% for AGIs below $10k, 82.4% for AGIs $10k-25k, 87.1% for AGIs $25k-50k, 81.7% for AGIs $50k-75k, 90.9% for AGIs $75k-100k, 71.4% for AGIs over 100k)
Likely homosexual households (counted as self-reported same-sex unmarried-partner households)
Lesbian couples: 0.3% of all households
Gay men: 0.0% of all households
Household received Food Stamps/SNAP in the past 12 months: 25 Household did not receive Food Stamps/SNAP in the past 12 months: 494
Women who had a birth in the past 12 months: 1 (0 now married, 0 unmarried) Women who did not have a birth in the past 12 months: 188 (93 now married, 94 unmarried)
Housing units in zip code 52626 with a mortgage: 155 (3 second mortgage, 3 both second mortgage and home equity loan) Houses without a mortgage: 1
Median monthly owner costs for units with a mortgage: $1,099 Median monthly owner costs for units without a mortgage: $469
Residents with income below the poverty level in 2022:
This zip code:
17.2%
Whole state:
11.0%
Residents with income below 50% of the poverty level in 2022:
This zip code:
1.8%
Whole state:
5.5%
Median number of rooms in houses and condos:
Here:
6.1
State:
6.8
Median number of rooms in apartments:
Here:
4.7
State:
4.2
Notable locations in this zip code not listed on our city pages
Notable locations in zip code 52626: Riverview Campground (A), Farmington Fire Department and Emergency Medical Services (B), Farmington Public Library (C), Farmington City Hall (D), Pioneer Historical Museum (E). Display/hide their locations on the map
Churches in zip code 52626 include: Assembly of God Church (A), United Methodist Church (B), First Baptist Church (C), Church of the Nazarene (D), Sharon United Presbyterian Church (E), Embury Church (F). Display/hide their locations on the map
Cemeteries: Alfrey Cemetery (1), Boyer Cemetery (2), Farmington Cemetery (3), Green Glade Cemetery (4), Croton Cemetery (5), Johnson Cemetery (6), Pioneer Cemetery (7). Display/hide their locations on the map
Creeks: Big Indian Creek (A), Crooked Creek (B), Slaughter Creek (C), Little Rollins Creek (D), Grants Creek (E), Lick Creek (F), Flatrock Creek (G). Display/hide their locations on the map
Parks in zip code 52626 include: Shimek State Forest Wildlife Management Area - Farmington Unit (1), Shimek State Forest Wildlife Management Area - Croton Unit (2), Shimek State Forest Wildlife Management Area - Donnellson Unit (3), Shimek State Forest Wildlife Management Area - Lick Creek Unit (4), Amos Glover Historical Marker (5), Croton Civil War Memorial Park (6), Indian Lake Park (7), George Perkins Historical Marker (8). Display/hide their locations on the map
Size of family households: 143 2-persons, 36 3-persons, 55 4-persons, 17 5-persons, 22 6-persons, 3 7-or-more-persons
Size of nonfamily households: 219 1-person, 20 2-persons
231 married couples with children.
72 single-parent households (39 men, 33 women).
99.1% of residents of 52626 zip code speak English at home.
0.6% of residents speak Spanish at home (29% very well, 43% well, 29% not at all).
0.3% of residents speak other Indo-European language at home (100% very well).
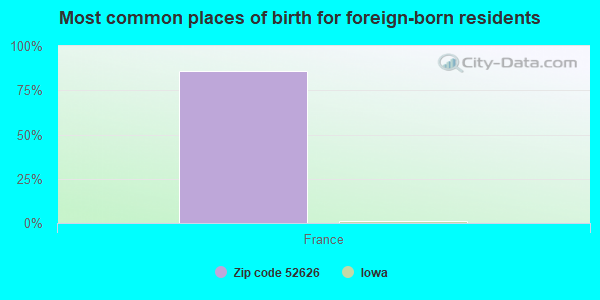
Foreign born population: 7 (0.6%) (58.0% of them are naturalized citizens)
This zip code:
0.6%
Whole state:
6.0%
86%France
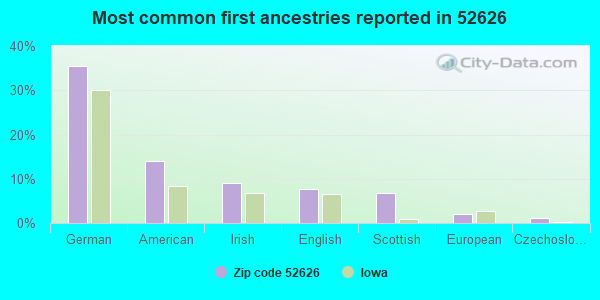
35%German
14%American
9%Irish
8%English
7%Scottish
2%European
1%Czechoslovakian
Year of entry for the foreign-born population
32010 or later
02000 to 2009
01990 to 1999
27Before 1990
Facilities with environmental interests located in this zip code:
DENLY AGRI SERVICE (509 WALNUT in FARMINGTON, IA)
(Resource Conservation and Recovery Act (tracking hazardous waste)) Organizations: ROBERT E DENLY DBA DENLY AGRI SERVICES (CONTACT/OWNER)
DENLY AGRI SERVICE (201 SOUTH 7TH STREET in FARMINGTON, IA)
COMPLIANCE ACTIVITY (Tracking inspections of insecticide, fungicide, and rodenticide, and toxic substances) Alternative names: BURKETT AGRI SERVICE CO
BURKETT AGRI SERVICES (509 WALNUT ST BOX 218 in FARMINGTON, IA)
COMPLIANCE ACTIVITY (Tracking inspections of insecticide, fungicide, and rodenticide, and toxic substances)
BURKETT AGRI SERVICES CO (PO BOX 157 in FARMINGTON, IA)
COMPLIANCE ACTIVITY (Tracking inspections of insecticide, fungicide, and rodenticide, and toxic substances)
SHIMEK FOREST HEADQURTERS WOOD TREAT (HIGHWAY J56 in FARMINGTON, IA)
TSD (Resource Conservation and Recovery Act (tracking hazardous waste)) Business NAICS classification: WOOD PRESERVATION. Alternative names: SHIMEK FOREST HQ WOOD TREAT
Housing units lacking complete plumbing facilities: 4.3% Housing units lacking complete kitchen facilities: 4.5%
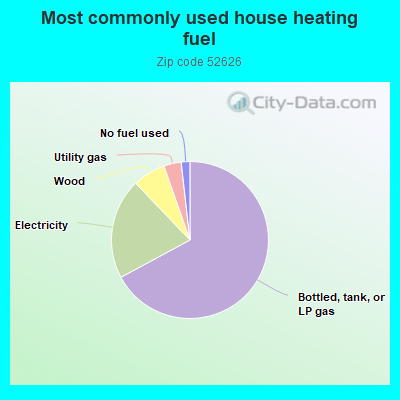
67.4%Bottled, tank, or LP gas
20.8%Electricity
6.8%Wood
3.6%Utility gas
1.8%No fuel used
Population in 1990: 961. Population change in the 1990s: +427 (+44.4%).
Place of birth for U.S.-born residents:
This state: 939
Northeast: 26
Midwest: 158
South: 20
West: 23
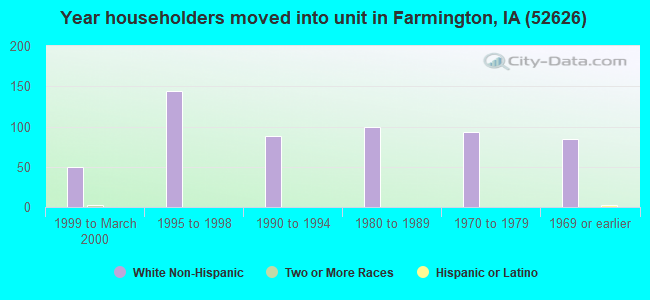
72% of the 52626 zip code residents lived in the same house 5 years ago. Out of people who lived in different houses, 48% lived in this county. Out of people who lived in different counties, 50% lived in Iowa.
94% of the 52626 zip code residents lived in the same house 1 year ago. Out of people who lived in different houses, 102% moved from different county within same state. Out of people who lived in different houses, 6% moved from different state.
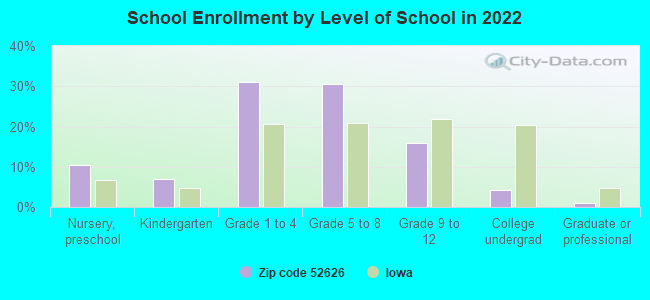
Private vs. public school enrollment:
Students in private schools in grades 1 to 8 (elementary and middle school): 62
Here:
32.7%
Iowa:
10.6%
Students in private schools in grades 9 to 12 (high school):
Here:
0.0%
Iowa:
7.9%
Students in private undergraduate colleges: 9
Here:
71.9%
Iowa:
23.9%
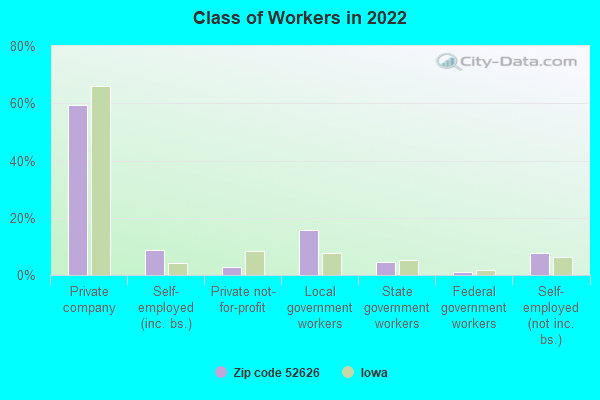
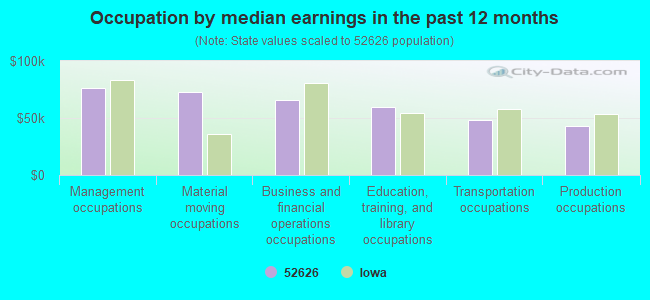
Occupation by median earnings in the past 12 months ($)
75,957Management occupations
72,534Material moving occupations
66,194Business and financial operations occupations
59,550Education, training, and library occupations
48,453Transportation occupations
43,002Production occupations
Top industries in this zip code by the number of employees in 2005:
Accommodation and Food Services: Full-Service Restaurants (10-19 employees: 1 establishment)
Construction: Roofing Contractors (5-9: 1)
Finance and Insurance: Commercial Banking (5-9: 1)
Finance and Insurance: Insurance Agencies and Brokerages (5-9: 1)
Other Services (except Public Administration): Religious Organizations (1-4: 2)
2002 - 2018 National Fire Incident Reporting System (NFIRS) incidents
According to the data from the years 2002 - 2018 the average number of fires per year is 11. The highest number of fire incidents - 19 took place in 2010, and the least - 1 in 2002. The data has an increasing trend.
When looking into fire subcategories, the most reports belonged to: Outside Fires (48.4%), and Structure Fires (34.0%).
Fire incident types reported to NFIRS in Zip Code 52626
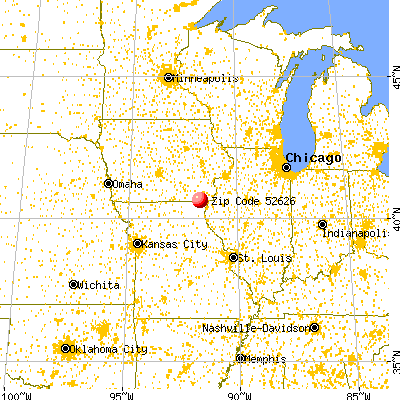


 Nearest zip codes: 52620, 63465, 52625, 52630, 63453, 52619.


 According to the data from the years 2002 - 2018 the average number of fires per year is 11. The highest number of fire incidents - 19 took place in 2010, and the least - 1 in 2002. The data has an increasing trend.
 When looking into fire subcategories, the most reports belonged to: Outside Fires (48.4%), and Structure Fires (34.0%).