Estimated zip code population in 2022: 12,327 Zip code population in 2010: 11,512 Zip code population in 2000: 10,906
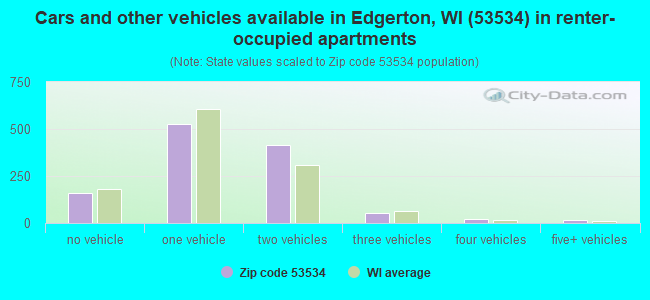
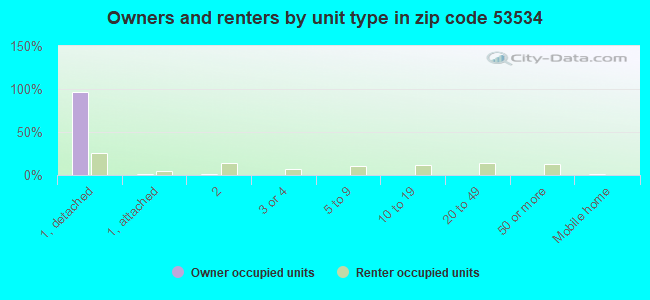
Houses and condos: 5,897 Renter-occupied apartments: 1,193
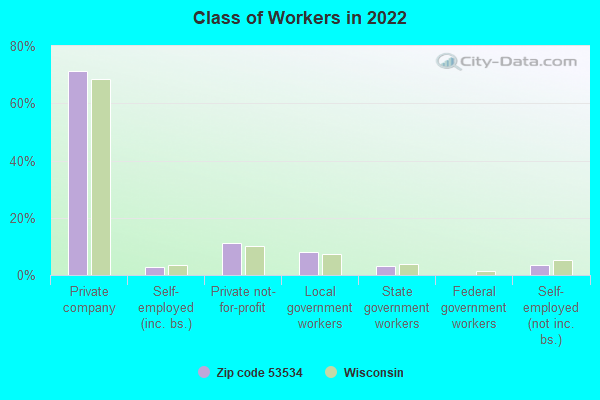
% of renters here:
25%
State:
32%
March 2022 cost of living index in zip code 53534: 93.6 (less than average, U.S. average is 100)
Land area: 81.3 sq. mi. Water area: 3.1 sq. mi.
Population density: 152 people per square mile
(very low).
OSM Map
General Map
Google Map
MSN Map
OSM Map
General Map
Google Map
MSN Map
OSM Map
General Map
Google Map
MSN Map
OSM Map
General Map
Google Map
MSN Map
Please wait while loading the map...
Real estate property taxes paid for housing units in 2022:
This zip code:
1.4% ($3,882)
Wisconsin:
1.4% ($3,497)
Median real estate property taxes paid for housing units with mortgages in 2022: $3,895 (1.3%) Median real estate property taxes paid for housing units with no mortgage in 2022: $3,850 (1.4%)
Business Search- 14 Million verified businesses
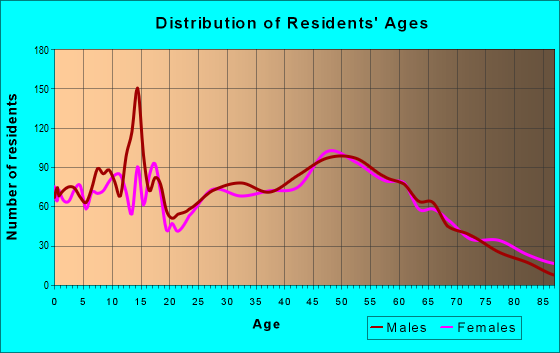
Males: 6,387
(51.8%)
Females: 5,940
(48.2%)
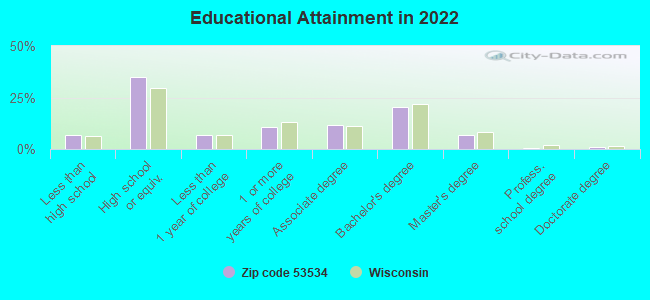
For population 25 years and over in 53534:
High school or higher: 93.3%
Bachelor's degree or higher: 29.0%
Graduate or professional degree: 8.4%
Unemployed: 2.5%
Mean travel time to work (commute): 27.4 minutes
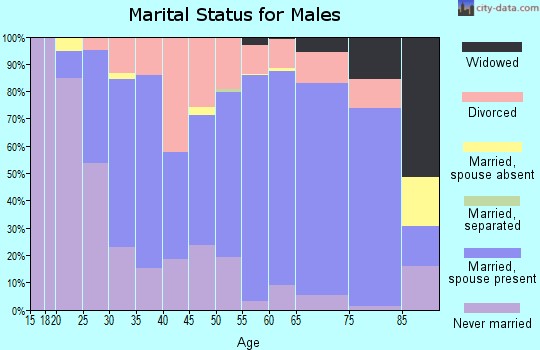
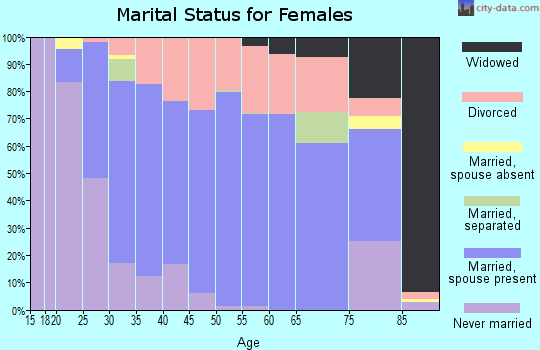
For population 15 years and over in 53534:
Never married: 25.3%
Now married: 55.1%
Separated: 0.7%
Widowed: 6.3%
Divorced: 12.6%
Zip code 53534 compared to state average:
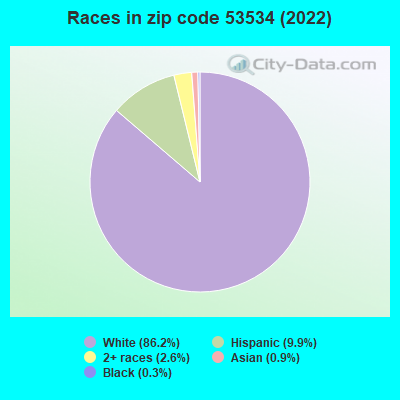
Black race population percentage significantly below state average.
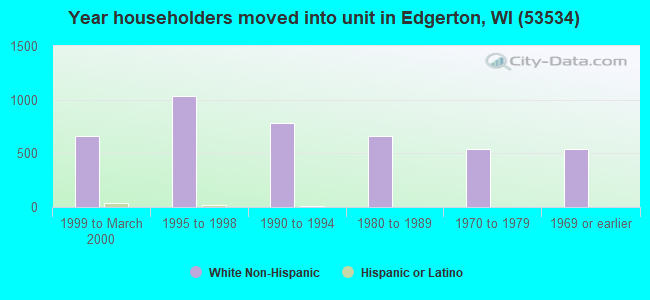
Length of stay since moving in above state average.
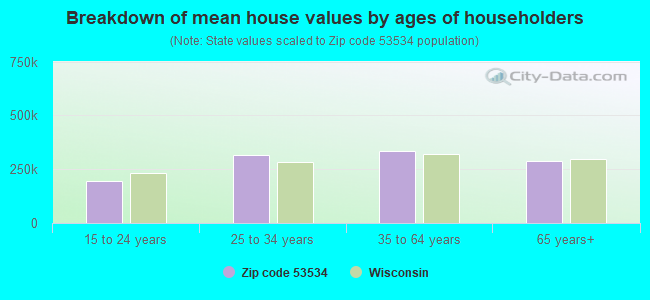
Estimated median house/condo value in 2022: $285,902
53534:
$285,902
Wisconsin:
$252,800
According to our research of Wisconsin and other state lists, there were 25 registered sex offenders living in 53534 zip code as of April 27, 2024. The ratio of all residents to sex offenders in zip code 53534 is 486 to 1. The ratio of registered sex offenders to all residents in this zip code is lower than the state average.
Median resident age:
This zip code:
40.9 years
Wisconsin median age:
40.4 years
Average household size:
This zip code:
2.5 people
Wisconsin:
2.3 people
Averages for the 2020 tax year for zip code 53534, filed in 2021:
Average Adjusted Gross Income (AGI) in 2020: $68,993 (Individual Income Tax Returns)
Here:
$68,993
State:
$72,319
Salary/wage: $60,312 (reported on 83.2% of returns)
Here:
$60,312
State:
$59,242
(% of AGI for various income ranges: 1102.5% for AGIs below $25k, 3548.7% for AGIs $25k-50k, 6573.4% for AGIs $50k-75k, 9769.1% for AGIs $75k-100k, 17410.1% for AGIs $100k-200k, 63988.3% for AGIs over 200k)
Taxable interest for individuals: $1,110 (reported on 40.1% of returns)
This zip code:
$1,110
Wisconsin:
$1,431
(% of AGI for various income ranges: 19.2% for AGIs below $25k, 23.4% for AGIs $25k-50k, 36.4% for AGIs $50k-75k, 46.9% for AGIs $75k-100k, 133.2% for AGIs $100k-200k, 1490.0% for AGIs over 200k)
Ordinary dividends: $4,077 (reported on 20.6% of returns)
Here:
$4,077
State:
$6,481
(% of AGI for various income ranges: 34.1% for AGIs below $25k, 34.9% for AGIs $25k-50k, 61.4% for AGIs $50k-75k, 105.1% for AGIs $75k-100k, 165.8% for AGIs $100k-200k, 4035.0% for AGIs over 200k)
Net capital gain/loss in AGI: +$10,463 (reported on 18.6% of returns)
Here:
+$10,463
State:
+$18,329
(% of AGI for various income ranges: 29.2% for AGIs below $25k, 32.1% for AGIs $25k-50k, 52.3% for AGIs $50k-75k, 160.4% for AGIs $75k-100k, 404.2% for AGIs $100k-200k, 13228.3% for AGIs over 200k)
Profit/loss from business: +$14,585 (reported on 10.7% of returns)
Here:
+$14,585
State:
+$14,562
(% of AGI for various income ranges: 46.8% for AGIs below $25k, 108.6% for AGIs $25k-50k, 171.7% for AGIs $50k-75k, 248.9% for AGIs $75k-100k, 548.5% for AGIs $100k-200k, 2613.3% for AGIs over 200k)
Taxable individual retirement arrangement distribution: $18,100 (reported on 11.9% of returns)
53534:
$18,100
Wisconsin:
$19,348
(% of AGI for various income ranges: 84.9% for AGIs below $25k, 162.5% for AGIs $25k-50k, 221.8% for AGIs $50k-75k, 401.8% for AGIs $75k-100k, 672.1% for AGIs $100k-200k, 3671.7% for AGIs over 200k)
Total itemized deductions: $25,506 (reported on 7.1% of returns)
Here:
$25,506
State:
$33,000
(% of AGI for various income ranges: 40.8% for AGIs below $25k, 89.4% for AGIs $25k-50k, 255.1% for AGIs $50k-75k, 390.0% for AGIs $75k-100k, 500.7% for AGIs $100k-200k, 3936.7% for AGIs over 200k)
Charity contributions: $6,730 (reported on 4.5% of returns)
Here:
$6,730
State:
$12,044
(% of AGI for various income ranges: 10.7% for AGIs $25k-50k, 11.7% for AGIs $50k-75k, 29.6% for AGIs $75k-100k, 97.3% for AGIs $100k-200k, 1515.0% for AGIs over 200k)
Taxes paid: $8,300 (reported on 7.1% of returns)
53534:
$8,300
State:
$8,228
(% of AGI for various income ranges: 8.2% for AGIs below $25k, 22.8% for AGIs $25k-50k, 103.8% for AGIs $50k-75k, 145.6% for AGIs $75k-100k, 176.3% for AGIs $100k-200k, 876.7% for AGIs over 200k)
Earned income credit: $1,761 (reported on 8.9% of returns)
Here:
$1,761
State:
$2,155
(% of AGI for various income ranges: 49.2% for AGIs below $25k, 36.4% for AGIs $25k-50k)
Percentage of individuals using paid preparers for their 2020 taxes: 94.9%
Here:
95%
State:
94%
(% for various income ranges: 91.8% for AGIs below $25k, 95.0% for AGIs $25k-50k, 96.6% for AGIs $50k-75k, 96.3% for AGIs $75k-100k, 96.6% for AGIs $100k-200k, 95.0% for AGIs over 200k)
Averages for the 2012 tax year for zip code 53534, filed in 2013:
Average Adjusted Gross Income (AGI) in 2012: $53,446 (Individual Income Tax Returns)
Here:
$53,446
State:
$57,939
Salary/wage: $44,912 (reported on 86.5% of returns)
Here:
$44,912
State:
$48,248
(% of AGI for various income ranges: 70.2% for AGIs below $25k, 77.0% for AGIs $25k-50k, 77.9% for AGIs $50k-75k, 81.0% for AGIs $75k-100k, 77.5% for AGIs $100k-200k, 37.3% for AGIs over 200k)
Taxable interest for individuals: $859 (reported on 41.4% of returns)
This zip code:
$859
Wisconsin:
$1,224
(% of AGI for various income ranges: 1.3% for AGIs below $25k, 0.8% for AGIs $25k-50k, 0.5% for AGIs $50k-75k, 0.2% for AGIs $75k-100k, 0.5% for AGIs $100k-200k, 1.6% for AGIs over 200k)
Ordinary dividends: $2,767 (reported on 21.1% of returns)
Here:
$2,767
State:
$5,137
(% of AGI for various income ranges: 1.6% for AGIs below $25k, 1.0% for AGIs $25k-50k, 0.8% for AGIs $50k-75k, 0.6% for AGIs $75k-100k, 1.1% for AGIs $100k-200k, 2.1% for AGIs over 200k)
Net capital gain/loss in AGI: +$5,040 (reported on 16.8% of returns)
Here:
+$5,040
State:
+$11,137
(% of AGI for various income ranges: 0.5% for AGIs $25k-50k, 0.8% for AGIs $50k-75k, 0.8% for AGIs $75k-100k, 1.8% for AGIs $100k-200k, 6.1% for AGIs over 200k)
Profit/loss from business: +$8,987 (reported on 12.3% of returns)
Here:
+$8,987
State:
+$11,943
(% of AGI for various income ranges: 5.1% for AGIs below $25k, 1.5% for AGIs $25k-50k, 2.0% for AGIs $50k-75k, 1.9% for AGIs $75k-100k, 2.8% for AGIs $100k-200k)
Taxable individual retirement arrangement distribution: $11,255 (reported on 12.7% of returns)
53534:
$11,255
Wisconsin:
$14,087
(% of AGI for various income ranges: 4.2% for AGIs below $25k, 3.2% for AGIs $25k-50k, 2.4% for AGIs $50k-75k, 2.1% for AGIs $75k-100k, 2.6% for AGIs $100k-200k, 2.3% for AGIs over 200k)
Total itemized deductions: $19,047 (22% of AGI, reported on 39.0% of returns)
Here:
$19,047
State:
$22,257
Here:
21.6% of AGI
State:
20.1% of AGI
(% of AGI for various income ranges: 12.8% for AGIs below $25k, 11.7% for AGIs $25k-50k, 14.2% for AGIs $50k-75k, 15.1% for AGIs $75k-100k, 15.8% for AGIs $100k-200k, 11.7% for AGIs over 200k)
Charity contributions: $2,395 (reported on 28.6% of returns)
Here:
$2,395
State:
$3,370
(% of AGI for various income ranges: 0.7% for AGIs below $25k, 0.7% for AGIs $25k-50k, 1.0% for AGIs $50k-75k, 1.0% for AGIs $75k-100k, 1.5% for AGIs $100k-200k, 3.0% for AGIs over 200k)
Taxes paid: $8,856 (reported on 39.0% of returns)
53534:
$8,856
State:
$10,731
(% of AGI for various income ranges: 2.9% for AGIs below $25k, 4.5% for AGIs $25k-50k, 5.9% for AGIs $50k-75k, 7.1% for AGIs $75k-100k, 8.3% for AGIs $100k-200k, 7.8% for AGIs over 200k)
Earned income credit: $1,893 (reported on 12.7% of returns)
Here:
$1,893
State:
$2,094
(% of AGI for various income ranges: 4.3% for AGIs below $25k, 0.7% for AGIs $25k-50k)
Percentage of individuals using paid preparers for their 2012 taxes: 60.5%
Here:
60%
State:
54%
(% for various income ranges: 55.2% for AGIs below $25k, 59.9% for AGIs $25k-50k, 64.9% for AGIs $50k-75k, 64.7% for AGIs $75k-100k, 63.8% for AGIs $100k-200k, 87.5% for AGIs over 200k)
Averages for the 2004 tax year for zip code 53534, filed in 2005:
Average Adjusted Gross Income (AGI) in 2004: $43,980 (Individual Income Tax Returns)
Here:
$43,980
State:
$47,735
Salary/wage: $39,140 (reported on 87.9% of returns)
Here:
$39,140
State:
$41,540
(% of AGI for various income ranges: 116.3% for AGIs below $10k, 71.9% for AGIs $10k-25k, 81.6% for AGIs $25k-50k, 83.1% for AGIs $50k-75k, 85.1% for AGIs $75k-100k, 63.8% for AGIs over 100k)
Taxable interest for individuals: $965 (reported on 54.5% of returns)
This zip code:
$965
Wisconsin:
$1,420
(% of AGI for various income ranges: 8.1% for AGIs below $10k, 2.6% for AGIs $10k-25k, 0.9% for AGIs $25k-50k, 0.8% for AGIs $50k-75k, 0.7% for AGIs $75k-100k, 1.4% for AGIs over 100k)
Taxable dividends: $1,516 (reported on 25.5% of returns)
Here:
$1,516
State:
$2,869
(% of AGI for various income ranges: 3.8% for AGIs below $10k, 1.3% for AGIs $10k-25k, 0.8% for AGIs $25k-50k, 0.5% for AGIs $50k-75k, 0.6% for AGIs $75k-100k, 1.3% for AGIs over 100k)
Net capital gain/loss: +$6,727 (reported on 18.0% of returns)
Here:
+$6,727
State:
+$9,569
(% of AGI for various income ranges: -2.4% for AGIs below $10k, 0.4% for AGIs $10k-25k, 0.8% for AGIs $25k-50k, 1.0% for AGIs $50k-75k, 2.0% for AGIs $75k-100k, 8.4% for AGIs over 100k)
Profit/loss from business: +$8,933 (reported on 13.0% of returns)
Here:
+$8,933
State:
+$10,417
(% of AGI for various income ranges: 4.7% for AGIs below $10k, 4.0% for AGIs $10k-25k, 2.0% for AGIs $25k-50k, 2.1% for AGIs $50k-75k, 2.0% for AGIs $75k-100k, 3.8% for AGIs over 100k)
IRA payment deduction: $2,601 (reported on 2.5% of returns)
53534:
$2,601
Wisconsin:
$2,900
(% of AGI for various income ranges: 0.2% for AGIs $10k-25k, 0.2% for AGIs $25k-50k, 0.1% for AGIs $50k-75k, 0.1% for AGIs $75k-100k, 0.1% for AGIs over 100k)
Self-employed pension: $9,143 (reported on 0.5% of returns)
Here:
$9,143
Wisconsin:
$11,934
Total itemized deductions: $15,937 (23% of AGI, reported on 42.0% of returns)
Here:
$15,937
State:
$18,160
Here:
22.6% of AGI
State:
21.1% of AGI
(% of AGI for various income ranges: 15.5% for AGIs below $10k, 11.4% for AGIs $10k-25k, 13.4% for AGIs $25k-50k, 15.9% for AGIs $50k-75k, 17.3% for AGIs $75k-100k, 15.7% for AGIs over 100k)
Charity contributions deductions: $1,623 (2% of AGI, reported on 35.0% of returns)
Here:
$1,623
State:
$2,711
Here:
2.2% of AGI
State:
3.0% of AGI
(% of AGI for various income ranges: 0.9% for AGIs below $10k, 0.7% for AGIs $10k-25k, 0.9% for AGIs $25k-50k, 1.1% for AGIs $50k-75k, 1.4% for AGIs $75k-100k, 2.0% for AGIs over 100k)
Total tax: $5,458 (reported on 80.6% of returns)
53534:
$5,458
State:
$7,114
(% of AGI for various income ranges: 3.0% for AGIs below $10k, 4.5% for AGIs $10k-25k, 7.3% for AGIs $25k-50k, 8.4% for AGIs $50k-75k, 9.8% for AGIs $75k-100k, 17.1% for AGIs over 100k)
Earned income credit: $1,338 (reported on 8.8% of returns)
Here:
$1,338
State:
$1,544
Percentage of individuals using paid preparers for their 2004 taxes: 62.9%
Here:
63%
State:
57%
(% for various income ranges: 53.4% for AGIs below $10k, 62.1% for AGIs $10k-25k, 62.4% for AGIs $25k-50k, 68.3% for AGIs $50k-75k, 65.9% for AGIs $75k-100k, 74.5% for AGIs over 100k)
Likely homosexual households (counted as self-reported same-sex unmarried-partner households)
Lesbian couples: 0.1% of all households
Gay men: 0.0% of all households
Household received Food Stamps/SNAP in the past 12 months: 419 Household did not receive Food Stamps/SNAP in the past 12 months: 4,421
Women who had a birth in the past 12 months: 165 (109 now married, 55 unmarried) Women who did not have a birth in the past 12 months: 2,267 (1,227 now married, 1,039 unmarried)
Housing units in zip code 53534 with a mortgage: 2,511 (277 second mortgage, 3 home equity loan, 262 both second mortgage and home equity loan) Houses without a mortgage: 76
Median monthly owner costs for units with a mortgage: $1,614 Median monthly owner costs for units without a mortgage: $692
Residents with income below the poverty level in 2022:
This zip code:
6.4%
Whole state:
10.7%
Residents with income below 50% of the poverty level in 2022:
This zip code:
2.4%
Whole state:
5.7%
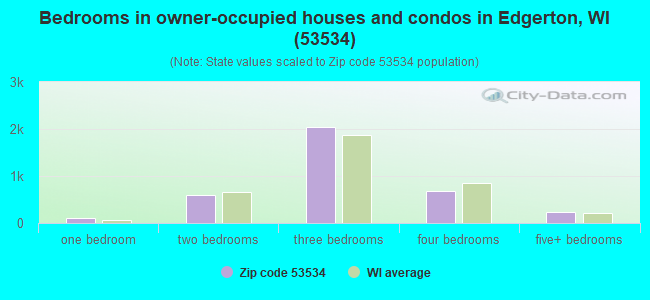
Median number of rooms in houses and condos:
Here:
6.7
State:
6.5
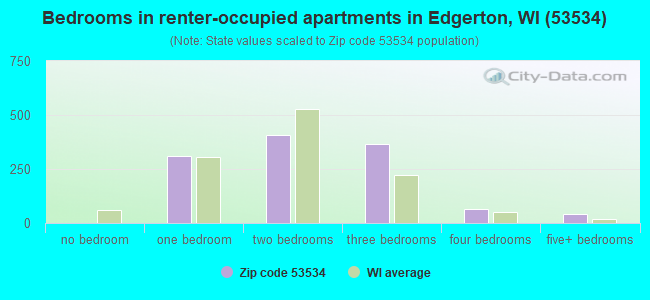
Median number of rooms in apartments:
Here:
4.5
State:
4.1
Notable locations in this zip code not listed on our city pages
Notable locations in zip code 53534: Towne Country Club (A), Hickory Hill Girl Scout Camp (B), Edgerton Wastewater Treatment Plant (C), Veterans Memorial Building (D), Tri-County Community Center (E), Tobacco City Museum (F), Edgerton Public Library (G), Edgerton City Hall (H), Curtis Universal Ambulance Service Edgerton (I), Edgerton Fire District (J). Display/hide their locations on the map
Churches in zip code 53534 include: Albion Prairie Church (A), Trinity Lutheran Church (B), Saint Joseph Catholic Church (C), Saint Johns Evangelical Lutheran Church (D), First Congregational Church (E), Central Lutheran Church (F). Display/hide their locations on the map
Cemeteries: Jenson Cemetery (1), Saint Joseph Cemetery (2), Albion Prairie Cemetery (3), Sweet Cemetery (4), Evergreen Cemetery (5), Fassett Cemetery (6), Fulton Cemetery (7). Display/hide their locations on the map
Lakes, reservoirs, and swamps: Rice Lake (A), Lake Koshkonong 2594 (B), 450 Reservoir (C), Fulton Pond 553 (D), Muskrat Lake (E), Turtle Lake (F), Sweet Lake (G). Display/hide their locations on the map
In group quarters: 130 (-1 institutionalized population)
Size of family households: 1,481 2-persons, 760 3-persons, 719 4-persons, 214 5-persons, 96 6-persons, 38 7-or-more-persons
Size of nonfamily households: 1,196 1-person, 287 2-persons, 52 3-persons
1,965 married couples with children.
786 single-parent households (325 men, 461 women).
90.5% of residents of 53534 zip code speak English at home.
8.3% of residents speak Spanish at home (61% very well, 20% well, 12% not well, 7% not at all).
0.4% of residents speak other Indo-European language at home (100% very well).
0.3% of residents speak Asian or Pacific Island language at home (26% very well, 74% well).
0.2% of residents speak other language at home (100% very well).
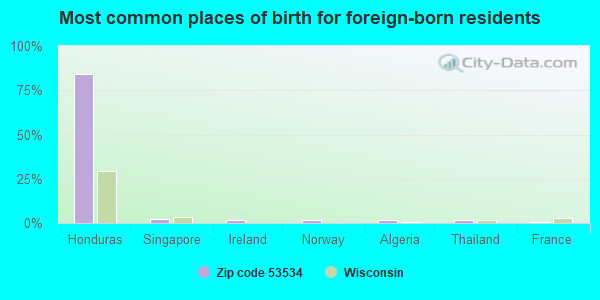
Foreign born population: 476 (3.9%) (60.9% of them are naturalized citizens)
This zip code:
3.9%
Whole state:
5.0%
84%Honduras
2%Singapore
2%Ireland
2%Norway
2%Algeria
2%Thailand
1%France
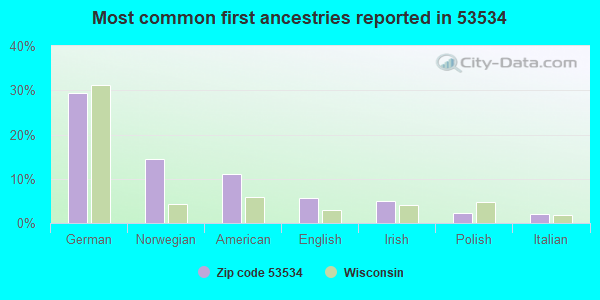
29%German
14%Norwegian
11%American
6%English
5%Irish
2%Polish
2%Italian
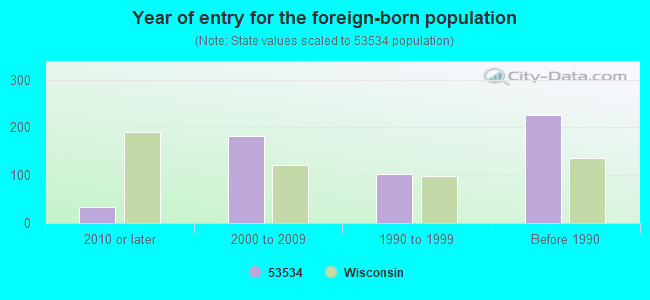
Year of entry for the foreign-born population
332010 or later
1832000 to 2009
1031990 to 1999
226Before 1990
Facilities with environmental interests located in this zip code:
59& I90 TRUCKS& PARTS INC (325 HWY 59 E in EDGERTON, WI)
Conditionally Exempt Small Quantity Generators, less than 100 kg/month of hazardous waste (Resource Conservation and Recovery Act (tracking hazardous waste)) STATE MASTER (Wisconsin database) - RCRAINFO-WID988598165, CESQG Business SIC classification: MOTOR VEHICLE PARTS, USED Alternative names: 59 AND I 90 TRUCKS AND PARTS INC
ANCHOR INN (709 E HWY 59 in EDGERTON, WI)
Conditionally Exempt Small Quantity Generators, less than 100 kg/month of hazardous waste (Resource Conservation and Recovery Act (tracking hazardous waste)) - notification STATE MASTER (Wisconsin database) - SDWIS-WI1540179, DRINKING WATER SYSTEM Organizations: JOHN KINNETH (CONTACT/OWNER)
BUSSEY DISHWASHER SERVICE INCORPORATED (893 HIGHWAY 73 in EDGERTON, WI)
(Integrated Compliance Information System) - ICIS-05-1991-0098, FORMAL ENFORCEMENT ACTION COMPLIANCE ACTIVITY (Tracking inspections of insecticide, fungicide, and rodenticide, and toxic substances) Business SIC classification: EQUIPMENT RENTAL AND LEASING
CATERPILLAR TRACTOR (1220 W. FULTON ST. in EDGERTON, WI)
AIR MINOR (AIRS/AFS) (Resource Conservation and Recovery Act (tracking hazardous waste)) Business SIC classification: TRAVEL TRAILERS AND CAMPERS Alternative names: CATERPILLAR TRACTOR CO EDGERTON FACILITY
BRIDGE 53-3 CTH M OVR YAHARA RVR (0.1 MILE EAST OF CTH H in EDGERTON, WI)
Large Quantity Generators, more that 1000 kg of hazardous waste/month (Resource Conservation and Recovery Act (tracking hazardous waste)) Organizations: ROCK CNTY DPW (CONTACT/OPERATOR)
190/59 LAND LLC (400 E STH 59 in EDGERTON, WI)
(Resource Conservation and Recovery Act (tracking hazardous waste))
CASSELS MELVIN A (30 COX RD in EDGERTON, WI)
(Resource Conservation and Recovery Act (tracking hazardous waste))
ALLIANT ENERGY- SHEEPSKIN (STH 59 WEST in EDGERTON, WI)
AIR MAJOR (AIRS/AFS) CRITERIA AND HAZARDOUS AIR POLLUTANT INVENTORY (Inventory of air pollution sources) Business SIC classification: ELECTRIC SERVICES; ELECTRIC AND OTHER SERVICES COMBINED Alternative names: ALLIANT ENERGY WPL SHEEPSKIN GEN STN, WIS PWR & LIGHT-ROCK RIVER GEN STATION
Housing units lacking complete plumbing facilities: 1.2% Housing units lacking complete kitchen facilities: 2.2%
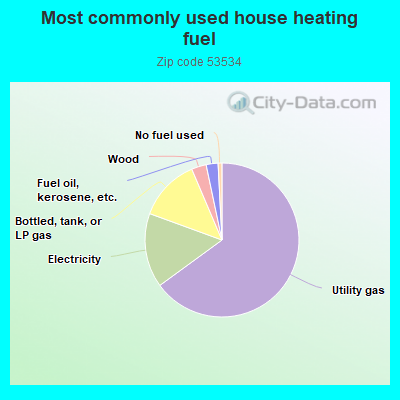
64.9%Utility gas
15.6%Electricity
13.0%Bottled, tank, or LP gas
3.1%Wood
2.5%Fuel oil, kerosene, etc.
0.8%No fuel used
Population in 1990: 9,749. Population change in the 1990s: +1,157 (+11.9%).
Place of birth for U.S.-born residents:
This state: 9,379
Northeast: 174
Midwest: 1,717
South: 233
West: 226
60% of the 53534 zip code residents lived in the same house 5 years ago. Out of people who lived in different houses, 49% lived in this county. Out of people who lived in different counties, 50% lived in Wisconsin.
88% of the 53534 zip code residents lived in the same house 1 year ago. Out of people who lived in different houses, 56% moved from this county. Out of people who lived in different houses, 33% moved from different county within same state. Out of people who lived in different houses, 7% moved from different state. Out of people who lived in different houses, 3% moved from abroad.
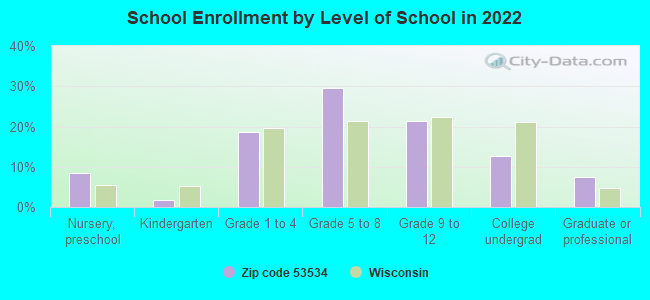
Private vs. public school enrollment:
Students in private schools in grades 1 to 8 (elementary and middle school): 89
Here:
6.1%
Wisconsin:
16.7%
Students in private schools in grades 9 to 12 (high school): 8
Here:
1.3%
Wisconsin:
12.5%
Students in private undergraduate colleges: 23
Here:
6.1%
Wisconsin:
17.5%
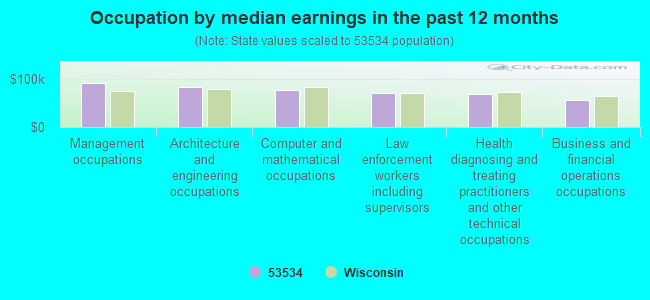
Occupation by median earnings in the past 12 months ($)
90,889Management occupations
82,924Architecture and engineering occupations
75,678Computer and mathematical occupations
69,782Law enforcement workers including supervisors
68,700Health diagnosing and treating practitioners and other technical occupations
55,613Business and financial operations occupations
Top industries in this zip code by the number of employees in 2005:
Health Care and Social Assistance: General Medical and Surgical Hospitals (100-249 employees: 1 establishment)
2002 - 2018 National Fire Incident Reporting System (NFIRS) incidents
According to the data from the years 2002 - 2018 the average number of fires per year is 46. The highest number of reported fires - 87 took place in 2012, and the least - 18 in 2006. The data has a decreasing trend.
When looking into fire subcategories, the most incidents belonged to: Structure Fires (48.1%), and Outside Fires (25.1%).
Fire incident types reported to NFIRS in Zip Code 53534
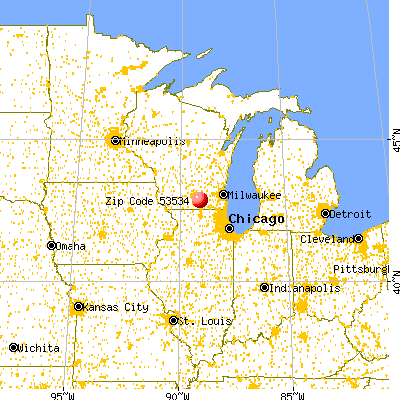


 Nearest zip codes: 53545, 53589, 53523, 53548, 53563, 53536.


 According to the data from the years 2002 - 2018 the average number of fires per year is 46. The highest number of reported fires - 87 took place in 2012, and the least - 18 in 2006. The data has a decreasing trend.
 When looking into fire subcategories, the most incidents belonged to: Structure Fires (48.1%), and Outside Fires (25.1%).