Estimated zip code population in 2022: 24,079 Zip code population in 2010: 23,117 Zip code population in 2000: 41,957
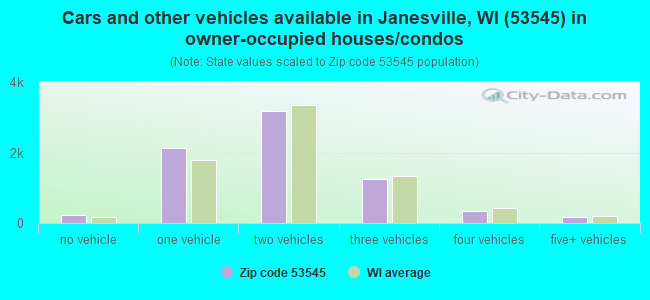
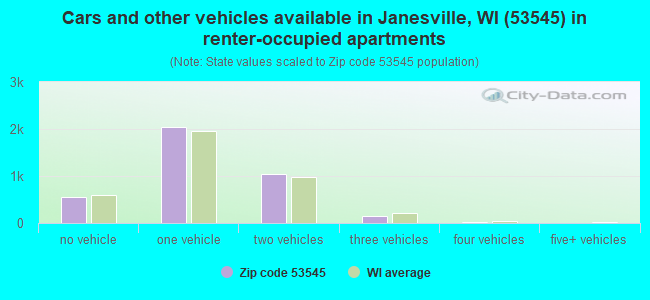
Houses and condos: 11,279 Renter-occupied apartments: 3,807
% of renters here:
34%
State:
32%
March 2022 cost of living index in zip code 53545: 92.8 (less than average, U.S. average is 100)
Land area: 24.8 sq. mi. Water area: 0.4 sq. mi.
Population density: 972 people per square mile
(low).
OSM Map
General Map
Google Map
MSN Map
OSM Map
General Map
Google Map
MSN Map
OSM Map
General Map
Google Map
MSN Map
OSM Map
General Map
Google Map
MSN Map
Please wait while loading the map...
Real estate property taxes paid for housing units in 2022:
This zip code:
1.5% ($3,101)
Wisconsin:
1.4% ($3,497)
Median real estate property taxes paid for housing units with mortgages in 2022: $2,966 (1.5%) Median real estate property taxes paid for housing units with no mortgage in 2022: $3,303 (1.6%)
Averages for the 2020 tax year for zip code 53545, filed in 2021:
Average Adjusted Gross Income (AGI) in 2020: $72,592 (Individual Income Tax Returns)
Here:
$72,592
State:
$72,319
Salary/wage: $52,118 (reported on 81.8% of returns)
Here:
$52,118
State:
$59,242
(% of AGI for various income ranges: 1133.9% for AGIs below $25k, 3618.5% for AGIs $25k-50k, 6412.9% for AGIs $50k-75k, 9368.8% for AGIs $75k-100k, 16780.7% for AGIs $100k-200k, 82236.0% for AGIs over 200k)
Taxable interest for individuals: $1,586 (reported on 34.5% of returns)
This zip code:
$1,586
Wisconsin:
$1,431
(% of AGI for various income ranges: 17.5% for AGIs below $25k, 21.2% for AGIs $25k-50k, 28.4% for AGIs $50k-75k, 51.1% for AGIs $75k-100k, 143.1% for AGIs $100k-200k, 3575.0% for AGIs over 200k)
Ordinary dividends: $8,209 (reported on 19.2% of returns)
Here:
$8,209
State:
$6,481
(% of AGI for various income ranges: 22.8% for AGIs below $25k, 34.1% for AGIs $25k-50k, 80.1% for AGIs $50k-75k, 137.3% for AGIs $75k-100k, 394.0% for AGIs $100k-200k, 11965.0% for AGIs over 200k)
Net capital gain/loss in AGI: +$29,826 (reported on 16.3% of returns)
Here:
+$29,826
State:
+$18,329
(% of AGI for various income ranges: 11.3% for AGIs below $25k, 23.9% for AGIs $25k-50k, 87.0% for AGIs $50k-75k, 158.6% for AGIs $75k-100k, 620.9% for AGIs $100k-200k, 50222.0% for AGIs over 200k)
Profit/loss from business: +$13,081 (reported on 10.3% of returns)
Here:
+$13,081
State:
+$14,562
(% of AGI for various income ranges: 76.5% for AGIs below $25k, 101.4% for AGIs $25k-50k, 99.5% for AGIs $50k-75k, 197.1% for AGIs $75k-100k, 391.6% for AGIs $100k-200k, 5245.0% for AGIs over 200k)
Taxable individual retirement arrangement distribution: $18,800 (reported on 11.8% of returns)
53545:
$18,800
Wisconsin:
$19,348
(% of AGI for various income ranges: 84.0% for AGIs below $25k, 121.1% for AGIs $25k-50k, 247.0% for AGIs $50k-75k, 441.3% for AGIs $75k-100k, 982.6% for AGIs $100k-200k, 6059.0% for AGIs over 200k)
Self-employed (Keogh) retirement plans: $22,100 (reported on 0.2% of returns)
53545:
$22,100
Wisconsin:
$21,322
(% of AGI for various income ranges: 54.6% for AGIs $100k-200k)
Total itemized deductions: $32,634 (reported on 4.9% of returns)
Here:
$32,634
State:
$33,000
(% of AGI for various income ranges: 61.9% for AGIs below $25k, 66.2% for AGIs $25k-50k, 175.0% for AGIs $50k-75k, 290.7% for AGIs $75k-100k, 573.1% for AGIs $100k-200k, 6266.0% for AGIs over 200k)
Charity contributions: $13,070 (reported on 3.3% of returns)
Here:
$13,070
State:
$12,044
(% of AGI for various income ranges: 2.3% for AGIs below $25k, 10.2% for AGIs $25k-50k, 18.3% for AGIs $50k-75k, 40.8% for AGIs $75k-100k, 118.5% for AGIs $100k-200k, 3333.0% for AGIs over 200k)
Taxes paid: $7,878 (reported on 4.8% of returns)
53545:
$7,878
State:
$8,228
(% of AGI for various income ranges: 6.4% for AGIs below $25k, 13.7% for AGIs $25k-50k, 48.6% for AGIs $50k-75k, 102.0% for AGIs $75k-100k, 162.7% for AGIs $100k-200k, 1167.0% for AGIs over 200k)
Earned income credit: $2,013 (reported on 13.6% of returns)
Here:
$2,013
State:
$2,155
(% of AGI for various income ranges: 74.2% for AGIs below $25k, 48.9% for AGIs $25k-50k, 1.3% for AGIs $50k-75k)
Percentage of individuals using paid preparers for their 2020 taxes: 95.2%
Here:
95%
State:
94%
(% for various income ranges: 93.9% for AGIs below $25k, 95.8% for AGIs $25k-50k, 96.9% for AGIs $50k-75k, 95.2% for AGIs $75k-100k, 95.1% for AGIs $100k-200k, 94.3% for AGIs over 200k)
Averages for the 2012 tax year for zip code 53545, filed in 2013:
Average Adjusted Gross Income (AGI) in 2012: $56,836 (Individual Income Tax Returns)
Here:
$56,836
State:
$57,939
Salary/wage: $42,679 (reported on 84.6% of returns)
Here:
$42,679
State:
$48,248
(% of AGI for various income ranges: 70.9% for AGIs below $25k, 75.8% for AGIs $25k-50k, 73.9% for AGIs $50k-75k, 73.7% for AGIs $75k-100k, 73.4% for AGIs $100k-200k, 36.1% for AGIs over 200k)
Taxable interest for individuals: $1,491 (reported on 38.8% of returns)
This zip code:
$1,491
Wisconsin:
$1,224
(% of AGI for various income ranges: 1.5% for AGIs below $25k, 0.7% for AGIs $25k-50k, 0.7% for AGIs $50k-75k, 0.6% for AGIs $75k-100k, 0.5% for AGIs $100k-200k, 1.8% for AGIs over 200k)
Ordinary dividends: $5,805 (reported on 21.1% of returns)
Here:
$5,805
State:
$5,137
(% of AGI for various income ranges: 1.6% for AGIs below $25k, 1.0% for AGIs $25k-50k, 1.1% for AGIs $50k-75k, 1.3% for AGIs $75k-100k, 2.5% for AGIs $100k-200k, 3.8% for AGIs over 200k)
Net capital gain/loss in AGI: +$13,591 (reported on 14.3% of returns)
Here:
+$13,591
State:
+$11,137
(% of AGI for various income ranges: 0.3% for AGIs $25k-50k, 0.3% for AGIs $50k-75k, 0.6% for AGIs $75k-100k, 1.8% for AGIs $100k-200k, 10.7% for AGIs over 200k)
Profit/loss from business: +$9,334 (reported on 10.1% of returns)
Here:
+$9,334
State:
+$11,943
(% of AGI for various income ranges: 3.8% for AGIs below $25k, 1.5% for AGIs $25k-50k, 1.9% for AGIs $50k-75k, 2.2% for AGIs $75k-100k, 1.9% for AGIs $100k-200k, 0.6% for AGIs over 200k)
Taxable individual retirement arrangement distribution: $13,566 (reported on 13.2% of returns)
53545:
$13,566
Wisconsin:
$14,087
(% of AGI for various income ranges: 4.6% for AGIs below $25k, 2.8% for AGIs $25k-50k, 2.9% for AGIs $50k-75k, 3.3% for AGIs $75k-100k, 4.4% for AGIs $100k-200k, 2.2% for AGIs over 200k)
Self-employment retirement plans: $20,375 (reported on 0.3% of returns)
53545:
$20,375
Wisconsin:
$17,048
Total itemized deductions: $22,032 (19% of AGI, reported on 31.8% of returns)
Here:
$22,032
State:
$22,257
Here:
18.9% of AGI
State:
20.1% of AGI
(% of AGI for various income ranges: 9.7% for AGIs below $25k, 9.0% for AGIs $25k-50k, 12.8% for AGIs $50k-75k, 13.6% for AGIs $75k-100k, 15.3% for AGIs $100k-200k, 12.3% for AGIs over 200k)
Charity contributions: $3,252 (reported on 24.7% of returns)
Here:
$3,252
State:
$3,370
(% of AGI for various income ranges: 0.8% for AGIs below $25k, 0.8% for AGIs $25k-50k, 1.3% for AGIs $50k-75k, 1.5% for AGIs $75k-100k, 2.1% for AGIs $100k-200k, 1.6% for AGIs over 200k)
Taxes paid: $10,805 (reported on 31.7% of returns)
53545:
$10,805
State:
$10,731
(% of AGI for various income ranges: 2.3% for AGIs below $25k, 3.2% for AGIs $25k-50k, 4.9% for AGIs $50k-75k, 6.2% for AGIs $75k-100k, 8.0% for AGIs $100k-200k, 8.2% for AGIs over 200k)
Earned income credit: $1,945 (reported on 15.9% of returns)
Here:
$1,945
State:
$2,094
(% of AGI for various income ranges: 4.8% for AGIs below $25k, 0.9% for AGIs $25k-50k)
Percentage of individuals using paid preparers for their 2012 taxes: 55.5%
Here:
56%
State:
54%
(% for various income ranges: 49.0% for AGIs below $25k, 56.3% for AGIs $25k-50k, 61.1% for AGIs $50k-75k, 60.8% for AGIs $75k-100k, 63.3% for AGIs $100k-200k, 81.8% for AGIs over 200k)
Averages for the 2004 tax year for zip code 53545, filed in 2005:
Average Adjusted Gross Income (AGI) in 2004: $54,436 (Individual Income Tax Returns)
Here:
$54,436
State:
$47,735
Salary/wage: $40,435 (reported on 85.6% of returns)
Here:
$40,435
State:
$41,540
(% of AGI for various income ranges: 168.0% for AGIs below $10k, 68.4% for AGIs $10k-25k, 77.0% for AGIs $25k-50k, 80.8% for AGIs $50k-75k, 83.1% for AGIs $75k-100k, 42.0% for AGIs over 100k)
Taxable interest for individuals: $1,856 (reported on 53.2% of returns)
This zip code:
$1,856
Wisconsin:
$1,420
(% of AGI for various income ranges: 11.1% for AGIs below $10k, 3.7% for AGIs $10k-25k, 1.6% for AGIs $25k-50k, 0.8% for AGIs $50k-75k, 1.1% for AGIs $75k-100k, 2.0% for AGIs over 100k)
Taxable dividends: $3,168 (reported on 29.0% of returns)
Here:
$3,168
State:
$2,869
(% of AGI for various income ranges: 7.8% for AGIs below $10k, 2.2% for AGIs $10k-25k, 1.4% for AGIs $25k-50k, 0.9% for AGIs $50k-75k, 1.1% for AGIs $75k-100k, 2.1% for AGIs over 100k)
Net capital gain/loss: +$9,580 (reported on 21.4% of returns)
Here:
+$9,580
State:
+$9,569
(% of AGI for various income ranges: -1.2% for AGIs below $10k, 0.5% for AGIs $10k-25k, 0.8% for AGIs $25k-50k, 0.8% for AGIs $50k-75k, 0.7% for AGIs $75k-100k, 7.8% for AGIs over 100k)
Profit/loss from business: +$8,041 (reported on 11.3% of returns)
Here:
+$8,041
State:
+$10,417
(% of AGI for various income ranges: 0.0% for AGIs below $10k, 2.4% for AGIs $10k-25k, 1.5% for AGIs $25k-50k, 1.9% for AGIs $50k-75k, 1.3% for AGIs $75k-100k, 1.7% for AGIs over 100k)
IRA payment deduction: $2,811 (reported on 2.0% of returns)
53545:
$2,811
Wisconsin:
$2,900
(% of AGI for various income ranges: 0.2% for AGIs $10k-25k, 0.2% for AGIs $25k-50k, 0.1% for AGIs $50k-75k, 0.1% for AGIs $75k-100k, 0.0% for AGIs over 100k)
Self-employed pension: $12,121 (reported on 0.5% of returns)
Here:
$12,121
Wisconsin:
$11,934
Total itemized deductions: $18,415 (18% of AGI, reported on 39.4% of returns)
Here:
$18,415
State:
$18,160
Here:
18.5% of AGI
State:
21.1% of AGI
(% of AGI for various income ranges: 19.6% for AGIs below $10k, 10.4% for AGIs $10k-25k, 12.6% for AGIs $25k-50k, 15.0% for AGIs $50k-75k, 16.3% for AGIs $75k-100k, 12.4% for AGIs over 100k)
Charity contributions deductions: $3,360 (3% of AGI, reported on 33.9% of returns)
Here:
$3,360
State:
$2,711
Here:
3.1% of AGI
State:
3.0% of AGI
(% of AGI for various income ranges: 0.9% for AGIs below $10k, 1.1% for AGIs $10k-25k, 1.2% for AGIs $25k-50k, 1.7% for AGIs $50k-75k, 1.9% for AGIs $75k-100k, 2.9% for AGIs over 100k)
Total tax: $9,852 (reported on 78.7% of returns)
53545:
$9,852
State:
$7,114
(% of AGI for various income ranges: 3.6% for AGIs below $10k, 4.1% for AGIs $10k-25k, 7.2% for AGIs $25k-50k, 8.8% for AGIs $50k-75k, 9.9% for AGIs $75k-100k, 22.6% for AGIs over 100k)
Earned income credit: $1,474 (reported on 10.9% of returns)
Here:
$1,474
State:
$1,544
Percentage of individuals using paid preparers for their 2004 taxes: 59.1%
Here:
59%
State:
57%
(% for various income ranges: 50.4% for AGIs below $10k, 59.3% for AGIs $10k-25k, 59.1% for AGIs $25k-50k, 62.0% for AGIs $50k-75k, 59.9% for AGIs $75k-100k, 71.7% for AGIs over 100k)
Likely homosexual households (counted as self-reported same-sex unmarried-partner households)
Lesbian couples: 0.1% of all households
Gay men: 0.2% of all households
Household received Food Stamps/SNAP in the past 12 months: 1,403 Household did not receive Food Stamps/SNAP in the past 12 months: 9,674
Women who had a birth in the past 12 months: 290 (214 now married, 76 unmarried) Women who did not have a birth in the past 12 months: 5,035 (1,978 now married, 3,056 unmarried)
Housing units in zip code 53545 with a mortgage: 4,179 (564 second mortgage, 54 home equity loan, 466 both second mortgage and home equity loan) Houses without a mortgage: 301
Median monthly owner costs for units with a mortgage: $1,296 Median monthly owner costs for units without a mortgage: $586
Residents with income below the poverty level in 2022:
This zip code:
9.6%
Whole state:
10.7%
Residents with income below 50% of the poverty level in 2022:
This zip code:
4.8%
Whole state:
5.7%
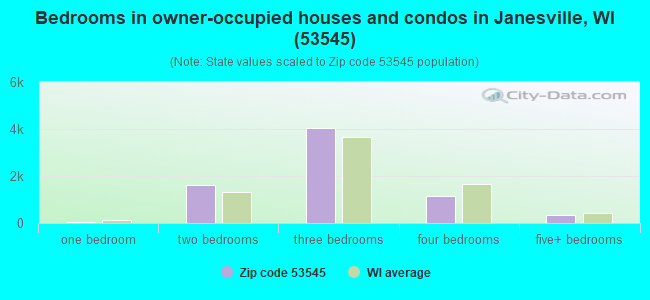
Median number of rooms in houses and condos:
Here:
6.3
State:
6.5
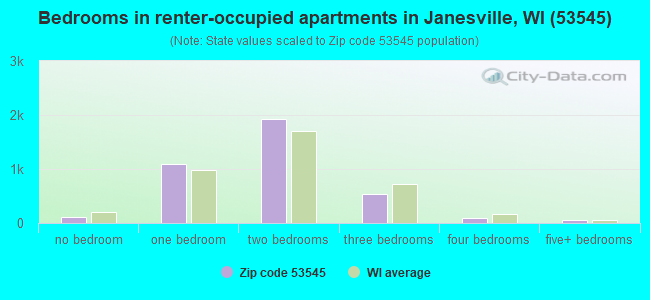
Median number of rooms in apartments:
Here:
4.1
State:
4.1
Notable locations in this zip code not listed on our city pages
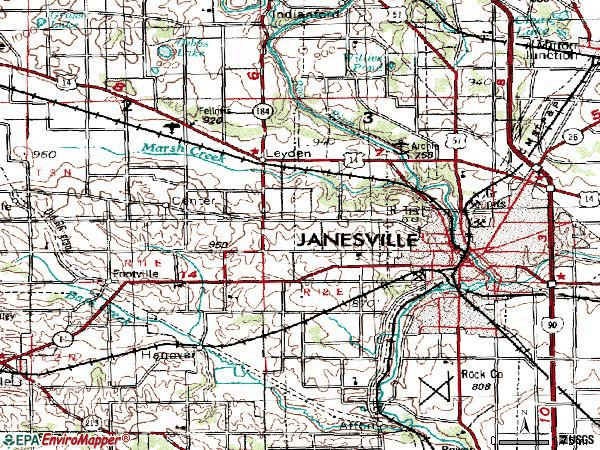
Notable locations in zip code 53545: Camp Indian Trails (A), Rotary Gardens (B), Blackhawk Golf Course (C), Saint Elibaths Rest Home (D), The Glory of God Trinity Parish Hall (E), Rock County Jail (F), Rock County Courthouse (G), Janesville Public Library (H), Janesville Fire Department Station 1 (I), Paratech Ambulance Service Janesville (J), Janesville Fire Department Station 5 (K). Display/hide their locations on the map
Churches in zip code 53545 include: Wesleyan Methodist Church (A), Trinity Episcopal Church (B), Saint Pauls Evangelical Lutheran Church (C), Saint Matthews Evangelical Lutheran Church (D), Saint Marys Roman Catholic Church (E), Saint Marks Lutheran Church (F), Saint Johns Evangelical Lutheran Church (G), Saint John Vianney Roman Catholic Church (H), Saint John Vianney Convent (I). Display/hide their locations on the map
Parks in zip code 53545 include: Blackhawk Park (1), Jefferson Park (2), Jeffris Park (3), Lions Park (4), Palmer Park (5), Sportsman Park (6), Traxler Park (7), Adams Park (8), Ardon Park (9). Display/hide their locations on the map
In group quarters: 510 (-1 institutionalized population)
Size of family households: 3,478 2-persons, 1,256 3-persons, 1,062 4-persons, 443 5-persons, 103 6-persons, 28 7-or-more-persons
Size of nonfamily households: 3,787 1-person, 835 2-persons, 88 3-persons
2,858 married couples with children.
1,589 single-parent households (323 men, 1,266 women).
95.6% of residents of 53545 zip code speak English at home.
2.4% of residents speak Spanish at home (61% very well, 13% well, 17% not well, 10% not at all).
1.4% of residents speak other Indo-European language at home (70% very well, 23% well, 5% not well, 2% not at all).
0.5% of residents speak Asian or Pacific Island language at home (56% very well, 18% well, 26% not well).
0.1% of residents speak other language at home (100% very well).
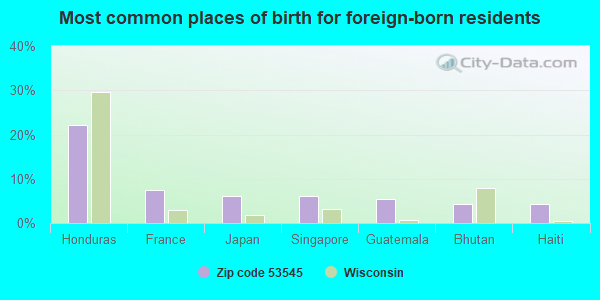
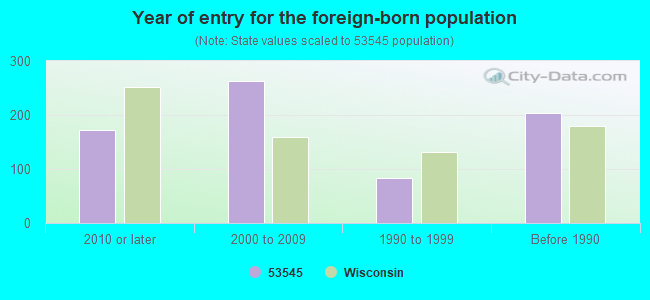
Foreign born population: 567 (2.4%) (48.9% of them are naturalized citizens)
Major facilities with environmental interests located in this zip code:
CITY OF JANESVILLE DIVISION OF PUBLIC WORKS (BLACKBRIDGE RD in JANESVILLE, WI)
AIR MAJOR (AIRS/AFS) SUPERFUND NPL (Superfund database) (Integrated Compliance Information System) - ICIS-05-1991-0192, FORMAL ENFORCEMENT ACTION CRITERIA AND HAZARDOUS AIR POLLUTANT INVENTORY (Inventory of air pollution sources) TSD (Resource Conservation and Recovery Act (tracking hazardous waste)) STATE MASTER (Wisconsin database) - RCRAINFO-WID000712950, TSD Business SIC classification: REFUSE SYSTEMS; AIR AND WATER RESOURCE AND SOLID WASTE MANAGEMENT; REGULATION AND ADMINISTRATION OF COMMUNICATIONS, ELECTRIC, GAS, AND OTHER UTILITIES; NONCLASSIFIABLE ESTABLISHMENTS Business NAICS classification: SOLID WASTE LANDFILL. Organizations: JANESVILLE CTY ASH BEDS Alternative names: JANESVILLE ASH BEDS, JANESVILLE CITY OF FILTRATION BEDS, JANESVILLE CITY/ROCK COUNTY LANDFILL, JANESVILLE DISPOSAL FACILITIES, JANESVILLE OLD LANDFILL, ROCK CNTY/CTY OF JANESVILLE
BJOIN LIMESTONE INCORPORATED (7308 WEST STATE RD 11 in JANESVILLE, WI)
AIR SYNTHETIC MINOR (AIRS/AFS) CRITERIA AND HAZARDOUS AIR POLLUTANT INVENTORY (Inventory of air pollution sources) STATE MASTER (Wisconsin database) - NEI-WI998304450, AIR PROGRAM STATE MASTER (Wisconsin database) - NEI-WI998251320, AIR PROGRAM Business SIC classification: CRUSHED AND BROKEN LIMESTONE; CRUSHED AND BROKEN STONE Business NAICS classification: CRUSHED AND BROKEN LIMESTONE MINING AND QUARRYING.; CRUSHED AND BROKEN LIMESTONE MINING AND QUARRYING.; CRUSHED AND BROKEN LIMESTONE MINING AND QUARRYING. Alternative names: BJOIN LIMESTONE INC. - CRUSHER #707, BJOIN LIMESTONE - CRUSHER #10-6920-738
AMERICAN FARM IMPLEMENT& SPECIALTY INC (122 S RIVER ST in JANESVILLE, WI)
Small Quantity Generators, between 100 kg and 1000 kg of hazardous waste/month (Resource Conservation and Recovery Act (tracking hazardous waste)) TRI REPORTER (Tracking of toxic chemicals releasing facilities) STATE MASTER (Wisconsin database) - TRIS-53545MRCNF122SR, TRI REPORTER, RCRAINFO-WID099131591, SQG Business SIC classification: FABRICATED METAL PRODUCTS; FARM MACHINERY AND EQUIPMENT Business NAICS classification: ALL OTHER MISCELLANEOUS FABRICATED METAL PRODUCT MANUFACTURING. Alternative names: AMERICAN FARM IMPLEMENT SPECIALTY CO., AMERICAN FARM IMPLEMENT SPTY INC
AMERITECH V0306 (301 E MILWAUKEE AVE in JANESVILLE, WI)
Conditionally Exempt Small Quantity Generators, less than 100 kg/month of hazardous waste (Resource Conservation and Recovery Act (tracking hazardous waste)) - notification STATE MASTER (Wisconsin database) - RCRAINFO-WIT560019911, CESQG Business SIC classification: TELEPHONE COMMUNICATIONS, EXCEPT RADIOTELEPHONE Organizations: WISCONSIN BELL INC (CONTACT/OWNER)
BLACKHAWK DRY CLEANERS (1944 CENTER AVE in JANESVILLE, WI)
Small Quantity Generators, between 100 kg and 1000 kg of hazardous waste/month (Resource Conservation and Recovery Act (tracking hazardous waste)) - notification STATE MASTER (Wisconsin database) - RCRAINFO-WID981782386, CESQG Organizations: HOWARD ROBERT (CONTACT/OWNER)
BLACKHAWK TECHNICAL COLLEGE (4720 HWY 51 S in JANESVILLE, WI)
Small Quantity Generators, between 100 kg and 1000 kg of hazardous waste/month (Resource Conservation and Recovery Act (tracking hazardous waste)) - notification STATE MASTER (Wisconsin database) - RCRAINFO-WID982611501, CESQG Business SIC classification: VOCATIONAL SCHOOLS Organizations: BLACKHAWK VTAE DISTRICT (CONTACT/OWNER)
CHARLES A QUINN BUSINESS MACHINES (33 E RACINE ST in JANESVILLE, WI)
Small Quantity Generators, between 100 kg and 1000 kg of hazardous waste/month (Resource Conservation and Recovery Act (tracking hazardous waste)) - notification STATE MASTER (Wisconsin database) - RCRAINFO-WID065059487, CESQG Organizations: QUINN CHARLES A (CONTACT/OWNER)
Alternative names: QUINN BUS MACHINES CHARLES A
CITY CAB AUTO REPAIR (14 N LOCUST ST in JANESVILLE, WI)
Conditionally Exempt Small Quantity Generators, less than 100 kg/month of hazardous waste (Resource Conservation and Recovery Act (tracking hazardous waste)) - notification STATE MASTER (Wisconsin database) - RCRAINFO-WID981094378, CESQG Business SIC classification: TOP, BODY, AND UPHOLSTERY REPAIR SHOPS AND PAINT SHOPS Organizations: CITY CAB CARSTAR INC
ALLIANT ENERGY WP&L (123 S RIVER ST in JANESVILLE, WI)
Conditionally Exempt Small Quantity Generators, less than 100 kg/month of hazardous waste (Resource Conservation and Recovery Act (tracking hazardous waste)) - notification STATE MASTER (Wisconsin database) - RCRAINFO-WID988589420, CESQG Organizations: WI POWER& LIGHT CO, WISCONSIN POWER AND LIGHT CO (CONTACT/OWNER)
Alternative names: WI POWER AND LIGHT SERVICE BLDG
ANDYS AUTO REPAIR (1515 E RACINE ST in JANESVILLE, WI)
Small Quantity Generators, between 100 kg and 1000 kg of hazardous waste/month (Resource Conservation and Recovery Act (tracking hazardous waste)) - notification STATE MASTER (Wisconsin database) - RCRAINFO-WIR000041004, HAZARDOUS WASTE PROGRAM Organizations: BOHN ANDREW (CONTACT/OWNER)
BODY SHOP COOP JANESVILLE INC (815 COURT ST in JANESVILLE, WI)
Conditionally Exempt Small Quantity Generators, less than 100 kg/month of hazardous waste (Resource Conservation and Recovery Act (tracking hazardous waste)) - notification STATE MASTER (Wisconsin database) - RCRAINFO-WIR000034793, CESQG Organizations: RASMUSSEN RICHARD (CONTACT/OWNER)
Alternative names: BODY SHOP CO OF JANESVILLE INC
CAR CITY (1732 CENTER AVE in JANESVILLE, WI)
Conditionally Exempt Small Quantity Generators, less than 100 kg/month of hazardous waste (Resource Conservation and Recovery Act (tracking hazardous waste)) - notification STATE MASTER (Wisconsin database) - RCRAINFO-WI0000917971, CESQG Organizations: GUSTAFSON BILL (CONTACT/OWNER)
CARDINAL FREIGHT (210 S ARCH ST in JANESVILLE, WI)
Conditionally Exempt Small Quantity Generators, less than 100 kg/month of hazardous waste (Resource Conservation and Recovery Act (tracking hazardous waste)) - notification STATE MASTER (Wisconsin database) - RCRAINFO-WIR000005587, CESQG Organizations: FREEDOM PLASTICS (CONTACT/OWNER)
Housing units lacking complete plumbing facilities: 0.1% Housing units lacking complete kitchen facilities: 0.7%
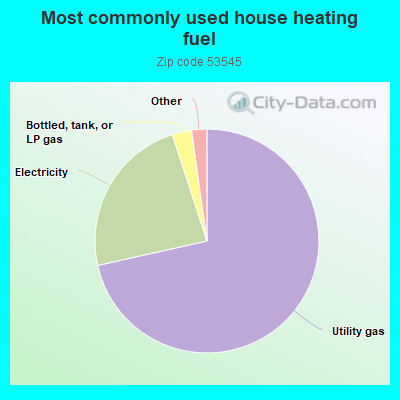
71.5%Utility gas
23.5%Electricity
2.8%Bottled, tank, or LP gas
0.7%Fuel oil, kerosene, etc.
0.7%Other fuel
0.6%Wood
Population in 1990: 40,339. Population change in the 1990s: +1,618 (+4.0%).
Place of birth for U.S.-born residents:
This state: 17,419
Northeast: 378
Midwest: 3,848
South: 1,045
West: 646
55% of the 53545 zip code residents lived in the same house 5 years ago. Out of people who lived in different houses, 70% lived in this county. Out of people who lived in different counties, 50% lived in Wisconsin.
90% of the 53545 zip code residents lived in the same house 1 year ago. Out of people who lived in different houses, 63% moved from this county. Out of people who lived in different houses, 14% moved from different county within same state. Out of people who lived in different houses, 19% moved from different state. Out of people who lived in different houses, 1% moved from abroad.
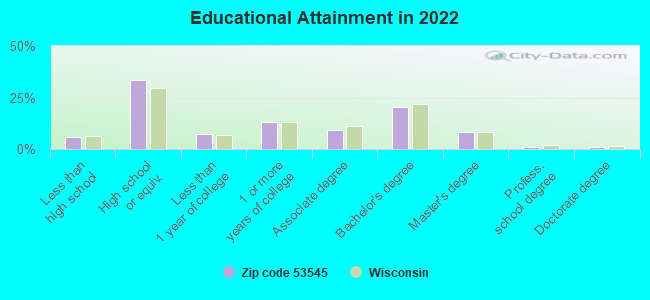
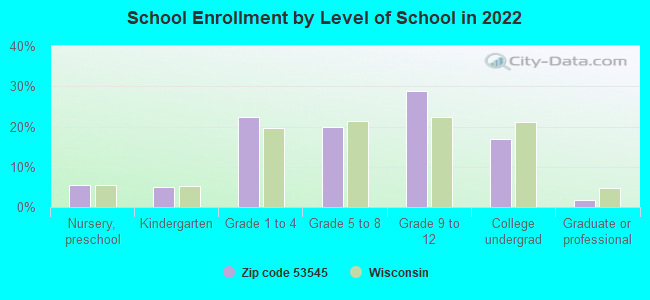
Private vs. public school enrollment:
Students in private schools in grades 1 to 8 (elementary and middle school): 153
Here:
7.6%
Wisconsin:
16.7%
Students in private schools in grades 9 to 12 (high school): 80
Here:
5.9%
Wisconsin:
12.5%
Students in private undergraduate colleges: 118
Here:
14.7%
Wisconsin:
17.5%
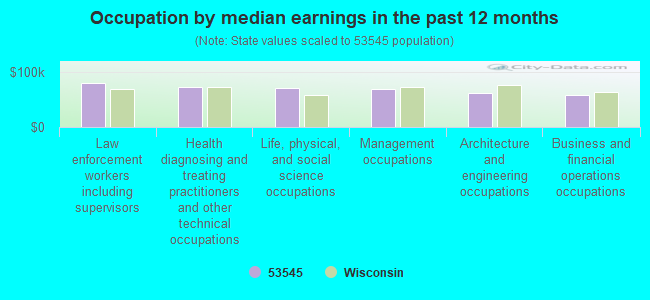
Occupation by median earnings in the past 12 months ($)
80,443Law enforcement workers including supervisors
73,835Health diagnosing and treating practitioners and other technical occupations
70,567Life, physical, and social science occupations
70,003Management occupations
61,902Architecture and engineering occupations
58,178Business and financial operations occupations
Companies with federal contracts located in this zip code (JANESVILLE, WI):
PRECISION FUZE COMPANY, LLC (2643 WEST COURT STREET) : $66,856,007 in 38 contractsfrom 2000 to 2006
Contracts for Miscellaneous Weapons, Fuzes and Primers, Weapons -- Applied Research and Exploratory Development (R&D), Ammunition, 75 mm through 125 mm, and moreby Air Force, Navy, Army Signed by year:2000: $317,536; 2001: $78,495; 2002: $2,433,156; 2003: $44,967,484; 2004: $18,722,796; 2005: $136,540; 2006: $200,000.
Biggest contracts:
$16,699,655 with Air Force for Miscellaneous Weapons. Signed on 2003-10-14. Completion date: 2005-09-30.
$16,110,471, same as above.Signed on 2003-02-28. Completion date: 2004-10-31.
$9,999,886, same as above.Signed on 2003-12-16. Completion date: 2005-09-30.
$9,999,270 with Navy for Fuzes and Primers. Signed on 2004-09-23. Completion date: 2007-10-31.
LAKE SHORE DREAMWORKS (2407 BLACKBRIDGE ROAD; small business)
$34,200 with Air Force for Other Professional Services. Signed on 2000-08-03. Completion date: 2001-03-15.
JOHANN A KRAUSE INC (305 W DELAVAN DRIVE) : $15,000 in 2 contractsin 2005
$10,800 with Air Force for Maintenance, Repair and Rebuilding of Equipment -- Miscellaneous. Signed on 2005-06-27. Completion date: 2005-07-14.
$4,200 with U.S. Coast Guard for Maintenance, Repair and Rebuilding of Equipment -- Maintenance and Repair Shop Equipment. Taking place in MD. Signed on 2005-05-09. Completion date: 2005-05-11.
WESTPHAL & CO , INC (123 ST MARY S CT; small business) : $13,539 in 2 contractsfrom 2000 to 2004
$10,789 with Navy for Maintenance, Repair or Alteration of Real Property -- Other Administrative Facilities and Service Buildings. Taking place in IA. Signed on 2000-03-28. Completion date: 2000-04-27.
$2,750 with Army for Indoor and Outdoor Electric Lighting Fixtures. Signed on 2004-08-30. Completion date: 2004-09-17.
JANESVILLE ATHLETIC CLUB INC (1301 BLACK BRIDGE RD; small business)
$3,024 with Army for Tuition, Registration, and Membership Fees. Signed on 2006-01-30. Completion date: 2006-12-14.
Top industries in this zip code by the number of employees in 2005:
Health Care and Social Assistance: General Medical and Surgical Hospitals (over 1000 employees: 1 establishment)
2002 - 2018 National Fire Incident Reporting System (NFIRS) incidents
Based on the data from the years 2002 - 2018 the average number of fire incidents per year is 92. The highest number of fires - 235 took place in 2002, and the least - 2 in 2008. The data has a declining trend.
When looking into fire subcategories, the most reports belonged to: Structure Fires (35.2%), and Outside Fires (33.3%).
Fire incident types reported to NFIRS in Zip Code 53545


 Nearest zip codes: 53548, 53546, 53534, 53501, 53563, 53537.
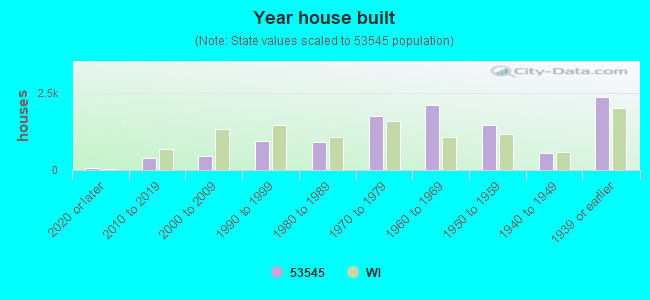


 Based on the data from the years 2002 - 2018 the average number of fire incidents per year is 92. The highest number of fires - 235 took place in 2002, and the least - 2 in 2008. The data has a declining trend.
 When looking into fire subcategories, the most reports belonged to: Structure Fires (35.2%), and Outside Fires (33.3%).