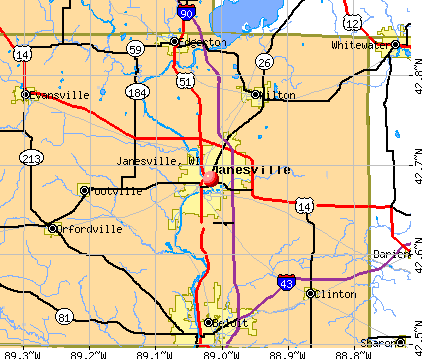
Janesville, Wisconsin
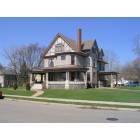
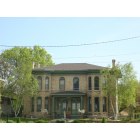
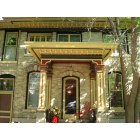
Janesville: Levi B. Carle house ca.1885
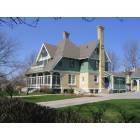
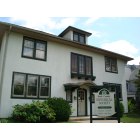
Janesville: Clarence Jackman house ca.1885
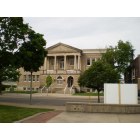
Janesville: Janesville Courthouse
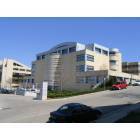
Janesville: Janesville: Random Home q
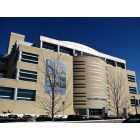
Janesville: Courthouse
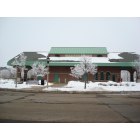
Janesville: Janesville: Bus Depot (downtown)
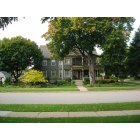
Janesville: Janesville: Random Home r
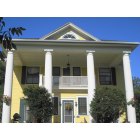
Janesville: Janesville: Random Home s, originally built as a duplex it has been converted into a beautiful and large single family home - has very high ceilings and lots of character
Janesville: Janesville: Random Home t
Janesville: Janesville: Rock County Historical Society offices and museum
Janesville: Janesville: Senior Center (downtown)
- see
67
more - add
your
Submit your own pictures of this city and show them to the world
- OSM Map
- General Map
- Google Map
- MSN Map
Population change since 2000: +10.8%
 |
| Males: 34,587 | |
| Females: 31,324 |
| Median resident age: | 39.7 years |
| Wisconsin median age: | 40.4 years |
Zip codes: 53545, 53546, 53563.
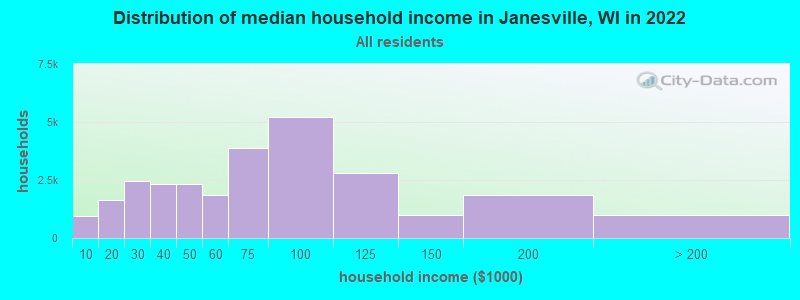
Janesville Zip Code Map| Janesville: | $66,497 |
| WI: | $70,996 |
Estimated per capita income in 2022: $33,609 (it was $22,224 in 2000)
Janesville city income, earnings, and wages data
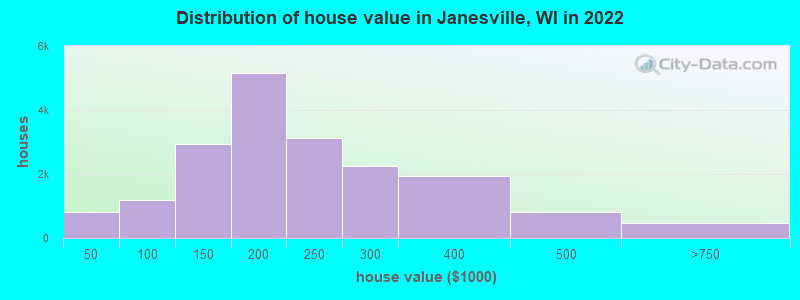
Estimated median house or condo value in 2022: $198,600 (it was $98,900 in 2000)
| Janesville: | $198,600 |
| WI: | $252,800 |
Mean prices in 2022: all housing units: $222,088; detached houses: $230,673; townhouses or other attached units: $204,661; in 2-unit structures: $342,210; in 3-to-4-unit structures: $338,251; in 5-or-more-unit structures: $131,027; mobile homes: $29,879
Median gross rent in 2022: $999.
(10.3% for White Non-Hispanic residents, 28.3% for Black residents, 8.3% for Hispanic or Latino residents, 20.3% for American Indian residents, 3.8% for other race residents, 9.2% for two or more races residents)
Detailed information about poverty and poor residents in Janesville, WI


- 56,03985.2%White alone
- 3,7045.6%Hispanic
- 2,7454.2%Two or more races
- 1,8832.9%Black alone
- 1,0931.7%Asian alone
- 1350.2%Other race alone
- 340.05%American Indian alone
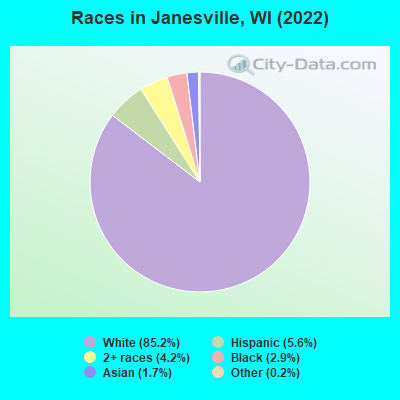
Races in Janesville detailed stats: ancestries, foreign born residents, place of birth
According to our research of Wisconsin and other state lists, there were 287 registered sex offenders living in Janesville, Wisconsin as of April 26, 2024.
The ratio of all residents to sex offenders in Janesville is 223 to 1.
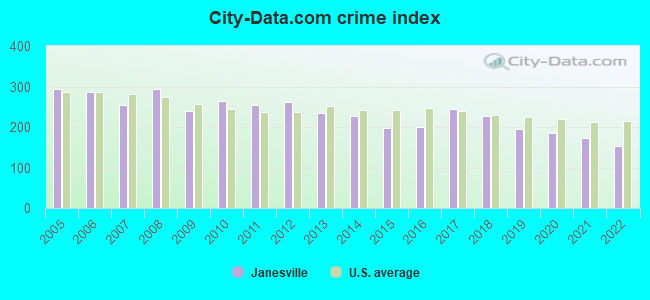
The City-Data.com crime index weighs serious crimes and violent crimes more heavily. Higher means more crime, U.S. average is 246.1. It adjusts for the number of visitors and daily workers commuting into cities.
- means the value is smaller than the state average.- means the value is about the same as the state average.
- means the value is bigger than the state average.
- means the value is much bigger than the state average.
Crime rate in Janesville detailed stats: murders, rapes, robberies, assaults, burglaries, thefts, arson
Full-time law enforcement employees in 2021, including police officers: 112 (100 officers - 91 male; 9 female).
| Officers per 1,000 residents here: | 1.54 |
| Wisconsin average: | 2.07 |
 Recent articles from our blog. Our writers, many of them Ph.D. graduates or candidates, create easy-to-read articles on a wide variety of topics.

 | Green Bay or Janesville (53 replies) |
| Looking to buy in Janesville (1 reply) |
| Family looking to relocate from NC to WI (Janesville area).. (18 replies) |
| Job transfer to Janesville/Milton area-where to live? (8 replies) |
| Janesville Info (3 replies) |
| Janesville, how will community receive my Chinese wife and mixed race son? (17 replies) |
Latest news from Janesville, WI collected exclusively by city-data.com from local newspapers, TV, and radio stations
Ancestries: German (29.2%), Norwegian (9.1%), American (8.9%), Irish (8.7%), English (4.4%), Italian (2.2%).
Current Local Time: CST time zone
Incorporated in 1853
Elevation: 858 feet
Land area: 27.5 square miles.
Population density: 2,394 people per square mile (low).
2,284 residents are foreign born (1.6% Latin America, 1.1% Asia, 0.6% Europe).
| This city: | 3.5% |
| Wisconsin: | 5.0% |
Median real estate property taxes paid for housing units with mortgages in 2022: $3,246 (1.7%)
Median real estate property taxes paid for housing units with no mortgage in 2022: $3,697 (1.8%)
Nearest city with pop. 200,000+: Madison, WI  (33.1 miles , pop. 208,054).
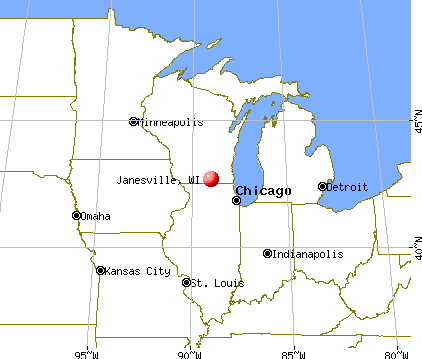
Nearest city with pop. 1,000,000+: Chicago, IL (89.9 miles , pop. 2,896,016).
Nearest cities:
), ), ), ), ), )Latitude: 42.68 N, Longitude: 89.02 W
Daytime population change due to commuting: +2,436 (+3.7%)
Workers who live and work in this city: 20,606 (58.7%)
Area code: 608

Janesville, Wisconsin accommodation & food services, waste management - Economy and Business Data
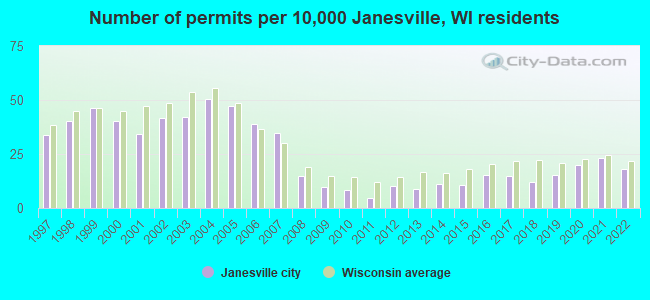
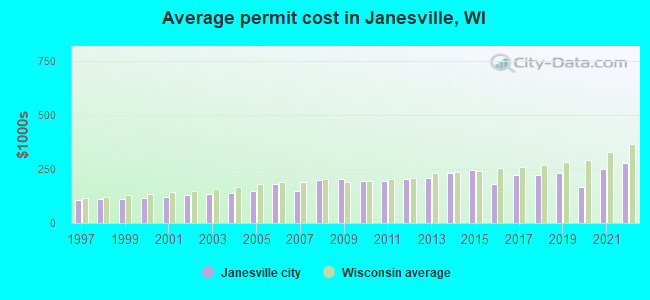
Single-family new house construction building permits:
- 2022: 107 buildings, average cost: $280,300
- 2021: 138 buildings, average cost: $249,700
- 2020: 119 buildings, average cost: $166,700
- 2019: 92 buildings, average cost: $233,600
- 2018: 72 buildings, average cost: $223,600
- 2017: 87 buildings, average cost: $222,400
- 2016: 91 buildings, average cost: $183,300
- 2015: 63 buildings, average cost: $243,500
- 2014: 65 buildings, average cost: $229,700
- 2013: 53 buildings, average cost: $210,400
- 2012: 60 buildings, average cost: $204,900
- 2011: 27 buildings, average cost: $197,200
- 2010: 49 buildings, average cost: $196,300
- 2009: 59 buildings, average cost: $204,800
- 2008: 87 buildings, average cost: $200,500
- 2007: 206 buildings, average cost: $149,800
- 2006: 232 buildings, average cost: $182,000
- 2005: 280 buildings, average cost: $146,900
- 2004: 300 buildings, average cost: $141,000
- 2003: 252 buildings, average cost: $135,900
- 2002: 248 buildings, average cost: $128,400
- 2001: 203 buildings, average cost: $120,500
- 2000: 240 buildings, average cost: $117,400
- 1999: 276 buildings, average cost: $109,800
- 1998: 240 buildings, average cost: $110,400
- 1997: 202 buildings, average cost: $107,100
| Here: | 2.9% |
| Wisconsin: | 2.7% |

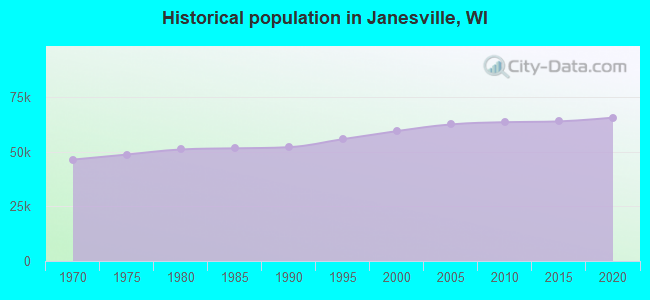
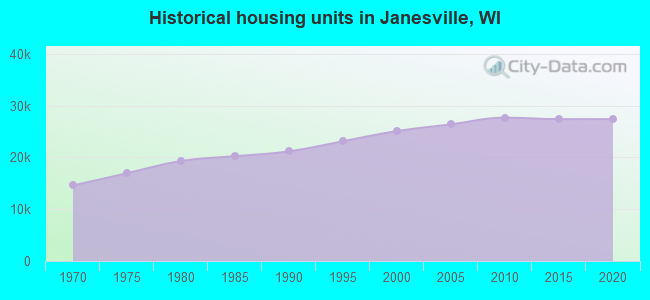
Population change in the 1990s: +6,633 (+12.5%).
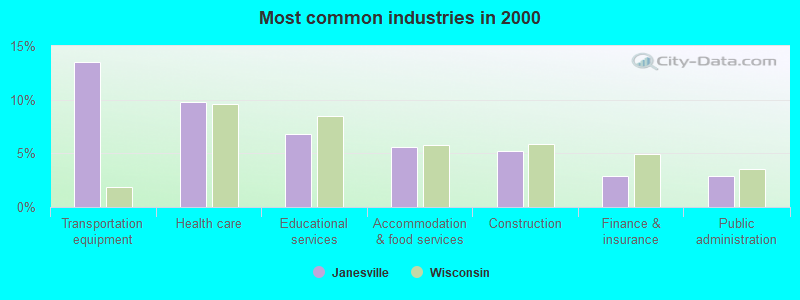
- Transportation equipment (13.5%)
- Health care (9.8%)
- Educational services (6.8%)
- Accommodation & food services (5.6%)
- Construction (5.2%)
- Finance & insurance (2.9%)
- Public administration (2.9%)
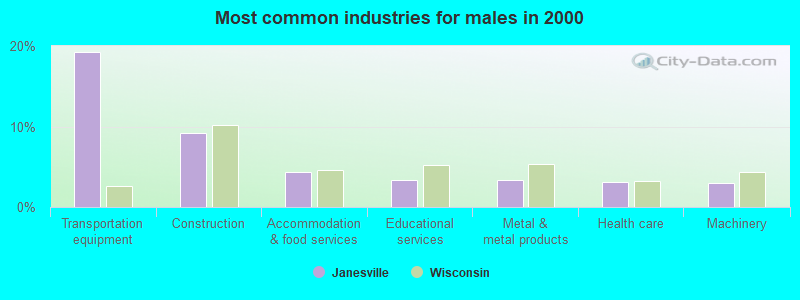
- Transportation equipment (19.2%)
- Construction (9.2%)
- Accommodation & food services (4.4%)
- Educational services (3.4%)
- Metal & metal products (3.3%)
- Health care (3.2%)
- Machinery (3.0%)
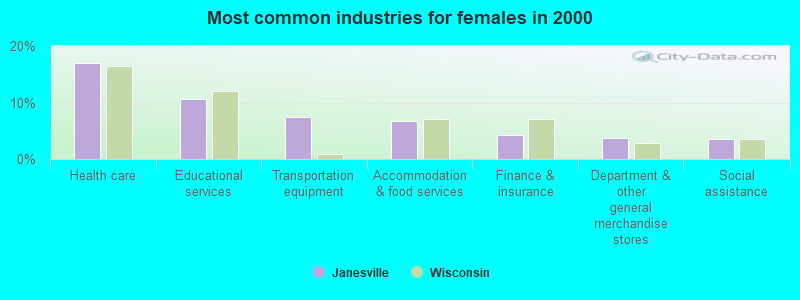
- Health care (16.9%)
- Educational services (10.6%)
- Transportation equipment (7.4%)
- Accommodation & food services (6.8%)
- Finance & insurance (4.3%)
- Department & other general merchandise stores (3.7%)
- Social assistance (3.6%)
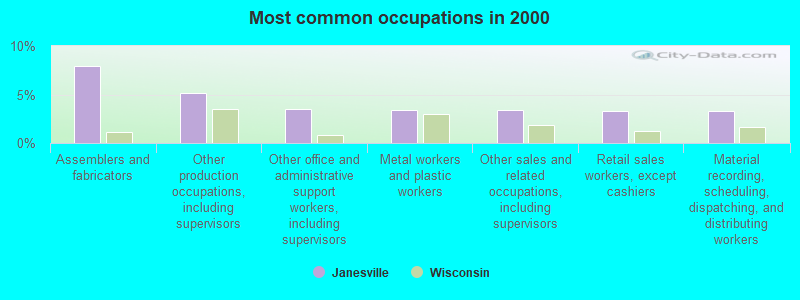
- Assemblers and fabricators (7.9%)
- Other production occupations, including supervisors (5.2%)
- Other office and administrative support workers, including supervisors (3.5%)
- Metal workers and plastic workers (3.5%)
- Other sales and related occupations, including supervisors (3.4%)
- Retail sales workers, except cashiers (3.3%)
- Material recording, scheduling, dispatching, and distributing workers (3.3%)
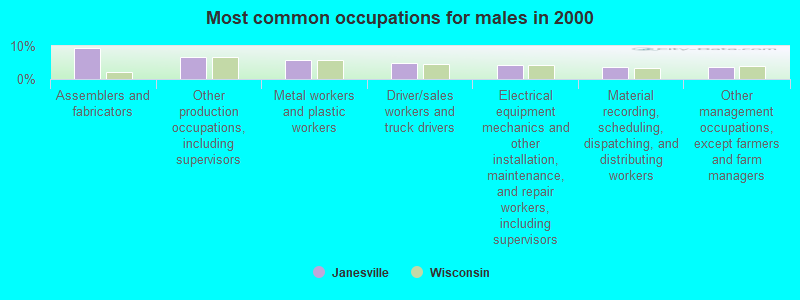
- Assemblers and fabricators (9.3%)
- Other production occupations, including supervisors (6.6%)
- Metal workers and plastic workers (5.6%)
- Driver/sales workers and truck drivers (4.9%)
- Electrical equipment mechanics and other installation, maintenance, and repair workers, including supervisors (4.4%)
- Material recording, scheduling, dispatching, and distributing workers (3.7%)
- Other management occupations, except farmers and farm managers (3.6%)
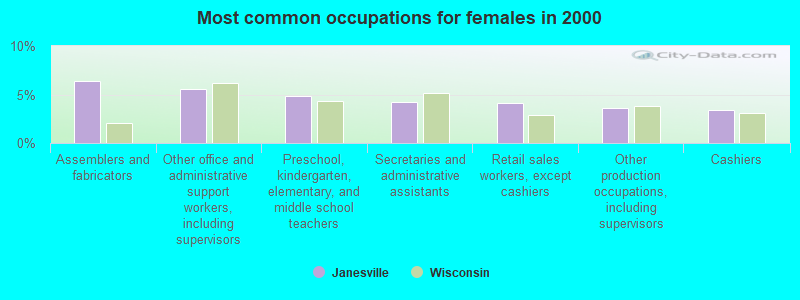
- Assemblers and fabricators (6.4%)
- Other office and administrative support workers, including supervisors (5.6%)
- Preschool, kindergarten, elementary, and middle school teachers (4.9%)
- Secretaries and administrative assistants (4.2%)
- Retail sales workers, except cashiers (4.1%)
- Other production occupations, including supervisors (3.6%)
- Cashiers (3.4%)
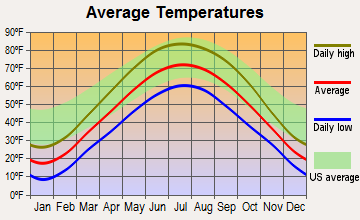
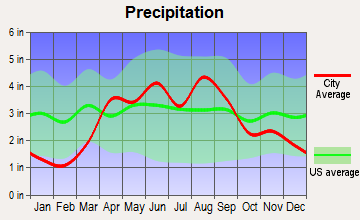
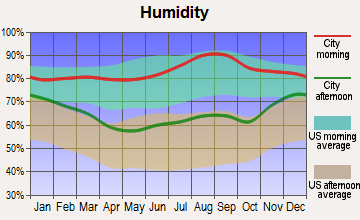
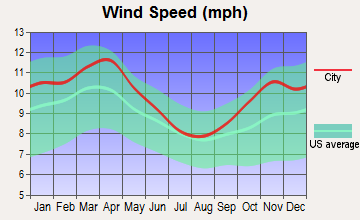
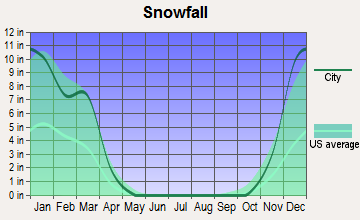
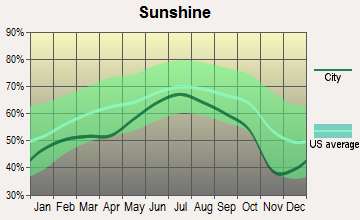
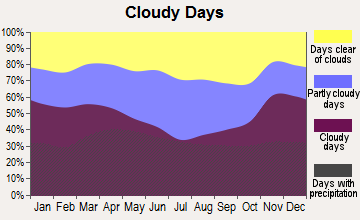
Average climate in Janesville, Wisconsin
Based on data reported by over 4,000 weather stations
|
|

(lower is better)
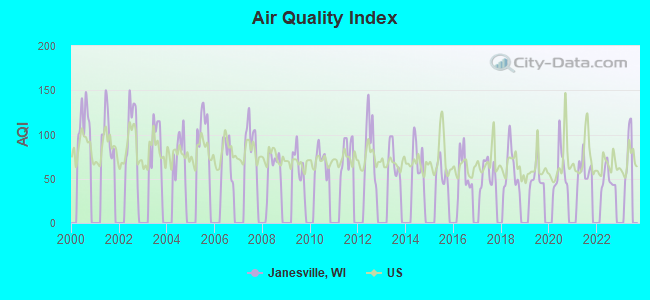
Air Quality Index (AQI) level in 2022 was 50.0. This is significantly better than average.
| City: | 50.0 |
| U.S.: | 72.6 |
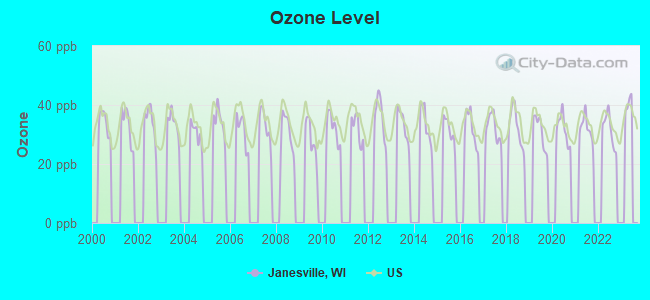
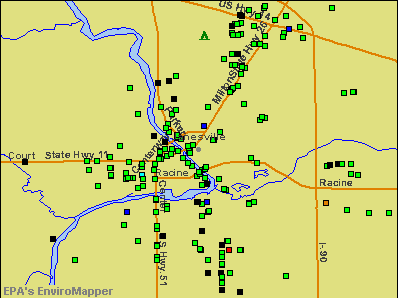
Ozone [ppb] level in 2022 was 31.7. This is about average. Closest monitor was 6.7 miles away from the city center.
| City: | 31.7 |
| U.S.: | 33.3 |
Tornado activity:
Janesville-area historical tornado activity is slightly above Wisconsin state average. It is 59% greater than the overall U.S. average.
On 1/24/1967, a category F3 (max. wind speeds 158-206 mph) tornado 6.7 miles away from the Janesville city center caused between $50,000 and $500,000 in damages.
On 4/21/1967, a category F4 (max. wind speeds 207-260 mph) tornado 32.5 miles away from the city center killed 24 people and injured 450 people and caused between $50,000 and $500,000 in damages.
Earthquake activity:
Janesville-area historical earthquake activity is significantly above Wisconsin state average. It is 41% greater than the overall U.S. average.On 4/18/2008 at 09:36:59, a magnitude 5.4 (5.1 MB, 4.8 MS, 5.4 MW, 5.2 MW, Class: Moderate, Intensity: VI - VII) earthquake occurred 298.7 miles away from Janesville center
On 6/28/2004 at 06:10:52, a magnitude 4.2 (4.2 MW, Depth: 6.2 mi, Class: Light, Intensity: IV - V) earthquake occurred 84.9 miles away from Janesville center
On 6/10/1987 at 23:48:54, a magnitude 5.1 (4.9 MB, 4.4 MS, 4.6 MS, 5.1 LG) earthquake occurred 273.7 miles away from Janesville center
On 4/18/2008 at 09:36:59, a magnitude 5.2 (5.2 MW, Depth: 8.9 mi) earthquake occurred 298.7 miles away from Janesville center
On 2/10/2010 at 09:59:35, a magnitude 3.8 (3.8 MW, Depth: 6.2 mi, Class: Light, Intensity: II - III) earthquake occurred 56.1 miles away from the city center
On 5/2/2015 at 16:23:07, a magnitude 4.2 (4.2 MW, Depth: 2.8 mi) earthquake occurred 185.7 miles away from Janesville center
Magnitude types: regional Lg-wave magnitude (LG), body-wave magnitude (MB), surface-wave magnitude (MS), moment magnitude (MW)
Natural disasters:
The number of natural disasters in Rock County (14) is near the US average (15).Major Disasters (Presidential) Declared: 10
Emergencies Declared: 4
Causes of natural disasters: Floods: 9, Storms: 9, Tornadoes: 4, Drought: 1, Hurricane: 1, Snow: 1, Wind: 1, Winter Storm: 1, Other: 1 (Note: some incidents may be assigned to more than one category).

Hospitals in Janesville:
- HOSPICE TEAM CARE INC (2100 E MILWAUKEE ST)
- MERCY HLTH SYS CORP (Voluntary non-profit - Private, 1000 MINERAL POINT AVE)
- ROCK HOSPICE CARE LIMITED (221 WEST COURT STREET)
- ST MARY'S JANESVILLE HOSPITAL (Voluntary non-profit - Other, provides emergency services, 3400 EAST RACINE STREET)
Nursing Homes in Janesville:
- CEDAR CREST HEALTH CENTER (1702 S RIVER RD)
- JANESVILLE HEALTH CARE CENTER (119 S PARKER DRIVE)
- MERCY MANOR TRANS CTR (1000 MINERAL POINT AVE PO BOX 5003)
- ROCK COUNTY HEALTH CTR (3512 NORTH PARKER DR)
- ROCK HAVEN (3418 N CTY TRK HWY F PO BOX 920)
- ST ELIZABETH NURSING HOME (109 S ATWOOD AVENUE)
Dialysis Facilities in Janesville:
Home Health Centers in Janesville:
Airports, heliports and other landing facilities located in Janesville:
- Southern Wisconsin Regional Airport (JVL) (Runways: 3, Commercial Ops: 25, Air Taxi Ops: 3,306, Itinerant Ops: 14,638, Local Ops: 20,182, Military Ops: 249)
- Hacklander Airport (76WN) (Runways: 1)
- Johnstown Center Airport (WI84) (Runways: 1)
- Mercy Hospital Heliport (WS40)
- Omniflight Helicopters Heliport (WI85)
- St Mary's Janesville Hospital Heliport (2WS4)
- Archie's Seaplane Base (WS01)
Colleges/Universities in Janesville:
Colleges/universities with over 2000 students nearest to Janesville:
- University of Wisconsin-Whitewater (about 18 miles; Whitewater, WI; Full-time enrollment: 11,124)
- Rock Valley College (about 26 miles; Rockford, IL; FT enrollment: 6,269)
- Edgewood College (about 34 miles; Madison, WI; FT enrollment: 2,455)
- University of Wisconsin Colleges (about 34 miles; Madison, WI; FT enrollment: 10,019)
- University of Wisconsin-Madison (about 34 miles; Madison, WI; FT enrollment: 34,621)
- Madison Area Technical College (about 35 miles; Madison, WI; FT enrollment: 9,603)
- Herzing University-Madison (about 35 miles; Madison, WI; FT enrollment: 3,160)
Public high schools in Janesville:
- CRAIG HIGH (Students: 1,636, Location: 401 S RANDALL AVE, Grades: 9-12)
- PARKER HIGH (Students: 1,437, Location: 3125 MINERAL POINT AVE, Grades: 9-12)
- ROCK RIVER CHARTER SCHOOL (Students: 154, Location: 31 W MILWAUKEE ST, Grades: 6-12, Charter school)
- TAGOS LEADERSHIP ACADEMY (Students: 63, Location: 1350 N PARKER DR, Grades: 7-12, Charter school)
- YOUTH SERVICES CENTER (Location: 210 E US HIGHWAY 14, Grades: 4-12)
- ROCK UNIVERSITY HIGH (Location: 2909 KELLOGG AVE, Grades: 10-12, Charter school)
- ARISE VIRTUAL ACADEMY (Location: 1831 MOUNT ZION AVE, Grades: KG-12, Charter school)
Private high school in Janesville:
Biggest public elementary/middle schools in Janesville:
- MARSHALL MIDDLE (Students: 906, Location: 25 S PONTIAC DR, Grades: 6-8)
- FRANKLIN MIDDLE (Students: 581, Location: 450 N CROSBY AVE, Grades: 6-8)
- ADAMS ELEMENTARY (Students: 436, Location: 1138 E MEMORIAL DR, Grades: PK-5)
- MONROE ELEMENTARY (Students: 385, Location: 55 S PONTIAC DR, Grades: PK-5)
- VAN BUREN ELEMENTARY (Students: 336, Location: 1515 LAPHAM ST, Grades: PK-5)
- HARRISON ELEMENTARY (Students: 301, Location: 760 PRINCETON RD, Grades: PK-5)
- HARMONY ELEMENTARY SCHOOL (Students: 261, Location: 4243 E ROTAMER RD, Grades: PK-3)
- CONSOLIDATED ELEMENTARY (Students: 92, Location: 4838 N COUNTY ROAD F, Grades: PK-3)
- LINCOLN ELEMENTARY (Location: 1821 CONDE ST, Grades: PK-5)
- MADISON ELEMENTARY (Location: 331 N GRANT AVE, Grades: PK-5)
Private elementary/middle schools in Janesville:
- ST PAULS LUTHERAN SCHOOL (Students: 260, Location: 210 S RINGOLD ST, Grades: PK-8)
- ST JOHN VIANNEY SCHOOL (Students: 251, Location: 1250 E RACINE ST, Grades: PK-8)
- ST WILLIAM CATHOLIC SCHOOL (Students: 152, Location: 1822 RAVINE ST, Grades: PK-8)
- ST MARY ELEMENTARY SCHOOL (Students: 132, Location: 307 E WALL ST, Grades: PK-8)
- ST MATTHEWS LUTHERAN SCHOOL (Students: 114, Location: 709 MILTON AVE, Grades: PK-8)
- ROCK PRAIRIE MONTESSORI (Students: 104, Location: 5246 E ROTAMER RD, Grades: PK-3)
- ST PATRICK ELEMENTARY SCHOOL (Students: 75, Location: 305 LINCOLN ST, Grades: PK-8)
User-submitted facts and corrections:
- Rock County Christian School (students: 203;Location:5122 Driftwood Dr; Grades: PK3-12)
- Please add the following info under Colleges/University in Janesville, Wisconsin: UNIVERSITY OF WISCONSIN-ROCK COUNTY (Enrollment: 900; Location: 2909 Kellogg Ave.; Public)
- Colleges: Janesville also has University of Wisc. Rock County Campus. 4 year , located in town. 2909 Kellogg Ave. www.rock.uwc.edu
- zip codes should include 53548
Points of interest:
Notable locations in Janesville: Rotary Gardens (A), Riverside Golf Course (B), Blackhawk Golf Course (C), Janesville Wastewater Treatment Plant (D), Saint Elibaths Rest Home (E), The Glory of God Trinity Parish Hall (F), Rock County Jail (G), Rock County Courthouse (H), Lincoln-Tallman Museum (I), Janesville Public Library (J), Janesville City Hall (K), Janesville Fire Department Station 4 (L), Janesville Fire Department Station 3 (M), Fire Station Number 2 (N), Janesville Fire Department Station 1 (O), Paratech Ambulance Service Janesville (P), Janesville Fire Department Station 2 (Q), Janesville Fire Department Station 5 (R), Williams Hall (S), Wells Cultural Center (T). Display/hide their locations on the map
Shopping Centers: Janesville Mall Shopping Center (1), Creston Park Shopping Center (2). Display/hide their locations on the map
Churches in Janesville include: Wesleyan Methodist Church (A), Trinity Episcopal Church (B), Saint Williams Catholic Church (C), Saint Peters Lutheran Church (D), Saint Pauls Evangelical Lutheran Church (E), Saint Patricks Catholic Church (F), Saint Matthews Evangelical Lutheran Church (G), Saint Marys Roman Catholic Church (H), Saint Marks Lutheran Church (I). Display/hide their locations on the map
Cemeteries: Oak Hill Cemetery (1), Milton Lawn Memorial Park (2), Mount Olivet Cemetery (3). Display/hide their locations on the map
Lakes and reservoirs: Kiwanis Pond (A), 3235 Reservoir (B). Display/hide their locations on the map
Streams, rivers, and creeks: Blackhawk Creek (A), Spring Brook (B), Markham Creek (C). Display/hide their locations on the map
Parks in Janesville include: Blackhawk Park (1), Falcon Park (2), Fourth Ward Park (3), Jefferson Park (4), Jeffris Park (5), LaPrairie Park (6), Lions Park (7), Lustig Park (8), Marquette Park (9). Display/hide their locations on the map
Beach: Lions Beach (A). Display/hide its location on the map
Tourist attractions: Daval's White Buffalo Inc (Cultural Attractions- Events- & Facilities; 2739 South River Road) (1), Rock County Historical Society (Historical Places & Services; 440 North Jackson Street) (2), Gardner Sales (Amusement & Theme Parks; 1415 Johnson Street) (3), B-M Music & Games (Amusement & Theme Parks; 611 North Grant Avenue) (4), Bushelle Aerial Photography LLC (4042 Saratoga Drive) (5), Namco Cyberstation (2500 Milton Avenue Frnt) (6). Display/hide their approximate locations on the map
Hotels: Janesville Super 8 Motel (3430 Milton Ave. /I-90 Exit 171a S. On Hwy 26) (1), Delavan Inn (120 West Delavan Drive) (2), Holiday Inn Express (3100 Wellington Place) (3), Baymont Inn Janesville (616 Midland Road) (4), Country Side Motel (West Hy 14) (5), Lannon Stone Motel (1524 East Racine Street) (6), Best Western Janesville (3900 Milton Avenue) (7), Hampton Inn Janesville (2400 Fulton Street) (8), Motel 6 (3907 Milton Avenue) (9). Display/hide their approximate locations on the map
Courts: Court St Wash (1806 West Court) (1), Rock County - Court System- Janesville Courts- Collection Clerk (51 South Main Street) (2), Rock County - Court System- Janesville Courts- Clerk Of Circuit Courts (51 South Main Street) (3), Rock County - Family Court Commissioner (51 South Main Street) (4), Rock County - Court System- Janesville Courts- Judicial Receptionist (51 South Main Street) (5). Display/hide their approximate locations on the map
Birthplace of: Paul Ryan - Politician, Clark Van Galder - Football and basketball player, James Budd - Governor of California, Jim Fitzgerald - Entrepreneur and businessman, Joe Riggert - Baseball player, Leslie Allen Bellrichard - Army Medal of Honor recipient, Michael J. Sheridan - Politician, Milton Robert Carr - Politician, Mistie Mims - Basketball player, Russell Feingold - politician.
Drinking water stations with addresses in Janesville and their reported violations in the past:
CARAVILLA EDUCATION & REHAB CENTER (Population served: 298, Groundwater):Past monitoring violations:WESTSIDE BAPTIST CHURCH (Population served: 201, Groundwater):
- Lead Consumer Notice - In JAN-01-2013, Contaminant: Lead and Copper Rule
- Follow-up Or Routine LCR Tap M/R - In JAN-01-2009, Contaminant: Lead and Copper Rule. Follow-up actions: St Public Notif requested (FEB-04-2010), St Violation/Reminder Notice (FEB-04-2010), St Compliance achieved (MAR-05-2010)
- 3 routine major monitoring violations
- One minor monitoring violation
Past health violations:WEDGES (Population served: 155, Groundwater):
- MCL, Monthly (TCR) - In SEP-2013, Contaminant: Coliform. Follow-up actions: St Public Notif requested (OCT-07-2013), St Boil Water Order (OCT-07-2013), St Violation/Reminder Notice (OCT-07-2013), St Public Notif received (OCT-16-2013), St Compliance achieved (OCT-28-2013)
Past health violations:SWEET ALLYN PARK (Population served: 100, Groundwater):
- MCL, Monthly (TCR) - In MAY-2014, Contaminant: Coliform. Follow-up actions: St Public Notif requested (MAY-20-2014), St Boil Water Order (MAY-20-2014), St Violation/Reminder Notice (MAY-20-2014), St Public Notif received (MAY-21-2014), St Compliance achieved (JUN-07-2014)
- MCL, Monthly (TCR) - In APR-2014, Contaminant: Coliform. Follow-up actions: St Public Notif requested (APR-23-2014), St Boil Water Order (APR-23-2014), St Violation/Reminder Notice (APR-23-2014), St Public Notif received (APR-25-2014), St Compliance achieved (MAY-02-2014)
- MCL, Monthly (TCR) - In SEP-2009, Contaminant: Coliform. Follow-up actions: St Public Notif received (OCT-06-2009), St Violation/Reminder Notice (OCT-06-2009), St Boil Water Order (OCT-06-2009), St Public Notif requested (OCT-06-2009), St Compliance achieved (OCT-12-2009)
- MCL, Monthly (TCR) - In AUG-2009, Contaminant: Coliform. Follow-up actions: St Violation/Reminder Notice (AUG-18-2009), St Boil Water Order (AUG-18-2009), St Public Notif requested (AUG-18-2009), St Compliance achieved (SEP-02-2009), St Public Notif received (SEP-10-2009)
- MCL, Monthly (TCR) - In JUN-2009, Contaminant: Coliform. Follow-up actions: St Violation/Reminder Notice (JUL-02-2009), St Boil Water Order (JUL-02-2009), St Public Notif requested (JUL-02-2009), St Compliance achieved (JUL-09-2009), St Public Notif received (JUL-10-2009)
Past health violations:MAGNOLIA BLUFF 2 BOTTOM (Population served: 75, Groundwater):
- MCL, Monthly (TCR) - In JUL-2013, Contaminant: Coliform. Follow-up actions: St Public Notif received (JUL-17-2013), St Violation/Reminder Notice (JUL-17-2013), St Public Notif requested (JUL-17-2013), St Public Notif received (JUL-26-2013), St Compliance achieved (AUG-12-2013)
- MCL, Average - Between JAN-01-2007 and FEB-25-2011, Contaminant: Nitrate. Follow-up actions: St Violation/Reminder Notice (MAY-25-2007), St Public Notif requested (MAY-25-2007), St Public Notif received (JUL-31-2007), St Public Notif requested (APR-03-2008), St Violation/Reminder Notice (APR-03-2008), St Public Notif requested (APR-27-2009), St Violation/Reminder Notice (APR-27-2009), St Public Notif requested (APR-15-2010), St Violation/Reminder Notice (APR-15-2010), St Compliance achieved (FEB-25-2011)
Past health violations:LEE PARK SOUTH - PICNIC (Population served: 75, Groundwater):
- MCL, Monthly (TCR) - In SEP-2010, Contaminant: Coliform. Follow-up actions: St Public Notif requested (SEP-23-2010), St Boil Water Order (SEP-23-2010), St Violation/Reminder Notice (SEP-23-2010), St Public Notif received (SEP-29-2010), St Compliance achieved (DEC-01-2010)
- MCL, Monthly (TCR) - In SEP-2005, Contaminant: Coliform. Follow-up actions: St Public Notif requested (SEP-20-2005), St Violation/Reminder Notice (SEP-20-2005), St Boil Water Order (SEP-20-2005), St Public Notif received (OCT-20-2005), St Compliance achieved (AUG-14-2006)
Past health violations:WASTE MANAGEMENT JANESVILLE (Population served: 67, Groundwater):
- MCL, Acute (TCR) - In JUL-2013, Contaminant: Coliform. Follow-up actions: St Public Notif received (JUL-17-2013), St Violation/Reminder Notice (JUL-17-2013), St Public Notif requested (JUL-17-2013), St Public Notif received (JUL-26-2013), St Compliance achieved (OCT-30-2013)
Past health violations:WILLOWDALE (Population served: 55, Groundwater):
- MCL, Average - Between JAN-01-2010 and OCT-07-2010, Contaminant: Nitrate. Follow-up actions: St Formal NOV issued (MAY-07-2010), St Public Notif requested (MAY-07-2010), St Public Notif received (MAY-21-2010), St Other (JUL-30-2010), St Compliance achieved (2 times from OCT-07-2010 to OCT-07-2010)
- MCL, Average - Between JAN-01-2009 and MAY-07-2010, Contaminant: Nitrate. Follow-up actions: St Public Notif requested (MAR-06-2009), St Violation/Reminder Notice (MAR-06-2009), St Public Notif received (2 times from MAR-16-2009 to MAY-04-2010), St Compliance achieved (MAY-07-2010)
Past health violations:
- MCL, Monthly (TCR) - In SEP-2008, Contaminant: Coliform. Follow-up actions: St Violation/Reminder Notice (OCT-09-2008), St Boil Water Order (OCT-09-2008), St Public Notif requested (OCT-09-2008), St Public Notif received (OCT-16-2008), St Compliance achieved (OCT-29-2008)
- MCL, Monthly (TCR) - In OCT-2006, Contaminant: Coliform. Follow-up actions: St Public Notif requested (OCT-19-2006), St Violation/Reminder Notice (OCT-19-2006), St Boil Water Order (OCT-19-2006), St Compliance achieved (DEC-01-2006), St Public Notif received (DEC-22-2006)
Drinking water stations with addresses in Janesville that have no violations reported:
- JANESVILLE WATER UTILITY (Population served: 62,720, Primary Water Source Type: Groundwater)
- LIONS QUICK MART (Population served: 412, Primary Water Source Type: Groundwater)
- ROCK PRAIRIE UNITED PRES CH (Population served: 206, Primary Water Source Type: Groundwater)
- SHOWBOAT TAP/EDGEWATER INN (Population served: 160, Primary Water Source Type: Groundwater)
- ROLLETTE OIL CO CITGO (Population served: 160, Primary Water Source Type: Groundwater)
- SPORTSMAN PARK 2 RESTROOM (Population served: 100, Primary Water Source Type: Groundwater)
- MAGNOLIA BLUFF 1 TOP (Population served: 75, Primary Water Source Type: Groundwater)
- ROCK COUNTY AGRICULTURAL AGENCIES (Population served: 73, Primary Water Source Type: Groundwater)
- TURTLE CREEK PARKWAY (Population served: 50, Primary Water Source Type: Groundwater)
- MURWIN CO PARK (Population served: 50, Primary Water Source Type: Groundwater)
| This city: | 2.4 people |
| Wisconsin: | 2.4 people |
| This city: | 64.7% |
| Whole state: | 64.4% |
| This city: | 8.9% |
| Whole state: | 7.3% |
Likely homosexual households (counted as self-reported same-sex unmarried-partner households)
- Lesbian couples: 0.3% of all households
- Gay men: 0.2% of all households
People in group quarters in Janesville in 2010:
- 420 people in local jails and other municipal confinement facilities
- 309 people in nursing facilities/skilled-nursing facilities
- 71 people in group homes intended for adults
- 42 people in other noninstitutional facilities
- 33 people in residential treatment centers for adults
- 25 people in emergency and transitional shelters (with sleeping facilities) for people experiencing homelessness
- 23 people in correctional facilities intended for juveniles
- 4 people in group homes for juveniles (non-correctional)
- 3 people in workers' group living quarters and job corps centers
People in group quarters in Janesville in 2000:
- 370 people in nursing homes
- 133 people in schools, hospitals, or wards for the intellectually disabled
- 122 people in other group homes
- 109 people in other noninstitutional group quarters
- 79 people in homes for the mentally retarded
- 52 people in homes or halfway houses for drug/alcohol abuse
- 38 people in other nonhousehold living situations
- 9 people in hospitals or wards for drug/alcohol abuse
- 6 people in homes for the physically handicapped
- 3 people in religious group quarters
Banks with most branches in Janesville (2011 data):
- Johnson Bank: Holiday Drive Branch 63000, Janesville Cedar Crest Branch, Janesville Main Office Branch 61000, Wright Road Branch 64000, Janesville Huntington Branch. Info updated 2006/07/05: Bank assets: $4,144.5 mil, Deposits: $3,567.4 mil, headquarters in Racine, WI, negative income in the last year, Commercial Lending Specialization, 55 total offices, Holding Company: Johnson Financial Group, Inc.
- BMO Harris Bank National Association: Creston Park Branch, Janesville, Janesville Southside, Milton Avenue Branch. Info updated 2011/07/14: Bank assets: $97,264.0 mil, Deposits: $75,624.6 mil, headquarters in Chicago, IL, positive income, 717 total offices, Holding Company: Bank Of Montreal
- JPMorgan Chase Bank, National Association: Westside Branch, Janesville Main Office Branch, Eastside Branch. Info updated 2011/11/10: Bank assets: $1,811,678.0 mil, Deposits: $1,190,738.0 mil, headquarters in Columbus, OH, positive income, International Specialization, 5577 total offices, Holding Company: Jpmorgan Chase & Co.
- AnchorBank, fsb: Janesville Branch at 2215 Holiday Drive, branch established on 1987/06/30; Janesville Branch at 100 W Racine St, branch established on 1920/01/01. Info updated 2011/07/21: Bank assets: $3,067.4 mil, Deposits: $2,481.9 mil, headquarters in Madison, WI, negative income in the last year, Commercial Lending Specialization, 56 total offices
- Associated Bank, National Association: Janesville Lexington Branch at 2720 North Lexington Drive, branch established on 1986/06/30; Janesville Pick N Save Branch at 1717 South Center Avenue, Suite 7, branch established on 2004/06/30. Info updated 2008/09/12: Bank assets: $21,715.0 mil, Deposits: $15,244.4 mil, headquarters in Green Bay, WI, positive income, Commercial Lending Specialization, 282 total offices, Holding Company: Associated Banc-Corp
- Mid America Bank: at 2317 Milton Avenue, branch established on 1910/01/03. Info updated 2006/11/03: Bank assets: $118.1 mil, Deposits: $101.6 mil, local headquarters, positive income, Commercial Lending Specialization, 4 total offices, Holding Company: Wisconsin Bancorp, Inc.
- The First National Bank and Trust Company: Janesville Branch at 2636 South Highway 51, branch established on 2007/12/12. Info updated 2009/12/03: Bank assets: $834.5 mil, Deposits: $661.8 mil, headquarters in Beloit, WI, positive income, Commercial Lending Specialization, 13 total offices, Holding Company: Centre 1 Bancorp, Inc.
- McFarland State Bank: Janesville Branch at 2701 North Pontiac Drive, branch established on 2006/10/02. Info updated 2011/01/31: Bank assets: $488.2 mil, Deposits: $353.4 mil, headquarters in Mc Farland, WI, positive income, Commercial Lending Specialization, 7 total offices, Holding Company: Northern Bankshares, Inc.
- U.S. Bank National Association: Janesville Madison Branch at 2732 Milton Avenue, branch established on 1996/06/04. Info updated 2012/01/30: Bank assets: $330,470.8 mil, Deposits: $236,091.5 mil, headquarters in Cincinnati, OH, positive income, 3121 total offices, Holding Company: U.S. Bancorp
- 3 other banks with 3 local branches
For population 15 years and over in Janesville:
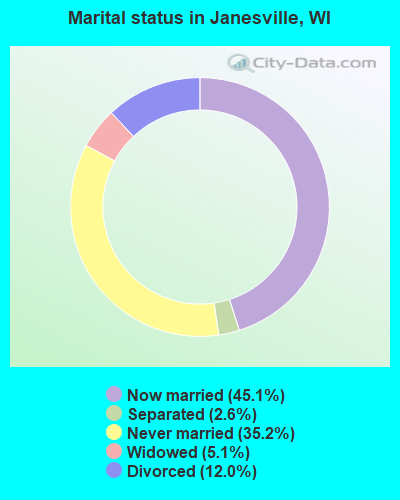
- Never married: 35.2%
- Now married: 45.1%
- Separated: 2.6%
- Widowed: 5.1%
- Divorced: 12.0%
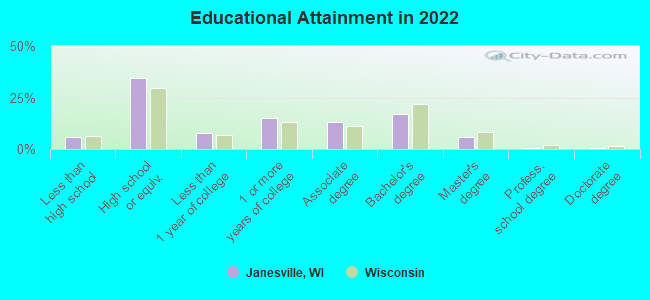
For population 25 years and over in Janesville:
- High school or higher: 94.3%
- Bachelor's degree or higher: 23.9%
- Graduate or professional degree: 7.0%
- Unemployed: 4.7%
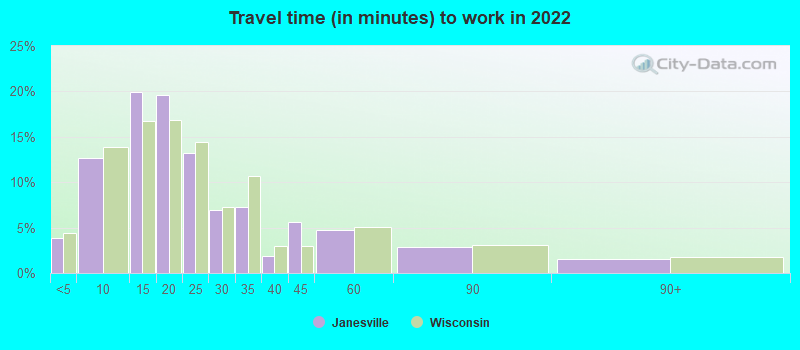
- Mean travel time to work (commute): 21.8 minutes
| Here: | 9.1 |
| Wisconsin average: | 10.4 |

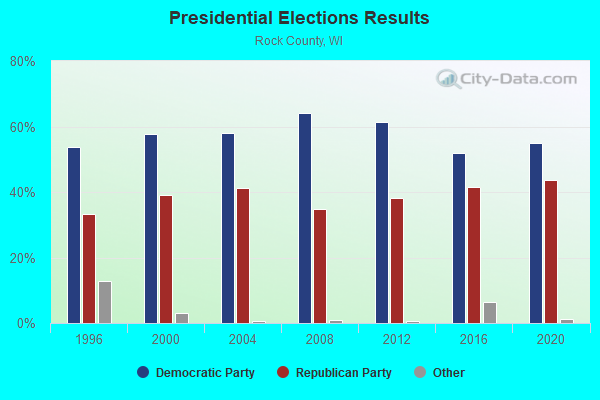
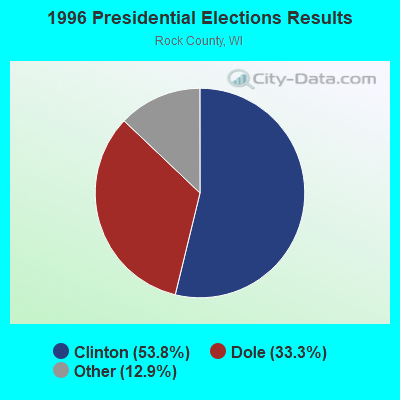

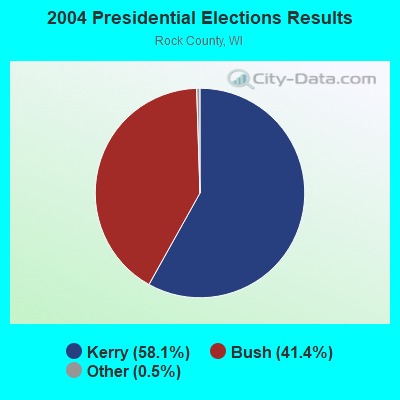
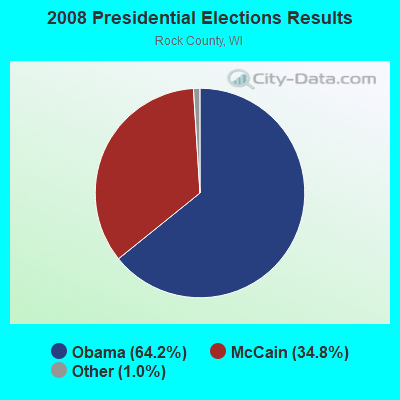
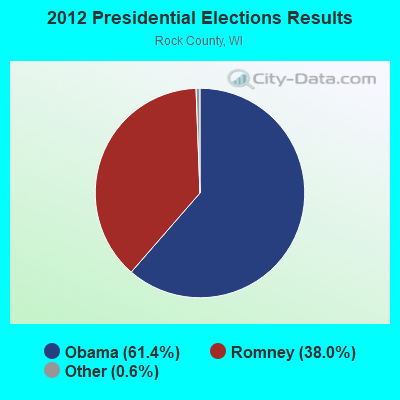
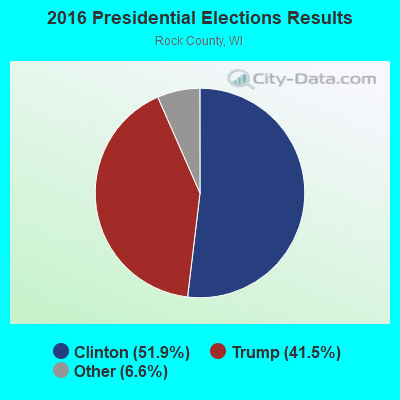
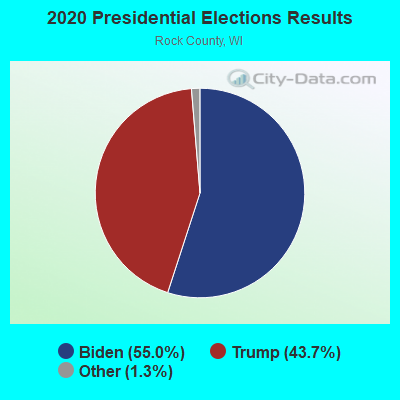
Graphs represent county-level data. Detailed 2008 Election Results
Religion statistics for Janesville, WI (based on Rock County data)
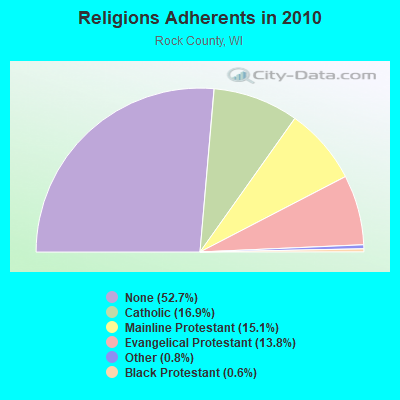
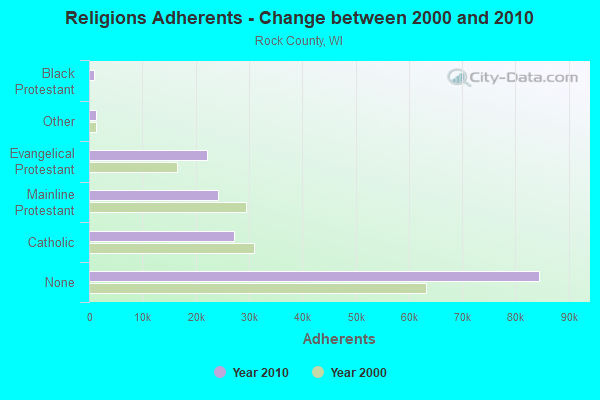
| Religion | Adherents | Congregations |
|---|---|---|
| Catholic | 27,158 | 12 |
| Mainline Protestant | 24,208 | 48 |
| Evangelical Protestant | 22,177 | 80 |
| Other | 1,347 | 13 |
| Black Protestant | 941 | 4 |
| None | 84,500 | - |
Food Environment Statistics:
| Rock County: | 1.38 / 10,000 pop. |
| Wisconsin: | 1.86 / 10,000 pop. |
| Rock County: | 0.13 / 10,000 pop. |
| Wisconsin: | 0.11 / 10,000 pop. |
| This county: | 0.50 / 10,000 pop. |
| State: | 0.38 / 10,000 pop. |
| Here: | 4.08 / 10,000 pop. |
| Wisconsin: | 4.12 / 10,000 pop. |
| Rock County: | 8.16 / 10,000 pop. |
| State: | 8.64 / 10,000 pop. |
| This county: | 8.4% |
| State: | 7.6% |
| Rock County: | 27.5% |
| State: | 27.5% |
| Rock County: | 13.5% |
| Wisconsin: | 13.0% |
Health and Nutrition:
| This city: | 48.9% |
| Wisconsin: | 49.5% |
| This city: | 45.2% |
| Wisconsin: | 46.6% |
| Here: | 28.8 |
| State: | 28.7 |
| Here: | 21.8% |
| Wisconsin: | 21.4% |
| Janesville: | 10.7% |
| Wisconsin: | 10.2% |
| Janesville: | 6.8 |
| State: | 6.8 |
| This city: | 33.8% |
| Wisconsin: | 34.0% |
| This city: | 55.9% |
| Wisconsin: | 56.3% |
| This city: | 78.0% |
| Wisconsin: | 78.5% |
More about Health and Nutrition of Janesville, WI Residents
| Local government employment and payroll (March 2022) | |||||
| Function | Full-time employees | Monthly full-time payroll | Average yearly full-time wage | Part-time employees | Monthly part-time payroll |
|---|---|---|---|---|---|
| Police Protection - Officers | 88 | $547,938 | $74,719 | 0 | $0 |
| Firefighters | 86 | $608,849 | $84,956 | 1 | $222 |
| Streets and Highways | 64 | $375,713 | $70,446 | 0 | $0 |
| Local Libraries | 56 | $276,384 | $59,225 | 77 | $134,608 |
| Police - Other | 29 | $192,875 | $79,810 | 15 | $15,560 |
| Transit | 24 | $139,673 | $69,837 | 2 | $3,403 |
| Water Supply | 23 | $136,024 | $70,969 | 0 | $0 |
| Parks and Recreation | 23 | $130,889 | $68,290 | 30 | $13,737 |
| Other Government Administration | 22 | $131,679 | $71,825 | 3 | $6,858 |
| Financial Administration | 20 | $121,753 | $73,052 | 0 | $0 |
| Other and Unallocable | 13 | $86,187 | $79,557 | 2 | $1,683 |
| Sewerage | 12 | $75,131 | $75,131 | 0 | $0 |
| Fire - Other | 8 | $63,995 | $95,993 | 0 | $0 |
| Solid Waste Management | 5 | $32,900 | $78,960 | 0 | $0 |
| Judicial and Legal | 4 | $30,241 | $90,723 | 0 | $0 |
| Housing and Community Development (Local) | 3 | $19,497 | $77,988 | 0 | $0 |
| Welfare | 2 | $9,269 | $55,614 | 0 | $0 |
| Totals for Government | 482 | $2,978,995 | $74,166 | 130 | $176,071 |
Janesville government finances - Expenditure in 2021 (per resident):
- Assistance and Subsidies - Public Welfare, Cash Assistance Programs - Other: $630,000 ($9.56)
- Construction - Regular Highways: $14,682,000 ($222.75)
General - Other: $7,038,000 ($106.78)
Solid Waste Management: $6,997,000 ($106.16)
Water Utilities: $5,189,000 ($78.73)
Libraries: $2,327,000 ($35.31)
Sewerage: $1,472,000 ($22.33)
Police Protection: $1,010,000 ($15.32)
Parks and Recreation: $360,000 ($5.46)
General Public Buildings: $328,000 ($4.98)
Local Fire Protection: $150,000 ($2.28)
Health - Other: $25,000 ($0.38)
- Current Operations - Police Protection: $14,462,000 ($219.42)
General - Other: $11,767,000 ($178.53)
Regular Highways: $10,729,000 ($162.78)
Sewerage: $9,753,000 ($147.97)
Local Fire Protection: $9,744,000 ($147.84)
Libraries: $8,087,000 ($122.70)
Solid Waste Management: $7,776,000 ($117.98)
Water Utilities: $7,363,000 ($111.71)
Housing and Community Development: $4,368,000 ($66.27)
Transit Utilities: $4,256,000 ($64.57)
Parks and Recreation: $3,663,000 ($55.57)
Health - Other: $3,223,000 ($48.90)
Central Staff Services: $1,969,000 ($29.87)
Financial Administration: $1,786,000 ($27.10)
Protective Inspection and Regulation - Other: $1,122,000 ($17.02)
Natural Resources - Other: $640,000 ($9.71)
Public Welfare - Other: $603,000 ($9.15)
Judicial and Legal Services: $572,000 ($8.68)
General Public Buildings: $391,000 ($5.93)
Miscellaneous Commercial Activities - Other: $224,000 ($3.40)
Parking Facilities: $94,000 ($1.43)
Correctional Institutions: $19,000 ($0.29)
- General - Interest on Debt: $3,155,000 ($47.87)
- Other Capital Outlay - Transit Utilities: $4,191,000 ($63.59)
Regular Highways: $2,626,000 ($39.84)
Sewerage: $1,116,000 ($16.93)
General - Other: $1,010,000 ($15.32)
Police Protection: $958,000 ($14.53)
Parks and Recreation: $445,000 ($6.75)
Libraries: $337,000 ($5.11)
Central Staff Services: $225,000 ($3.41)
Housing and Community Development: $9,000 ($0.14)
- Total Salaries and Wages: $2,243,000 ($34.03)
Janesville government finances - Revenue in 2021 (per resident):
- Charges - Sewerage: $9,901,000 ($150.22)
Solid Waste Management: $8,579,000 ($130.16)
Regular Highways: $6,301,000 ($95.60)
Other: $3,953,000 ($59.97)
Parks and Recreation: $1,561,000 ($23.68)
Housing and Community Development: $294,000 ($4.46)
Miscellaneous Commercial Activities: $250,000 ($3.79)
Parking Facilities: $6,000 ($0.09)
- Federal Intergovernmental - Housing and Community Development: $4,303,000 ($65.29)
Other: $1,289,000 ($19.56)
General Local Government Support: $434,000 ($6.58)
- Local Intergovernmental - Other: $3,448,000 ($52.31)
- Miscellaneous - General Revenue - Other: $2,517,000 ($38.19)
Special Assessments: $759,000 ($11.52)
Interest Earnings: $659,000 ($10.00)
Sale of Property: $326,000 ($4.95)
Fines and Forfeits: $296,000 ($4.49)
Rents: $240,000 ($3.64)
Donations From Private Sources: $8,000 ($0.12)
- Revenue - Water Utilities: $13,604,000 ($206.40)
Transit Utilities: $254,000 ($3.85)
- State Intergovernmental - General Local Government Support: $8,890,000 ($134.88)
Other: $6,621,000 ($100.45)
Highways: $2,657,000 ($40.31)
Education: $1,401,000 ($21.26)
Transit Utilities: $80,000 ($1.21)
- Tax - Property: $45,185,000 ($685.55)
Other License: $1,150,000 ($17.45)
Motor Vehicle License: $1,055,000 ($16.01)
Occupation and Business License - Other: $804,000 ($12.20)
Other Selective Sales: $678,000 ($10.29)
Janesville government finances - Debt in 2021 (per resident):
- Long Term Debt - Outstanding Unspecified Public Purpose: $110,659,000 ($1678.92)
Beginning Outstanding - Unspecified Public Purpose: $95,589,000 ($1450.27)
Issue, Unspecified Public Purpose: $50,947,000 ($772.97)
Retired Unspecified Public Purpose: $35,877,000 ($544.32)
- Short Term Debt Outstanding - Beginning: $18,768,000 ($284.75)
End of Fiscal Year: $16,824,000 ($255.25)
Janesville government finances - Cash and Securities in 2021 (per resident):
- Other Funds - Cash and Securities: $591,000 ($8.97)
| Businesses in Janesville, WI | ||||
| Name | Count | Name | Count | |
|---|---|---|---|---|
| ALDI | 1 | La-Z-Boy | 3 | |
| AT&T | 1 | Lane Furniture | 2 | |
| Ace Hardware | 2 | LensCrafters | 1 | |
| Advance Auto Parts | 1 | Little Caesars Pizza | 2 | |
| Aeropostale | 1 | MasterBrand Cabinets | 15 | |
| American Eagle Outfitters | 1 | Maurices | 1 | |
| Applebee's | 1 | Mazda | 1 | |
| Arby's | 1 | McDonald's | 4 | |
| AutoZone | 2 | Menards | 1 | |
| Baskin-Robbins | 1 | Microtel | 1 | |
| Bath & Body Works | 1 | Motel 6 | 1 | |
| Baymont Inn | 1 | Nike | 12 | |
| Blockbuster | 1 | Nissan | 1 | |
| Buffalo Wild Wings | 1 | OfficeMax | 1 | |
| Burger King | 3 | Old Navy | 1 | |
| CVS | 1 | Olive Garden | 1 | |
| Carson Pirie Scott | 1 | Pac Sun | 1 | |
| Chevrolet | 1 | Panda Express | 1 | |
| Chuck E. Cheese's | 1 | Papa John's Pizza | 1 | |
| Cold Stone Creamery | 1 | Payless | 1 | |
| Cracker Barrel | 1 | Penske | 1 | |
| Cricket Wireless | 4 | Pier 1 Imports | 1 | |
| Curves | 1 | Pizza Hut | 3 | |
| DHL | 1 | Quiznos | 1 | |
| Dairy Queen | 3 | RadioShack | 1 | |
| Decora Cabinetry | 3 | Red Robin | 1 | |
| Dennys | 1 | Rue21 | 1 | |
| Domino's Pizza | 1 | SAS Shoes | 1 | |
| Dunkin Donuts | 2 | Sam's Club | 1 | |
| Econo Lodge | 1 | Sears | 2 | |
| Famous Footwear | 1 | Slumberland | 1 | |
| FedEx | 9 | Spencer Gifts | 1 | |
| Finish Line | 1 | Sprint Nextel | 1 | |
| Firestone Complete Auto Care | 1 | Staples | 1 | |
| Ford | 1 | Starbucks | 2 | |
| GNC | 2 | Subaru | 1 | |
| GameStop | 1 | Subway | 6 | |
| Gap | 1 | Super 8 | 1 | |
| H&R Block | 3 | T-Mobile | 1 | |
| Hardee's | 1 | T.J.Maxx | 1 | |
| Hilton | 1 | Taco Bell | 3 | |
| Hobby Lobby | 1 | Target | 1 | |
| Holiday Inn | 1 | Toyota | 1 | |
| Home Depot | 1 | Toys"R"Us | 1 | |
| HomeTown Buffet | 1 | True Value | 1 | |
| Honda | 1 | U-Haul | 3 | |
| Hyundai | 1 | UPS | 13 | |
| IHOP | 1 | Vans | 3 | |
| JCPenney | 1 | Verizon Wireless | 1 | |
| Jimmy John's | 2 | Victoria's Secret | 1 | |
| Jones New York | 2 | Volkswagen | 1 | |
| Journeys | 1 | Walgreens | 4 | |
| Justice | 1 | Walmart | 1 | |
| KFC | 1 | Wendy's | 2 | |
| Kmart | 1 | YMCA | 1 | |
| Kohl's | 1 | |||
Strongest AM radio stations in Janesville:
- WCLO (1230 AM; 1 kW; JANESVILLE, WI; Owner: SOUTHERN WISCONSIN BROADCASTING, LLC.)
- WTMJ (620 AM; 50 kW; MILWAUKEE, WI; Owner: JOURNAL BROADCAST CORPORATION)
- WISN (1130 AM; 50 kW; MILWAUKEE, WI; Owner: CAPSTAR TX LIMITED PARTNERSHIP)
- WTJK (1380 AM; 5 kW; SOUTH BELOIT, IL; Owner: GOOD KARMA BROADCASTING, L.L.C.)
- WGN (720 AM; 50 kW; CHICAGO, IL; Owner: WGN CONTINENTAL BROADCASTING CO.)
- WSCR (670 AM; 50 kW; CHICAGO, IL; Owner: INFINITY BROADCASTING OPERATIONS, INC.)
- WTSO (1070 AM; 10 kW; MADISON, WI; Owner: CAPSTAR TX LIMITED PARTNERSHIP)
- WBBM (780 AM; 50 kW; CHICAGO, IL; Owner: INFINITY BROADCASTING OPERATIONS, INC.)
- WMVP (1000 AM; 50 kW; CHICAGO, IL; Owner: ABC, INC.)
- WLMV (1480 AM; 10 kW; MADISON, WI; Owner: MID-WEST MANAGEMENT, INC.)
- WTDY (1670 AM; 10 kW; MADISON, WI; Owner: MID-WEST MANAGEMENT, INC.)
- WLS (890 AM; 50 kW; CHICAGO, IL; Owner: WLS, INC.)
- WHA (970 AM; 5 kW; MADISON, WI; Owner: BOARD REGENTS OF UNIV OF WI SYSTEM)
Strongest FM radio stations in Janesville:
- WSJY (107.3 FM; FORT ATKINSON, WI; Owner: NEWRADIO GROUP, LLC)
- WJVL (99.9 FM; JANESVILLE, WI; Owner: SOUTHERN WISCONSIN BROADCASTING, L.L.C.)
- WKPO (105.9 FM; EVANSVILLE, WI; Owner: GOOD KARMA BROADCASTING, L.L.C.)
- WERN (88.7 FM; MADISON, WI; Owner: STATE OF WISCONSIN - EDUCATIONAL COMMUNICATIONS BOARD)
- WZEE (104.1 FM; MADISON, WI; Owner: CAPSTAR TX LIMITED PARTNERSHIP)
- WFEN (88.3 FM; ROCKFORD, IL; Owner: FAITH ACADEMY, DBA WFEN)
- WKMQ-FM (96.7 FM; LOVES PARK, IL; Owner: CUMULUS LICENSING CORP.)
- WGFB (103.1 FM; ROCKTON, IL; Owner: WRWC, Inc.)
- WIBA-FM (101.5 FM; MADISON, WI; Owner: CAPSTAR TX LIMITED PARTNERSHIP)
- WORT (89.9 FM; MADISON, WI; Owner: BACK PORCH RADIO BROADCASTING, INC.)
- WSLD (104.5 FM; WHITEWATER, WI; Owner: WPW BROADCASTING, INC.)
- WMGN (98.1 FM; MADISON, WI; Owner: MID-WEST MANAGEMENT, INC.)
- WGSL (91.1 FM; LOVES PARK, IL; Owner: CHRISTIAN LIFE CENTER SCHOOL)
- WQFL (100.9 FM; ROCKFORD, IL; Owner: QUEST FOR LIFE, INC.)
- WJJO (94.1 FM; WATERTOWN, WI; Owner: MID-WEST MANAGMENT, INC.)
- WMMM-FM (105.5 FM; VERONA, WI; Owner: ENTERCOM MADISON LICENSE, LLC.)
- WYHY (95.3 FM; WINNEBAGO, IL; Owner: AIRPLAY BROADCASTING CORPORATION)
- WXRX (104.9 FM; BELVIDERE, IL; Owner: AIRPLAY BROADCASTING CORP.)
- WKCH (106.5 FM; WHITEWATER, WI; Owner: NEWRADIO GROUP, LLC)
- WZOK (97.5 FM; ROCKFORD, IL; Owner: CUMULUS LICENSING CORP.)
TV broadcast stations around Janesville:
- W65EE (Channel 65; JANESVILLE, WI; Owner: TRINITY BROADCASTING NETWORK)
- WISC-TV (Channel 3; MADISON, WI; Owner: TELEVISION WISCONSIN, INC.)
- WMSN-TV (Channel 47; MADISON, WI; Owner: WMSN LICENSEE, LLC)
- WKOW-TV (Channel 27; MADISON, WI; Owner: WKOW TELEVISION, INC.)
- WHA-TV (Channel 21; MADISON, WI; Owner: BOARD OF REGENTS OF THE UNIV. OF WISCONSIN SYSTEM)
- WMTV (Channel 15; MADISON, WI; Owner: GRAY MIDAMERICA TV LICENSEE CORP.)
- WIFR (Channel 23; FREEPORT, IL; Owner: GRAY MIDAMERICA TV LICENSEE CORP.)
- WTVO (Channel 17; ROCKFORD, IL; Owner: WINNEBAGO TELEVISION CORPORATION)
- WFBN-LP (Channel 33; ROCKFORD, IL; Owner: WEIGEL BROADCASTING COMPANY)
- WQRF-TV (Channel 39; ROCKFORD, IL; Owner: QUORUM OF ROCKFORD LICENSE, LLC)
- WREX-TV (Channel 13; ROCKFORD, IL; Owner: WREX TELEVISION, LLC)
- WCFC-CA (Channel 51; ROCKFORD, IL; Owner: CHRISTIAN COMMUNICATIONS OF CHICAGOLAND, INC.)
Medal of Honor Recipients
Medal of Honor Recipients born in Janesville: Claron A. Windus, Leslie Allen Bellrichard.
- National Bridge Inventory (NBI) Statistics
- 92Number of bridges
- 869ft / 265mTotal length
- $11,178,000Total costs
- 1,251,424Total average daily traffic
- 210,748Total average daily truck traffic
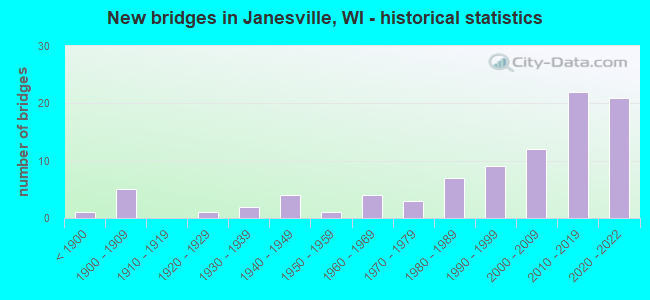
- New bridges - historical statistics
- 1Before 1900
- 51900-1909
- 11920-1929
- 21930-1939
- 41940-1949
- 11950-1959
- 41960-1969
- 31970-1979
- 71980-1989
- 91990-1999
- 122000-2009
- 222010-2019
- 212020-2022
FCC Registered Antenna Towers: 244 (See the full list of FCC Registered Antenna Towers)
FCC Registered Commercial Land Mobile Towers: 2 (See the full list of FCC Registered Commercial Land Mobile Towers in Janesville, WI)
FCC Registered Private Land Mobile Towers: 11 (See the full list of FCC Registered Private Land Mobile Towers)
FCC Registered Broadcast Land Mobile Towers: 83 (See the full list of FCC Registered Broadcast Land Mobile Towers)
FCC Registered Microwave Towers: 57 (See the full list of FCC Registered Microwave Towers in this town)
FCC Registered Paging Towers: 10 (See the full list of FCC Registered Paging Towers)
FCC Registered Maritime Coast & Aviation Ground Towers: 4 (See the full list of FCC Registered Maritime Coast & Aviation Ground Towers)
FCC Registered Amateur Radio Licenses: 255 (See the full list of FCC Registered Amateur Radio Licenses in Janesville)
FAA Registered Aircraft Manufacturers and Dealers: 4 (See the full list of FAA Registered Manufacturers and Dealers in Janesville)
FAA Registered Aircraft: 79 (See the full list of FAA Registered Aircraft)
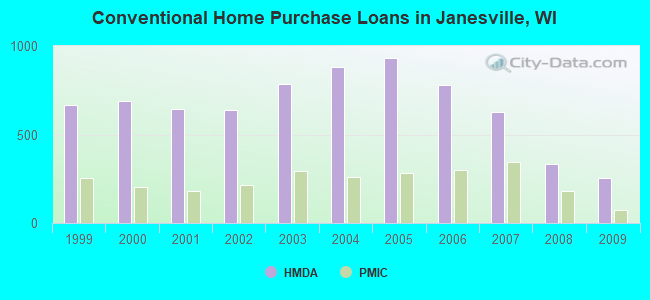
| Home Mortgage Disclosure Act Aggregated Statistics For Year 2009 (Based on 10 full and 4 partial tracts) | ||||||||||||||
| A) FHA, FSA/RHS & VA Home Purchase Loans | B) Conventional Home Purchase Loans | C) Refinancings | D) Home Improvement Loans | E) Loans on Dwellings For 5+ Families | F) Non-occupant Loans on < 5 Family Dwellings (A B C & D) | G) Loans On Manufactured Home Dwelling (A B C & D) | ||||||||
|---|---|---|---|---|---|---|---|---|---|---|---|---|---|---|
| Number | Average Value | Number | Average Value | Number | Average Value | Number | Average Value | Number | Average Value | Number | Average Value | Number | Average Value | |
| LOANS ORIGINATED | 146 | $102,209 | 257 | $80,358 | 1,002 | $106,310 | 42 | $37,899 | 7 | $848,286 | 92 | $69,324 | 14 | $24,678 |
| APPLICATIONS APPROVED, NOT ACCEPTED | 4 | $92,695 | 14 | $61,036 | 106 | $110,429 | 8 | $52,435 | 0 | $0 | 7 | $89,151 | 4 | $17,165 |
| APPLICATIONS DENIED | 27 | $96,507 | 47 | $72,559 | 285 | $111,928 | 31 | $31,765 | 1 | $829,910 | 23 | $88,710 | 14 | $26,541 |
| APPLICATIONS WITHDRAWN | 8 | $108,522 | 22 | $76,949 | 171 | $113,310 | 8 | $14,988 | 3 | $1,913,333 | 11 | $118,742 | 0 | $0 |
| FILES CLOSED FOR INCOMPLETENESS | 3 | $123,020 | 3 | $75,330 | 48 | $113,784 | 2 | $120,610 | 0 | $0 | 6 | $79,333 | 0 | $0 |
Detailed mortgage data for all 13 tracts in Janesville, WI
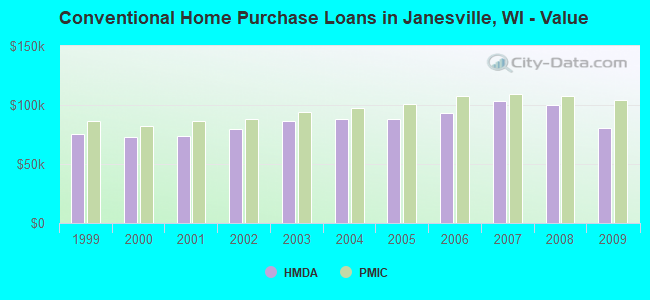
| Private Mortgage Insurance Companies Aggregated Statistics For Year 2009 (Based on 9 full and 4 partial tracts) | ||||
| A) Conventional Home Purchase Loans | B) Refinancings | |||
|---|---|---|---|---|
| Number | Average Value | Number | Average Value | |
| LOANS ORIGINATED | 72 | $104,107 | 74 | $120,273 |
| APPLICATIONS APPROVED, NOT ACCEPTED | 7 | $142,360 | 20 | $135,158 |
| APPLICATIONS DENIED | 10 | $86,990 | 9 | $121,851 |
| APPLICATIONS WITHDRAWN | 6 | $95,963 | 6 | $133,393 |
| FILES CLOSED FOR INCOMPLETENESS | 0 | $0 | 0 | $0 |
2002 - 2018 National Fire Incident Reporting System (NFIRS) incidents
- Fire incident types reported to NFIRS in Janesville, WI
- 1,06937.7%Structure Fires
- 89631.6%Outside Fires
- 52018.3%Mobile Property/Vehicle Fires
- 35312.4%Other
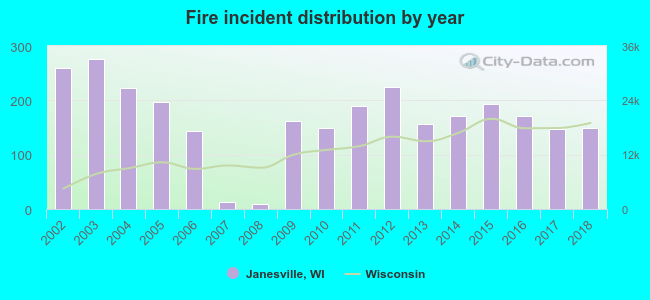 Based on the data from the years 2002 - 2018 the average number of fires per year is 167. The highest number of reported fire incidents - 276 took place in 2003, and the least - 10 in 2008. The data has a decreasing trend.
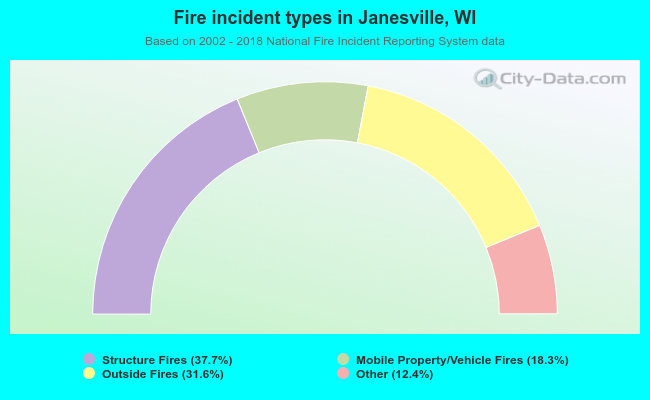 When looking into fire subcategories, the most reports belonged to: Structure Fires (37.7%), and Outside Fires (31.6%).
Fire-safe hotels and motels in Janesville, Wisconsin:
- Ramada Inn, 3431 Milton Ave, Janesville, Wisconsin 53545 , Phone: (608) 756-2341, Fax: (608) 756-4183
- Holiday Inn Express, 3100 Wellington Pl, Janesville, Wisconsin 53546 , Phone: (608) 756-3100, Fax: (608) 756-3111
- Super 8, 3430 Milton Ave, Janesville, Wisconsin 53545 , Phone: (608) 756-2040
- Ramada Janesville, 3900 Milton Ave, Janesville, Wisconsin 53546 , Phone: (608) 756-4511, Fax: (608) 757-4441
- Cobblestone Hotel & Suites - Janesville, 20 W Milwaukee St, Janesville, Wisconsin 53548 , Phone: (888) 693-8262
- TownePlace Suites, 2706 Pontiac Pl, Janesville, Wisconsin 53545 , Phone: (608) 898-4200, Fax: (608) 898-4201
| Most common first names in Janesville, WI among deceased individuals | ||
| Name | Count | Lived (average) |
|---|---|---|
| John | 372 | 74.5 years |
| Robert | 371 | 70.8 years |
| Mary | 366 | 80.6 years |
| William | 328 | 75.6 years |
| James | 227 | 70.0 years |
| George | 219 | 77.0 years |
| Helen | 207 | 80.1 years |
| Dorothy | 203 | 79.0 years |
| Margaret | 198 | 80.4 years |
| Ruth | 173 | 79.3 years |
| Most common last names in Janesville, WI among deceased individuals | ||
| Last name | Count | Lived (average) |
|---|---|---|
| Johnson | 141 | 74.4 years |
| Smith | 131 | 77.1 years |
| Anderson | 118 | 76.1 years |
| Miller | 81 | 74.3 years |
| Olson | 75 | 77.8 years |
| Brown | 73 | 76.7 years |
| Thompson | 63 | 77.0 years |
| Peterson | 57 | 77.4 years |
| Hanson | 57 | 76.6 years |
| Schultz | 57 | 79.6 years |
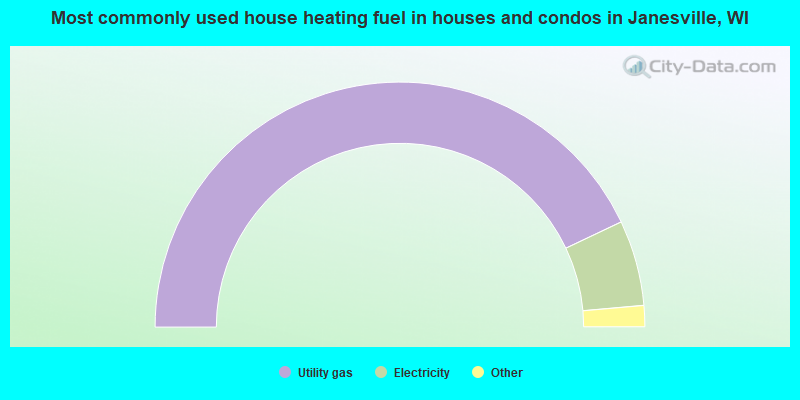
- 85.9%Utility gas
- 11.3%Electricity
- 1.0%Bottled, tank, or LP gas
- 0.7%Wood
- 0.7%Fuel oil, kerosene, etc.
- 0.2%Other fuel
- 0.1%No fuel used
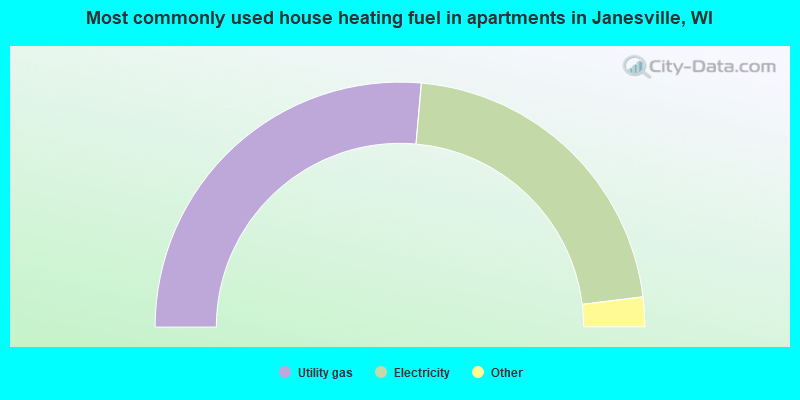
- 52.8%Utility gas
- 43.3%Electricity
- 1.5%Bottled, tank, or LP gas
- 1.5%Other fuel
- 0.9%No fuel used
Janesville compared to Wisconsin state average:
- Unemployed percentage below state average.
- Black race population percentage below state average.
- Median age below state average.
Janesville on our top lists:
- #8 on the list of "Top 101 cities with largest percentage of males in occupations: production occupations (population 50,000+)"
- #14 on the list of "Top 101 cities with largest percentage of males in industries: manufacturing (population 50,000+)"
- #20 on the list of "Top 101 cities with largest percentage of females in industries: wholesale trade (population 50,000+)"
- #32 on the list of "Top 101 cities with the coldest winters (population 50,000+)"
- #35 on the list of "Top 101 cities with the lowest daily low temperatures (population 50,000+)"
- #37 on the list of "Top 101 cities with the highest ratio of rapes to murders between 2002 and 2012 (population 50,000+)"
- #38 on the list of "Top 100 least racially diverse cities (pop. 50,000+)"
- #43 on the list of "Top 101 cities with the largest temperature differences during a year (population 50,000+)"
- #47 on the list of "Top 101 cities with the lowest average temperatures (population 50,000+)"
- #50 on the list of "Top 101 larger cities with the largest decrease or smallest increase in household income from 2000 (population 50,000+)"
- #57 on the list of "Top 101 cities with largest percentage of females in occupations: farming, fishing, and forestry occupations (population 50,000+)"
- #66 on the list of "Top 101 cities with the highest percentage of English-only speaking households, population 50,000+"
- #74 on the list of "Top 101 cities with largest percentage of females in industries: utilities (population 50,000+)"
- #79 on the list of "Top 101 larger cities with the largest decrease or smallest increase in house/condo value from 2000 (population 50,000+)"
- #79 on the list of "Top 101 cities with the most people born in the same U.S. state as the city (population 50,000+)"
- #80 on the list of "Top 101 cities with largest percentage of females in industries: manufacturing (population 50,000+)"
- #80 on the list of "Top 101 cities with largest percentage of males in industries: wholesale trade (population 50,000+)"
- #84 on the list of "Top 101 cities with the highest average humidity (population 50,000+)"
- #85 on the list of "Top 101 cities with largest percentage of workers with very short commute times (9 minutes or less) (population 50,000+)"
- #89 on the list of "Top 101 cities with largest percentage of females in occupations: health technologists and technicians (population 50,000+)"
- #38 on the list of "Top 101 counties with the lowest percentage of residents relocating to foreign countries in 2011"

|
|
Total of 242 patent applications in 2008-2024.