Estimated zip code population in 2022: 49,837 Zip code population in 2010: 45,728 Zip code population in 2000: 42,476
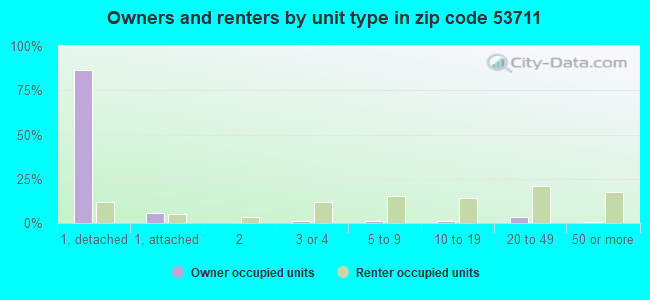
Houses and condos: 23,199 Renter-occupied apartments: 8,569
% of renters here:
38%
State:
32%
March 2022 cost of living index in zip code 53711: 97.3 (near average, U.S. average is 100)
Land area: 25.5 sq. mi. Water area: 3.5 sq. mi.
Population density: 1,953 people per square mile
(low).
OSM Map
General Map
Google Map
MSN Map
OSM Map
General Map
Google Map
MSN Map
OSM Map
General Map
Google Map
MSN Map
OSM Map
General Map
Google Map
MSN Map
Please wait while loading the map...
Real estate property taxes paid for housing units in 2022:
This zip code:
1.7% ($6,675)
Wisconsin:
1.4% ($3,497)
Median real estate property taxes paid for housing units with mortgages in 2022: $6,607 (1.6%) Median real estate property taxes paid for housing units with no mortgage in 2022: $6,807 (1.7%)
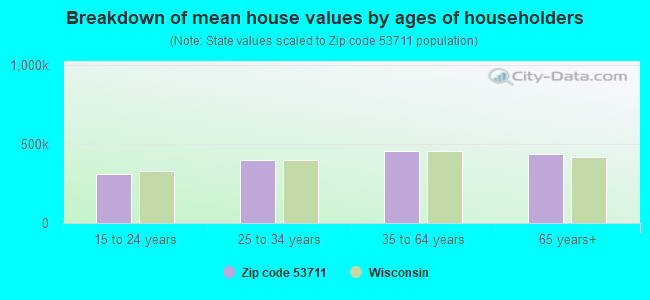
Estimated median house/condo value in 2022: $403,453
53711:
$403,453
Wisconsin:
$252,800
According to our research of Wisconsin and other state lists, there were 57 registered sex offenders living in 53711 zip code as of April 27, 2024. The ratio of all residents to sex offenders in zip code 53711 is 860 to 1. The ratio of registered sex offenders to all residents in this zip code is lower than the state average.
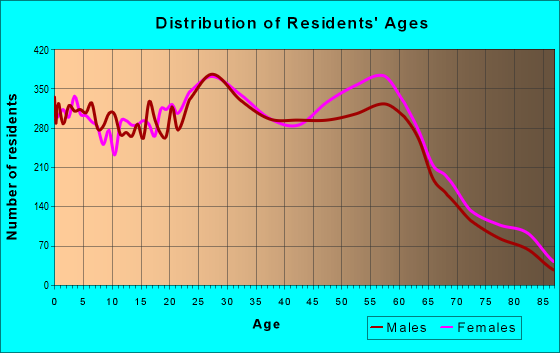
Median resident age:
This zip code:
38.0 years
Wisconsin median age:
40.4 years
Average household size:
This zip code:
2.2 people
Wisconsin:
2.3 people
Averages for the 2020 tax year for zip code 53711, filed in 2021:
Average Adjusted Gross Income (AGI) in 2020: $107,131 (Individual Income Tax Returns)
Here:
$107,131
State:
$72,319
Salary/wage: $80,360 (reported on 83.0% of returns)
Here:
$80,360
State:
$59,242
(% of AGI for various income ranges: 1272.3% for AGIs below $25k, 3868.7% for AGIs $25k-50k, 6618.7% for AGIs $50k-75k, 9443.7% for AGIs $75k-100k, 19143.1% for AGIs $100k-200k, 74912.9% for AGIs over 200k)
Taxable interest for individuals: $2,115 (reported on 45.8% of returns)
This zip code:
$2,115
Wisconsin:
$1,431
(% of AGI for various income ranges: 18.4% for AGIs below $25k, 23.8% for AGIs $25k-50k, 50.3% for AGIs $50k-75k, 96.1% for AGIs $75k-100k, 178.1% for AGIs $100k-200k, 1785.9% for AGIs over 200k)
Ordinary dividends: $8,224 (reported on 35.5% of returns)
Here:
$8,224
State:
$6,481
(% of AGI for various income ranges: 45.0% for AGIs below $25k, 65.2% for AGIs $25k-50k, 160.8% for AGIs $50k-75k, 311.6% for AGIs $75k-100k, 664.1% for AGIs $100k-200k, 4993.2% for AGIs over 200k)
Net capital gain/loss in AGI: +$26,029 (reported on 32.0% of returns)
Here:
+$26,029
State:
+$18,329
(% of AGI for various income ranges: 22.6% for AGIs below $25k, 52.4% for AGIs $25k-50k, 144.5% for AGIs $50k-75k, 285.6% for AGIs $75k-100k, 815.9% for AGIs $100k-200k, 20955.6% for AGIs over 200k)
Profit/loss from business: +$17,796 (reported on 14.8% of returns)
Here:
+$17,796
State:
+$14,562
(% of AGI for various income ranges: 100.1% for AGIs below $25k, 107.5% for AGIs $25k-50k, 219.2% for AGIs $50k-75k, 284.4% for AGIs $75k-100k, 711.9% for AGIs $100k-200k, 3371.1% for AGIs over 200k)
Taxable individual retirement arrangement distribution: $22,896 (reported on 12.2% of returns)
53711:
$22,896
Wisconsin:
$19,348
(% of AGI for various income ranges: 58.5% for AGIs below $25k, 127.8% for AGIs $25k-50k, 219.4% for AGIs $50k-75k, 456.9% for AGIs $75k-100k, 952.2% for AGIs $100k-200k, 2886.2% for AGIs over 200k)
Self-employed (Keogh) retirement plans: $23,016 (reported on 1.2% of returns)
53711:
$23,016
Wisconsin:
$21,322
(% of AGI for various income ranges: 18.9% for AGIs $50k-75k, 55.2% for AGIs $100k-200k, 612.3% for AGIs over 200k)
Total itemized deductions: $39,866 (reported on 12.6% of returns)
Here:
$39,866
State:
$33,000
(% of AGI for various income ranges: 76.8% for AGIs below $25k, 152.9% for AGIs $25k-50k, 385.5% for AGIs $50k-75k, 672.0% for AGIs $75k-100k, 953.4% for AGIs $100k-200k, 8344.4% for AGIs over 200k)
Charity contributions: $13,651 (reported on 10.1% of returns)
Here:
$13,651
State:
$12,044
(% of AGI for various income ranges: 4.6% for AGIs below $25k, 16.3% for AGIs $25k-50k, 51.4% for AGIs $50k-75k, 98.1% for AGIs $75k-100k, 235.8% for AGIs $100k-200k, 2937.1% for AGIs over 200k)
Taxes paid: $9,110 (reported on 12.6% of returns)
53711:
$9,110
State:
$8,228
(% of AGI for various income ranges: 18.1% for AGIs below $25k, 45.5% for AGIs $25k-50k, 152.2% for AGIs $50k-75k, 258.9% for AGIs $75k-100k, 332.8% for AGIs $100k-200k, 1073.4% for AGIs over 200k)
Earned income credit: $2,008 (reported on 7.4% of returns)
Here:
$2,008
State:
$2,155
(% of AGI for various income ranges: 61.4% for AGIs below $25k, 32.5% for AGIs $25k-50k, 0.5% for AGIs $50k-75k)
Percentage of individuals using paid preparers for their 2020 taxes: 92.6%
Here:
93%
State:
94%
(% for various income ranges: 90.1% for AGIs below $25k, 92.7% for AGIs $25k-50k, 92.7% for AGIs $50k-75k, 92.9% for AGIs $75k-100k, 93.4% for AGIs $100k-200k, 95.8% for AGIs over 200k)
Averages for the 2012 tax year for zip code 53711, filed in 2013:
Average Adjusted Gross Income (AGI) in 2012: $81,047 (Individual Income Tax Returns)
Here:
$81,047
State:
$57,939
Salary/wage: $63,388 (reported on 84.7% of returns)
Here:
$63,388
State:
$48,248
(% of AGI for various income ranges: 79.2% for AGIs below $25k, 79.4% for AGIs $25k-50k, 72.8% for AGIs $50k-75k, 70.9% for AGIs $75k-100k, 73.5% for AGIs $100k-200k, 51.4% for AGIs over 200k)
Taxable interest for individuals: $1,538 (reported on 49.2% of returns)
This zip code:
$1,538
Wisconsin:
$1,224
(% of AGI for various income ranges: 1.3% for AGIs below $25k, 0.8% for AGIs $25k-50k, 1.1% for AGIs $50k-75k, 0.8% for AGIs $75k-100k, 0.7% for AGIs $100k-200k, 1.1% for AGIs over 200k)
Ordinary dividends: $6,168 (reported on 34.1% of returns)
Here:
$6,168
State:
$5,137
(% of AGI for various income ranges: 2.2% for AGIs below $25k, 1.7% for AGIs $25k-50k, 2.2% for AGIs $50k-75k, 2.1% for AGIs $75k-100k, 2.4% for AGIs $100k-200k, 3.4% for AGIs over 200k)
Net capital gain/loss in AGI: +$13,169 (reported on 26.9% of returns)
Here:
+$13,169
State:
+$11,137
(% of AGI for various income ranges: 0.6% for AGIs $25k-50k, 0.8% for AGIs $50k-75k, 1.0% for AGIs $75k-100k, 1.6% for AGIs $100k-200k, 10.5% for AGIs over 200k)
Profit/loss from business: +$14,552 (reported on 15.7% of returns)
Here:
+$14,552
State:
+$11,943
(% of AGI for various income ranges: 6.1% for AGIs below $25k, 2.6% for AGIs $25k-50k, 2.6% for AGIs $50k-75k, 2.2% for AGIs $75k-100k, 3.1% for AGIs $100k-200k, 2.5% for AGIs over 200k)
Taxable individual retirement arrangement distribution: $18,970 (reported on 12.9% of returns)
53711:
$18,970
Wisconsin:
$14,087
(% of AGI for various income ranges: 3.4% for AGIs below $25k, 2.6% for AGIs $25k-50k, 3.0% for AGIs $50k-75k, 3.0% for AGIs $75k-100k, 3.1% for AGIs $100k-200k, 3.0% for AGIs over 200k)
Self-employment retirement plans: $18,067 (reported on 1.6% of returns)
53711:
$18,067
Wisconsin:
$17,048
(% of AGI for various income ranges: 0.2% for AGIs below $25k, 0.1% for AGIs $50k-75k, 0.1% for AGIs $75k-100k, 0.3% for AGIs $100k-200k, 0.7% for AGIs over 200k)
Total itemized deductions: $26,169 (19% of AGI, reported on 47.4% of returns)
Here:
$26,169
State:
$22,257
Here:
19.0% of AGI
State:
20.1% of AGI
(% of AGI for various income ranges: 11.9% for AGIs below $25k, 12.0% for AGIs $25k-50k, 16.5% for AGIs $50k-75k, 17.3% for AGIs $75k-100k, 17.7% for AGIs $100k-200k, 13.6% for AGIs over 200k)
Charity contributions: $3,898 (reported on 40.2% of returns)
Here:
$3,898
State:
$3,370
(% of AGI for various income ranges: 0.7% for AGIs below $25k, 0.9% for AGIs $25k-50k, 1.5% for AGIs $50k-75k, 1.9% for AGIs $75k-100k, 2.2% for AGIs $100k-200k, 2.3% for AGIs over 200k)
Taxes paid: $14,178 (reported on 47.3% of returns)
53711:
$14,178
State:
$10,731
(% of AGI for various income ranges: 3.3% for AGIs below $25k, 4.7% for AGIs $25k-50k, 7.8% for AGIs $50k-75k, 8.8% for AGIs $75k-100k, 9.9% for AGIs $100k-200k, 8.5% for AGIs over 200k)
Earned income credit: $2,051 (reported on 10.2% of returns)
Here:
$2,051
State:
$2,094
(% of AGI for various income ranges: 4.6% for AGIs below $25k, 0.6% for AGIs $25k-50k)
Percentage of individuals using paid preparers for their 2012 taxes: 43.3%
Here:
43%
State:
54%
(% for various income ranges: 37.8% for AGIs below $25k, 40.7% for AGIs $25k-50k, 44.2% for AGIs $50k-75k, 43.6% for AGIs $75k-100k, 46.2% for AGIs $100k-200k, 69.7% for AGIs over 200k)
Averages for the 2004 tax year for zip code 53711, filed in 2005:
Average Adjusted Gross Income (AGI) in 2004: $66,533 (Individual Income Tax Returns)
Here:
$66,533
State:
$47,735
Salary/wage: $54,251 (reported on 85.0% of returns)
Here:
$54,251
State:
$41,540
(% of AGI for various income ranges: 134.7% for AGIs below $10k, 78.3% for AGIs $10k-25k, 79.5% for AGIs $25k-50k, 76.9% for AGIs $50k-75k, 76.5% for AGIs $75k-100k, 61.5% for AGIs over 100k)
Taxable interest for individuals: $1,888 (reported on 63.1% of returns)
This zip code:
$1,888
Wisconsin:
$1,420
(% of AGI for various income ranges: 11.0% for AGIs below $10k, 2.8% for AGIs $10k-25k, 1.8% for AGIs $25k-50k, 1.4% for AGIs $50k-75k, 1.2% for AGIs $75k-100k, 1.8% for AGIs over 100k)
Taxable dividends: $3,824 (reported on 41.6% of returns)
Here:
$3,824
State:
$2,869
(% of AGI for various income ranges: 8.3% for AGIs below $10k, 2.4% for AGIs $10k-25k, 1.9% for AGIs $25k-50k, 1.8% for AGIs $50k-75k, 1.9% for AGIs $75k-100k, 2.7% for AGIs over 100k)
Net capital gain/loss: +$11,986 (reported on 33.0% of returns)
Here:
+$11,986
State:
+$9,569
(% of AGI for various income ranges: -1.2% for AGIs below $10k, 0.8% for AGIs $10k-25k, 0.6% for AGIs $25k-50k, 1.0% for AGIs $50k-75k, 1.5% for AGIs $75k-100k, 10.1% for AGIs over 100k)
Profit/loss from business: +$14,166 (reported on 15.2% of returns)
Here:
+$14,166
State:
+$10,417
(% of AGI for various income ranges: 4.8% for AGIs below $10k, 3.3% for AGIs $10k-25k, 3.4% for AGIs $25k-50k, 2.9% for AGIs $50k-75k, 3.5% for AGIs $75k-100k, 3.2% for AGIs over 100k)
IRA payment deduction: $2,894 (reported on 2.8% of returns)
53711:
$2,894
Wisconsin:
$2,900
(% of AGI for various income ranges: 0.3% for AGIs below $10k, 0.3% for AGIs $10k-25k, 0.3% for AGIs $25k-50k, 0.2% for AGIs $50k-75k, 0.1% for AGIs $75k-100k, 0.0% for AGIs over 100k)
Self-employed pension: $12,930 (reported on 2.2% of returns)
Here:
$12,930
Wisconsin:
$11,934
(% of AGI for various income ranges: 0.1% for AGIs $10k-25k, 0.1% for AGIs $25k-50k, 0.2% for AGIs $50k-75k, 0.3% for AGIs $75k-100k, 0.6% for AGIs over 100k)
Total itemized deductions: $21,305 (20% of AGI, reported on 50.5% of returns)
Here:
$21,305
State:
$18,160
Here:
19.6% of AGI
State:
21.1% of AGI
(% of AGI for various income ranges: 18.5% for AGIs below $10k, 12.3% for AGIs $10k-25k, 14.4% for AGIs $25k-50k, 19.1% for AGIs $50k-75k, 19.8% for AGIs $75k-100k, 15.1% for AGIs over 100k)
Charity contributions deductions: $3,332 (3% of AGI, reported on 45.2% of returns)
Here:
$3,332
State:
$2,711
Here:
2.9% of AGI
State:
3.0% of AGI
(% of AGI for various income ranges: 0.7% for AGIs below $10k, 0.9% for AGIs $10k-25k, 1.4% for AGIs $25k-50k, 1.9% for AGIs $50k-75k, 2.2% for AGIs $75k-100k, 2.7% for AGIs over 100k)
Total tax: $11,592 (reported on 81.3% of returns)
53711:
$11,592
State:
$7,114
(% of AGI for various income ranges: 3.3% for AGIs below $10k, 4.4% for AGIs $10k-25k, 8.0% for AGIs $25k-50k, 9.5% for AGIs $50k-75k, 10.4% for AGIs $75k-100k, 18.7% for AGIs over 100k)
Earned income credit: $1,514 (reported on 7.5% of returns)
Here:
$1,514
State:
$1,544
Percentage of individuals using paid preparers for their 2004 taxes: 45.6%
Here:
46%
State:
57%
(% for various income ranges: 41.0% for AGIs below $10k, 46.0% for AGIs $10k-25k, 42.9% for AGIs $25k-50k, 44.4% for AGIs $50k-75k, 43.9% for AGIs $75k-100k, 55.3% for AGIs over 100k)
Likely homosexual households (counted as self-reported same-sex unmarried-partner households)
Lesbian couples: 0.8% of all households
Gay men: 0.2% of all households
Household received Food Stamps/SNAP in the past 12 months: 1,635 Household did not receive Food Stamps/SNAP in the past 12 months: 20,792
Women who had a birth in the past 12 months: 653 (509 now married, 144 unmarried) Women who did not have a birth in the past 12 months: 11,100 (4,801 now married, 6,299 unmarried)
Housing units in zip code 53711 with a mortgage: 8,952 (1,341 second mortgage, 35 home equity loan, 1,188 both second mortgage and home equity loan) Houses without a mortgage: 218
Median monthly owner costs for units with a mortgage: $2,126 Median monthly owner costs for units without a mortgage: $947
Residents with income below the poverty level in 2022:
This zip code:
9.6%
Whole state:
10.7%
Residents with income below 50% of the poverty level in 2022:
This zip code:
4.4%
Whole state:
5.7%
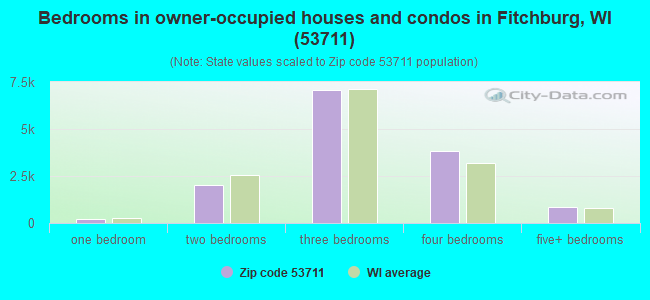
Median number of rooms in houses and condos:
Here:
7.0
State:
6.5
Median number of rooms in apartments:
Here:
3.8
State:
4.1
Notable locations in this zip code not listed on our city pages
6,921 married couples with children.
2,221 single-parent households (482 men, 1,739 women).
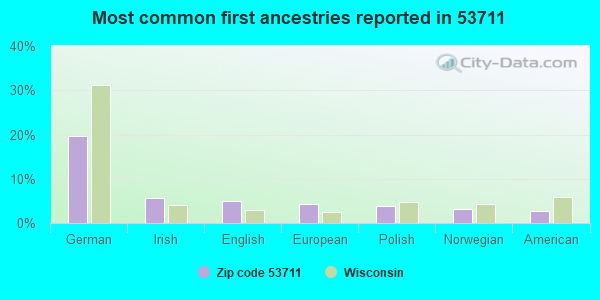
87.5% of residents of 53711 zip code speak English at home.
5.7% of residents speak Spanish at home (61% very well, 20% well, 14% not well, 6% not at all).
2.1% of residents speak other Indo-European language at home (74% very well, 21% well, 6% not well).
3.8% of residents speak Asian or Pacific Island language at home (48% very well, 43% well, 8% not well, 2% not at all).
1.1% of residents speak other language at home (51% very well, 8% well, 7% not well, 33% not at all).
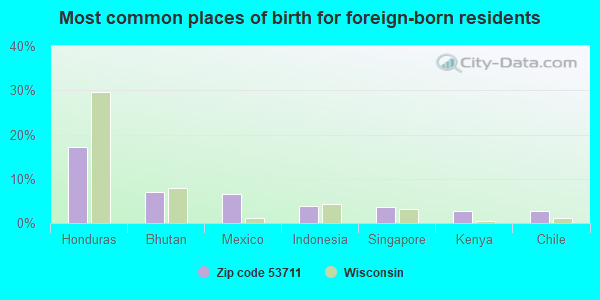
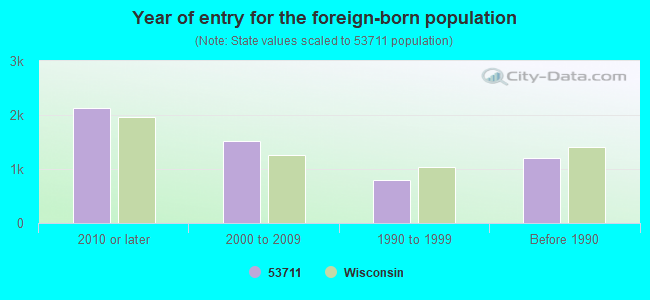
Foreign born population: 4,964 (10.0%) (46.2% of them are naturalized citizens)
Facilities with environmental interests located in this zip code:
BONE CARE INTERNATIONAL (ONE SCIENCE CT in MADISON, WI)
(Resource Conservation and Recovery Act (tracking hazardous waste)) STATE MASTER (Wisconsin database) - RCRAINFO-WIR000034520, CESQG
ADAMS OUTDOOR ADVERTISING (102 E BADGER RD in MADISON, WI)
Conditionally Exempt Small Quantity Generators, less than 100 kg/month of hazardous waste (Resource Conservation and Recovery Act (tracking hazardous waste)) - notification STATE MASTER (Wisconsin database) - RCRAINFO-WID023316680, CESQG Business SIC classification: OUTDOOR ADVERTISING SERVICES Organizations: HANSEN ADVERTISING CO (CONTACT/OWNER)
Alternative names: HANSEN ADVERTISING CO
ABNER BOILER & HEATING COMPANY (4301 W BELTLINE HWY in MADISON, WI)
(Integrated Compliance Information System) - ICIS-05-1990-0041, FORMAL ENFORCEMENT ACTION COMPLIANCE ACTIVITY (Tracking inspections of insecticide, fungicide, and rodenticide, and toxic substances) Business SIC classification: PLUMBING, HEATING AND AIR-CONDITIONING Alternative names: ABNER ASBESTOS REMOVAL INC
ALLIED DRIVE LEARNING CTR EL (2237 ALLIED DRIVE in MADISON, WI)
(National Center for Education Statistics) - STATE ID-0190 Organizations: MADISON METROPOLITAN SCH DIST (SCHOOL DISTRICT)
CHEROKEE HEIGHTS MID (4301 CHEROKEE DR in MADISON, WI)
(National Center for Education Statistics) - STATE ID-0090 Organizations: MADISON METROPOLITAN SCH DIST (SCHOOL DISTRICT)
(Resource Conservation and Recovery Act (tracking hazardous waste))
CARRIAGE TRADE CLEANERS (4577 W BELTLINE HWY NAKOMA PLA in MADISON, WI)
(Resource Conservation and Recovery Act (tracking hazardous waste)) Organizations: BROWN WILLIAM J (CONTACT/OWNER)
ADTEC LITHOGRAPHICS (2621 TODD DR in MADISON, WI)
(Resource Conservation and Recovery Act (tracking hazardous waste))
BEST CLEANERS OF MADISON (5704 RAYMOND RD in MADISON, WI)
(Resource Conservation and Recovery Act (tracking hazardous waste)) Organizations: JOHN WHITLEY (CONTACT/OWNER)
BROWNING FERRIS INDUSTRIES OF WISC (3083 HWY MM in MADISON, WI)
Conditionally Exempt Small Quantity Generators, less than 100 kg/month of hazardous waste (Resource Conservation and Recovery Act (tracking hazardous waste)) - notification
BUDDS UNION 76 STATION (2422 MONROE ST in MADISON, WI)
(Resource Conservation and Recovery Act (tracking hazardous waste))
Housing units lacking complete plumbing facilities: 0.1% Housing units lacking complete kitchen facilities: 0.4%
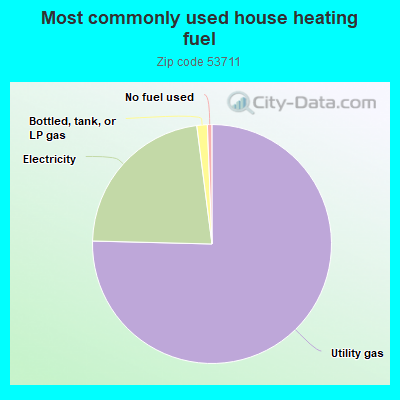
74.5%Utility gas
22.3%Electricity
1.4%Bottled, tank, or LP gas
0.6%No fuel used
Population in 1990: 42,198. Population change in the 1990s: +278 (+0.7%).
Place of birth for U.S.-born residents:
This state: 26,087
Northeast: 2,943
Midwest: 10,187
South: 2,890
West: 2,279
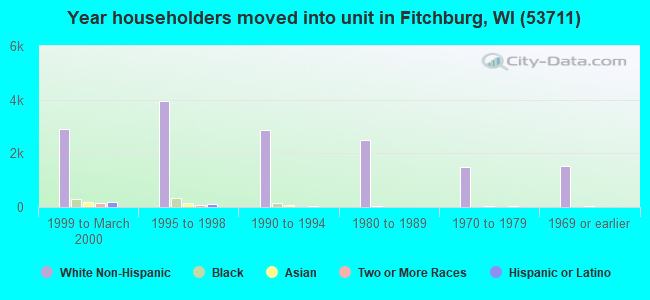
55% of the 53711 zip code residents lived in the same house 5 years ago. Out of people who lived in different houses, 64% lived in this county. Out of people who lived in different counties, 50% lived in Wisconsin.
88% of the 53711 zip code residents lived in the same house 1 year ago. Out of people who lived in different houses, 69% moved from this county. Out of people who lived in different houses, 6% moved from different county within same state. Out of people who lived in different houses, 18% moved from different state. Out of people who lived in different houses, 4% moved from abroad.
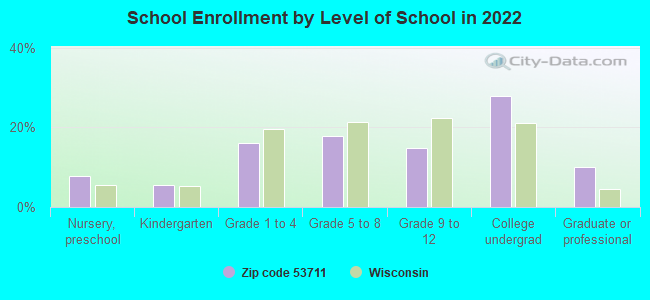
Private vs. public school enrollment:
Students in private schools in grades 1 to 8 (elementary and middle school): 973
Here:
25.3%
Wisconsin:
16.7%
Students in private schools in grades 9 to 12 (high school): 259
Here:
15.4%
Wisconsin:
12.5%
Students in private undergraduate colleges: 688
Here:
21.8%
Wisconsin:
17.5%
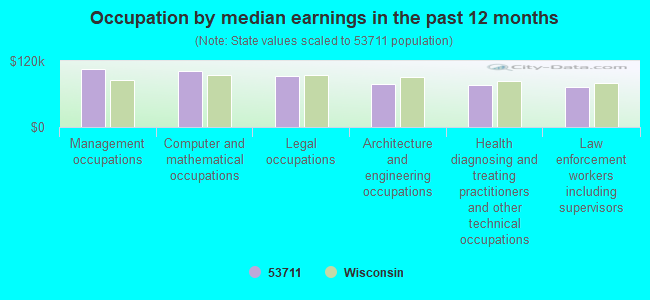
Occupation by median earnings in the past 12 months ($)
106,141Management occupations
102,475Computer and mathematical occupations
92,021Legal occupations
78,573Architecture and engineering occupations
77,101Health diagnosing and treating practitioners and other technical occupations
72,966Law enforcement workers including supervisors
Companies with biggest federal contracts located in this zip code:
THERMO ELECTRON SCIENTIFIC INS (5225 VERONA RD in MADISON, WI) : $18,620,122 in 593 contractsfrom 1999 to 2006
Contracts for Chemical Analysis Instruments, Optical Instruments, Test Equipment, Components and Accessories, Maintenance, Repair and Rebuilding of Equipment -- Instruments and Laboratory Equipment, Laboratory Equipment and Supplies, and moreby NASA, Navy, Federal Bureau of Investigation, Air Force, and others Signed by year:2000: $2,054,686; 2001: $3,016,275; 2002: $2,122,728; 2003: $1,731,607; 2004: $3,297,336; 2005: $4,662,934; 2006: $1,227,047.
Biggest contracts:
$45,329,000 with NASA for Chemical Analysis Instruments. Signed on 2002-08-15. Completion date: 2000-09-15.
$909,624 with Navy for Chemical Analysis Instruments. Signed on 2000-03-24. Completion date: 2000-09-30.
$399,015 with Federal Bureau of Investigation for Optical Instruments, Test Equipment, Components and Accessories. Signed on 2004-07-12. Completion date: 2004-08-30.
$355,898 with Air Force for Optical Instruments, Test Equipment, Components and Accessories. Signed on 2005-06-02. Completion date: 2005-08-31.
NICOLET INSTRUMENT TECHNOLOGIE (5225-4 VERONA ROAD in MADISON, WI; small business) : $3,823,466 in 86 contractsfrom 1999 to 2005
Contracts for Electrical and Electronic Properties Measuring and Testing Instruments, ADPE System Configuration, Miscellaneous Electrical and Electronic Components, ADP Components, and moreby Army, Navy, Air Force, Food and Drug Administration, and others Signed by year:2000: $1,425,041; 2001: $664,700; 2002: $442,942; 2003: $604,292; 2004: $578,050; 2005: $40,688; 2006: $0.
Biggest contracts:
$239,862 with Army for Electrical and Electronic Properties Measuring and Testing Instruments. Signed on 2000-05-15. Completion date: 2000-06-16.
$225,915 with Navy for Electrical and Electronic Properties Measuring and Testing Instruments. Signed on 2000-09-26. Completion date: 2000-10-30.
$208,509 with Navy for Electrical and Electronic Properties Measuring and Testing Instruments. Taking place in CA. Signed on 2001-03-23. Completion date: 2001-05-09.
$132,829 with Navy for Electrical and Electronic Properties Measuring and Testing Instruments. Signed on 2004-02-19. Completion date: 2004-03-25.
R&T MECHANICAL CONTRACTORS, IN (5629 CHERYL DR in MADISON, WI; small business) : $1,242,350 in 12 contractsfrom 2001 to 2005
Contracts for Maintenance, Repair or Alteration of Real Property -- Hospitals and Infirmaries, Maintenance, Repair or Alteration of Real Property -- Heating and Cooling Plants, Maintenance, Repair or Alteration of Real Property -- Airport Runways, Maintenance, Repair or Alteration of Real Property -- Miscellaneous Buildings, and moreby Department of Veterans Affairs, Navy, Air Force, Army, and others Signed by year:2000: $0; 2001: $143,144; 2002: $994,483; 2003: $78,850; 2004: $0; 2005: $25,873; 2006: $0.
Biggest contracts:
$579,000 with Department of Veterans Affairs for Maintenance, Repair or Alteration of Real Property -- Hospitals and Infirmaries. Signed on 2002-09-15. Completion date: 2003-05-15.
$194,984 with Navy for Maintenance, Repair or Alteration of Real Property -- Heating and Cooling Plants. Taking place in IL. Signed on 2002-06-06. Completion date: 2002-10-03.
$140,032 with Air Force for Maintenance, Repair or Alteration of Real Property -- Airport Runways. Signed on 2001-06-29. Completion date: 2001-10-29.
$97,774 with Air Force for Maintenance, Repair or Alteration of Real Property -- Miscellaneous Buildings. Signed on 2002-01-17. Completion date: 2002-05-01.
Dr. Harvey M. Jacobs (4629 Keating Terrace in Madison, WI; small business) : $126,448 in 4 contractsfrom 2004 to 2005
$47,900 with Offices, Boards and Divisions (includes Attorney General, Deputy Attorney General, etc.) for Expert Witness. Signed on 2004-02-01. Completion date: 2004-09-30.
$31,940, same as above.Signed on 2004-08-11. Completion date: 2006-08-10.
$31,488, same as above.Signed on 2004-09-16. Completion date: 2005-09-30.
$15,120, same as above.Signed on 2005-03-08. Completion date: 2007-03-07.
EYKHOLT CONSULTING (477 WOODSIDE TERRACE in MADISON, WI; small business) : $69,417 in 5 contractsfrom 2003 to 2005
Contracts for Maintenance, Repair or Alteration of Real Property -- Restoration of real property, Engineering and Technical Services by Army Signed by year:2000: $0; 2001: $0; 2002: $0; 2003: $24,000; 2004: $22,264; 2005: $23,153; 2006: $0.
Biggest contracts:
$24,000 with Army for Maintenance, Repair or Alteration of Real Property -- Restoration of real property. Signed on 2005-08-24. Completion date: 2005-08-31.
$24,000, same as above.Signed on 2004-08-26. Completion date: 2005-08-31.
$24,000 with Army for Engineering and Technical Services. Signed on 2003-09-03. Completion date: 2005-08-31.
-$847 with Army for Maintenance, Repair or Alteration of Real Property -- Restoration of real property. Signed on 2005-10-06. Completion date: 2005-08-31.
FINNIGAN CORPORATION (6416 SCHROEDER RD in MADISON, WI)
$57,949 with Army for Maintenance, Repair and Rebuilding of Equipment -- Instruments and Laboratory Equipment. Taking place in MD. Signed on 1999-11-19. Completion date: 2000-09-30.
SHAGBARK PROPERTIES (6510 SCHROEDER RD in MADISON, WI; small business)
$29,035 with Animal and Plant Health Inspection Service for Lease or Rental of Facilities -- Office Buildings. Signed on 2003-01-15. Completion date: 2007-12-15.
ABNER BOILER & HEATING COMPANY (4301 W BELTLINE HWY in MADISON, WI; small business) : $24,248 in 9 contractsfrom 2002 to 2003
Contracts for Other Housekeeping Services by Navy Signed by year:2000: $0; 2001: $0; 2002: $29,280; 2003: -$5,032; 2004: $0; 2005: $0; 2006: $0.
Biggest contracts:
$12,875 with Navy for Other Housekeeping Services. Signed on 2002-09-05. Completion date: 2002-09-30.
$12,602, same as above.Signed on 2002-11-07. Completion date: 2003-09-30.
$6,308, same as above.Signed on 2003-02-19. Completion date: 2003-09-30.
$3,803, same as above.Signed on 2002-12-04. Completion date: 2003-09-30.
PRISM COMPUTATIONAL SCIENCES I (455 SCIENCE DR STE 140 in MADISON, WI; small business) : $11,018 in 2 contractsfrom 2004 to 2005
$6,000 with NASA for Space Science and Applications -- Basic Research (R&D). Signed on 2004-02-10. Effective on 2004-02-15. Completion date: 2005-02-15.
$5,018 with Air Force for ADP Software. Signed on 2005-09-22. Completion date: 2005-10-07.
FIVEASH DATA MANAGEMENT, INC (417 BERWYN DR in MADISON, WI; small business)
$10,414 with Army for Laboratory Equipment and Supplies. Signed on 2004-09-14. Completion date: 2004-10-13.
Top industries in this zip code by the number of employees in 2005:
2003 - 2018 National Fire Incident Reporting System (NFIRS) incidents
Based on the data from the years 2003 - 2018 the average number of fire incidents per year is 70. The highest number of fires - 99 took place in 2011, and the least - 12 in 2004. The data has a rising trend.
When looking into fire subcategories, the most reports belonged to: Structure Fires (53.3%), and Outside Fires (27.3%).
Fire incident types reported to NFIRS in Zip Code 53711
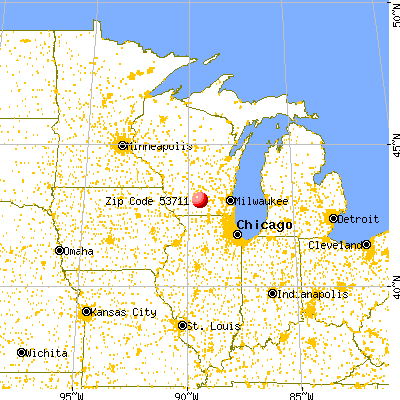


 Nearest zip codes: 53713, 53726, 53715, 53706, 53792, 53705.
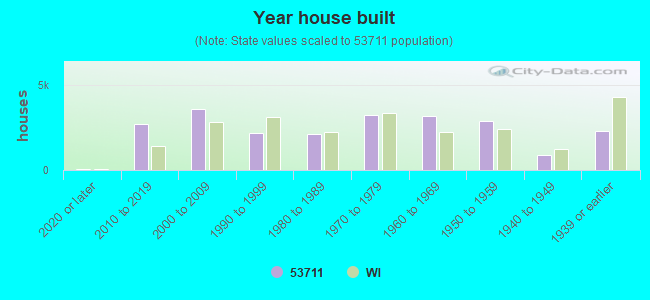


 Based on the data from the years 2003 - 2018 the average number of fire incidents per year is 70. The highest number of fires - 99 took place in 2011, and the least - 12 in 2004. The data has a rising trend.
 When looking into fire subcategories, the most reports belonged to: Structure Fires (53.3%), and Outside Fires (27.3%).