Estimated zip code population in 2022: 3,272 Zip code population in 2010: 3,096 Zip code population in 2000: 3,078
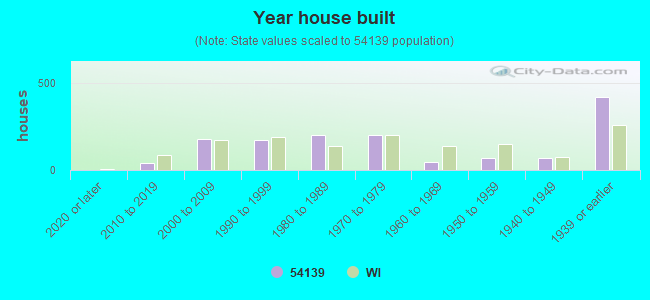
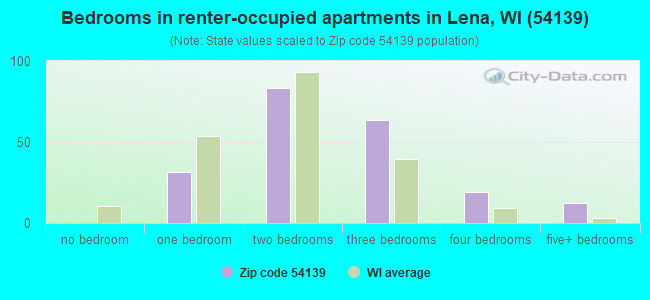
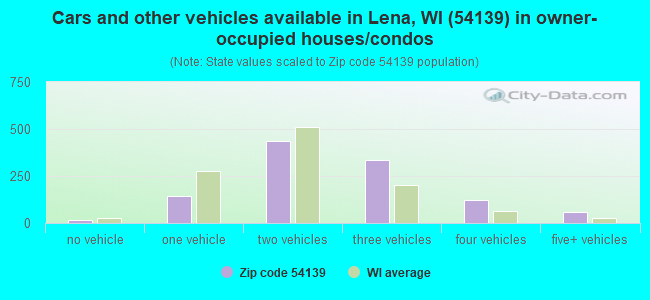
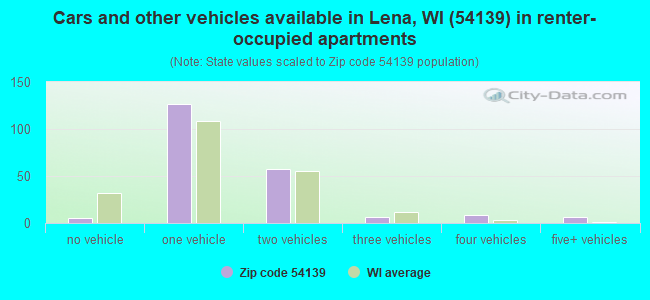
Houses and condos: 1,427 Renter-occupied apartments: 211
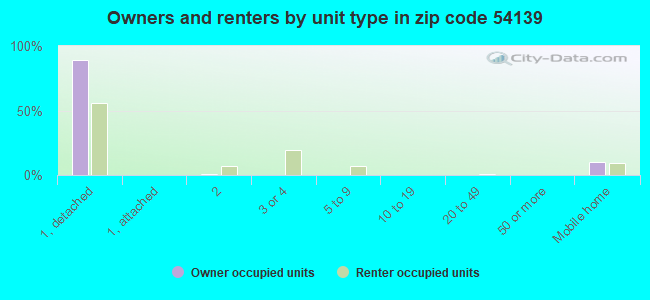
% of renters here:
16%
State:
32%
March 2022 cost of living index in zip code 54139: 85.7 (less than average, U.S. average is 100)
Land area: 95.8 sq. mi. Water area: 0.4 sq. mi.
Population density: 34 people per square mile
(very low).
OSM Map
General Map
Google Map
MSN Map
OSM Map
General Map
Google Map
MSN Map
OSM Map
General Map
Google Map
MSN Map
OSM Map
General Map
Google Map
MSN Map
Please wait while loading the map...
Real estate property taxes paid for housing units in 2022:
This zip code:
1.2% ($2,208)
Wisconsin:
1.4% ($3,497)
Median real estate property taxes paid for housing units with mortgages in 2022: $2,348 (1.1%) Median real estate property taxes paid for housing units with no mortgage in 2022: $2,087 (1.3%)
Business Search- 14 Million verified businesses
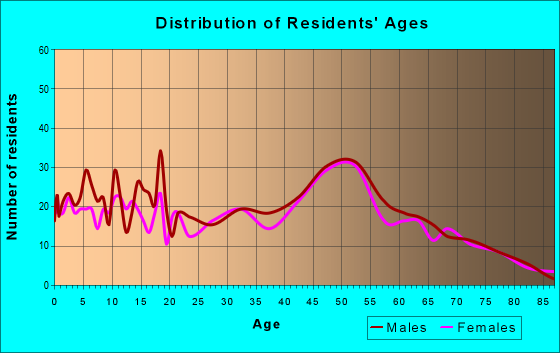
Males: 1,830
(55.9%)
Females: 1,443
(44.1%)
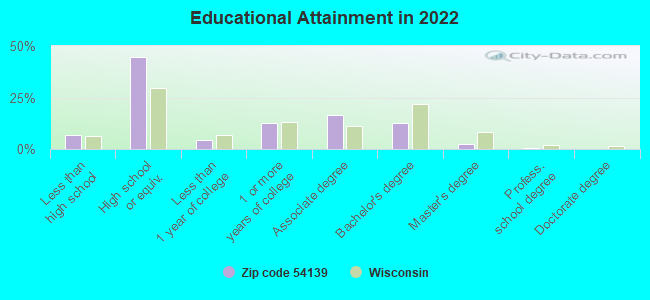
For population 25 years and over in 54139:
High school or higher: 92.2%
Bachelor's degree or higher: 15.3%
Graduate or professional degree: 3.0%
Unemployed: 2.4%
Mean travel time to work (commute): 25.7 minutes
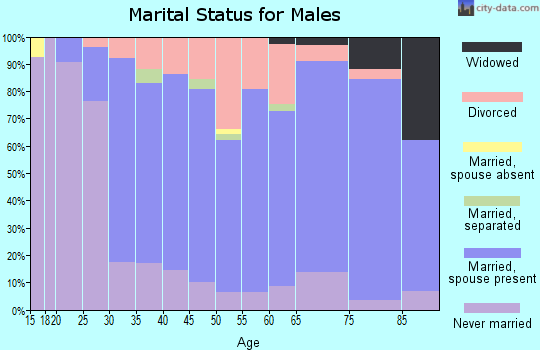
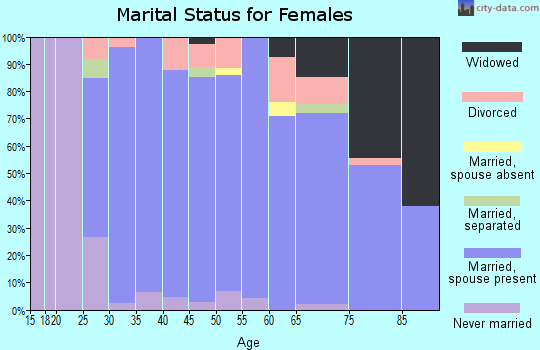
For population 15 years and over in 54139:
Never married: 24.5%
Now married: 58.4%
Separated: 1.2%
Widowed: 4.7%
Divorced: 11.1%
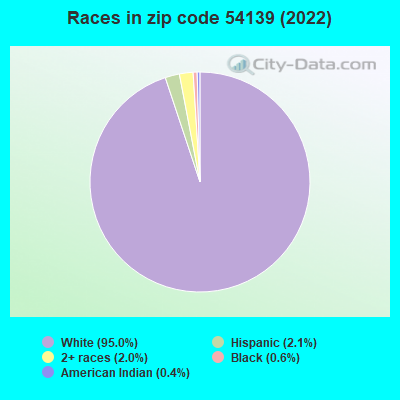
Zip code 54139 compared to state average:
Black race population percentage significantly below state average.
Hispanic race population percentage significantly below state average.
Median age above state average.
Foreign-born population percentage significantly below state average.
Renting percentage below state average.
Length of stay since moving in significantly above state average.
Number of college students below state average.
Percentage of population with a bachelor's degree or higher below state average.
Averages for the 2020 tax year for zip code 54139, filed in 2021:
Average Adjusted Gross Income (AGI) in 2020: $58,703 (Individual Income Tax Returns)
Here:
$58,703
State:
$72,319
Salary/wage: $52,267 (reported on 82.4% of returns)
Here:
$52,267
State:
$59,242
(% of AGI for various income ranges: 1277.0% for AGIs below $25k, 3875.3% for AGIs $25k-50k, 6815.7% for AGIs $50k-75k, 9266.2% for AGIs $75k-100k, 18810.8% for AGIs $100k-200k)
Taxable interest for individuals: $1,142 (reported on 37.1% of returns)
This zip code:
$1,142
Wisconsin:
$1,431
(% of AGI for various income ranges: 27.8% for AGIs below $25k, 31.7% for AGIs $25k-50k, 41.0% for AGIs $50k-75k, 126.9% for AGIs $75k-100k, 86.7% for AGIs $100k-200k)
Ordinary dividends: $2,265 (reported on 19.5% of returns)
Here:
$2,265
State:
$6,481
(% of AGI for various income ranges: 42.2% for AGIs below $25k, 21.7% for AGIs $25k-50k, 32.4% for AGIs $50k-75k, 76.2% for AGIs $75k-100k, 296.7% for AGIs $100k-200k)
Net capital gain/loss in AGI: +$7,914 (reported on 18.2% of returns)
Here:
+$7,914
State:
+$18,329
(% of AGI for various income ranges: 38.5% for AGIs below $25k, 52.7% for AGIs $25k-50k, 206.7% for AGIs $50k-75k, 166.9% for AGIs $75k-100k, 1151.7% for AGIs $100k-200k)
Profit/loss from business: +$10,226 (reported on 11.9% of returns)
Here:
+$10,226
State:
+$14,562
(% of AGI for various income ranges: 75.9% for AGIs below $25k, 95.7% for AGIs $25k-50k, 85.7% for AGIs $50k-75k, 450.0% for AGIs $75k-100k, 571.7% for AGIs $100k-200k)
Taxable individual retirement arrangement distribution: $14,514 (reported on 13.2% of returns)
54139:
$14,514
Wisconsin:
$19,348
(% of AGI for various income ranges: 138.5% for AGIs below $25k, 187.7% for AGIs $25k-50k, 225.7% for AGIs $50k-75k, 601.5% for AGIs $75k-100k, 712.5% for AGIs $100k-200k)
Total itemized deductions: $25,400 (reported on 3.1% of returns)
Here:
$25,400
State:
$33,000
(% of AGI for various income ranges: 324.3% for AGIs $50k-75k, 490.8% for AGIs $100k-200k)
Charity contributions: $2,850 (reported on 2.5% of returns)
Here:
$2,850
State:
$12,044
(% of AGI for various income ranges: 87.7% for AGIs $75k-100k)
Taxes paid: $7,940 (reported on 3.1% of returns)
54139:
$7,940
State:
$8,228
(% of AGI for various income ranges: 86.7% for AGIs $50k-75k, 179.2% for AGIs $100k-200k)
Earned income credit: $2,193 (reported on 9.4% of returns)
Here:
$2,193
State:
$2,155
(% of AGI for various income ranges: 65.9% for AGIs below $25k, 50.3% for AGIs $25k-50k)
Percentage of individuals using paid preparers for their 2020 taxes: 95.6%
Here:
96%
State:
94%
(% for various income ranges: 95.6% for AGIs below $25k, 95.0% for AGIs $25k-50k, 96.6% for AGIs $50k-75k, 95.0% for AGIs $75k-100k, 95.5% for AGIs $100k-200k, 100.0% for AGIs over 200k)
Averages for the 2012 tax year for zip code 54139, filed in 2013:
Average Adjusted Gross Income (AGI) in 2012: $47,274 (Individual Income Tax Returns)
Here:
$47,274
State:
$57,939
Salary/wage: $41,893 (reported on 85.5% of returns)
Here:
$41,893
State:
$48,248
(% of AGI for various income ranges: 67.7% for AGIs below $25k, 81.9% for AGIs $25k-50k, 79.0% for AGIs $50k-75k, 77.4% for AGIs $75k-100k, 69.1% for AGIs $100k-200k)
Taxable interest for individuals: $883 (reported on 43.4% of returns)
This zip code:
$883
Wisconsin:
$1,224
(% of AGI for various income ranges: 2.4% for AGIs below $25k, 0.9% for AGIs $25k-50k, 0.7% for AGIs $50k-75k, 0.5% for AGIs $75k-100k, 0.5% for AGIs $100k-200k)
Ordinary dividends: $1,394 (reported on 20.4% of returns)
Here:
$1,394
State:
$5,137
(% of AGI for various income ranges: 1.5% for AGIs below $25k, 0.6% for AGIs $25k-50k, 0.7% for AGIs $50k-75k, 0.3% for AGIs $75k-100k, 0.4% for AGIs $100k-200k)
Net capital gain/loss in AGI: +$9,374 (reported on 17.8% of returns)
Here:
+$9,374
State:
+$11,137
(% of AGI for various income ranges: 1.4% for AGIs below $25k, 1.0% for AGIs $25k-50k, 1.4% for AGIs $50k-75k, 3.0% for AGIs $75k-100k, 8.6% for AGIs $100k-200k)
Profit/loss from business: +$10,742 (reported on 12.5% of returns)
Here:
+$10,742
State:
+$11,943
(% of AGI for various income ranges: 6.2% for AGIs below $25k, 2.9% for AGIs $25k-50k, 2.2% for AGIs $50k-75k, 1.9% for AGIs $75k-100k, 3.1% for AGIs $100k-200k)
Taxable individual retirement arrangement distribution: $10,700 (reported on 11.8% of returns)
54139:
$10,700
Wisconsin:
$14,087
(% of AGI for various income ranges: 5.3% for AGIs below $25k, 2.6% for AGIs $25k-50k, 1.7% for AGIs $50k-75k, 6.7% for AGIs $75k-100k)
Total itemized deductions: $17,176 (23% of AGI, reported on 32.9% of returns)
Here:
$17,176
State:
$22,257
Here:
22.7% of AGI
State:
20.1% of AGI
(% of AGI for various income ranges: 7.7% for AGIs below $25k, 10.7% for AGIs $25k-50k, 12.8% for AGIs $50k-75k, 13.4% for AGIs $75k-100k, 12.6% for AGIs $100k-200k)
Charity contributions: $1,909 (reported on 23.0% of returns)
Here:
$1,909
State:
$3,370
(% of AGI for various income ranges: 0.8% for AGIs below $25k, 0.8% for AGIs $25k-50k, 0.8% for AGIs $50k-75k, 0.8% for AGIs $75k-100k, 1.2% for AGIs $100k-200k)
Taxes paid: $7,180 (reported on 32.9% of returns)
54139:
$7,180
State:
$10,731
(% of AGI for various income ranges: 1.6% for AGIs below $25k, 3.3% for AGIs $25k-50k, 4.9% for AGIs $50k-75k, 5.9% for AGIs $75k-100k, 7.0% for AGIs $100k-200k)
Earned income credit: $1,775 (reported on 13.2% of returns)
Here:
$1,775
State:
$2,094
(% of AGI for various income ranges: 3.5% for AGIs below $25k, 0.9% for AGIs $25k-50k)
Percentage of individuals using paid preparers for their 2012 taxes: 67.8%
Here:
68%
State:
54%
(% for various income ranges: 62.7% for AGIs below $25k, 68.2% for AGIs $25k-50k, 71.4% for AGIs $50k-75k, 75.0% for AGIs $75k-100k, 69.2% for AGIs $100k-200k)
Averages for the 2004 tax year for zip code 54139, filed in 2005:
Average Adjusted Gross Income (AGI) in 2004: $36,363 (Individual Income Tax Returns)
Here:
$36,363
State:
$47,735
Salary/wage: $34,526 (reported on 85.5% of returns)
Here:
$34,526
State:
$41,540
(% of AGI for various income ranges: 134.4% for AGIs below $10k, 72.8% for AGIs $10k-25k, 85.4% for AGIs $25k-50k, 87.0% for AGIs $50k-75k, 78.9% for AGIs $75k-100k, 62.7% for AGIs over 100k)
Taxable interest for individuals: $1,138 (reported on 49.3% of returns)
This zip code:
$1,138
Wisconsin:
$1,420
(% of AGI for various income ranges: 11.8% for AGIs below $10k, 4.8% for AGIs $10k-25k, 1.2% for AGIs $25k-50k, 0.6% for AGIs $50k-75k, 0.3% for AGIs $75k-100k, 2.0% for AGIs over 100k)
Taxable dividends: $935 (reported on 21.6% of returns)
Here:
$935
State:
$2,869
(% of AGI for various income ranges: 3.6% for AGIs below $10k, 1.1% for AGIs $10k-25k, 0.3% for AGIs $25k-50k, 0.3% for AGIs $50k-75k, 0.3% for AGIs $75k-100k, 1.0% for AGIs over 100k)
Net capital gain/loss: +$5,452 (reported on 19.0% of returns)
Here:
+$5,452
State:
+$9,569
(% of AGI for various income ranges: 7.2% for AGIs below $10k, 2.7% for AGIs $10k-25k, 1.2% for AGIs $25k-50k, 1.9% for AGIs $50k-75k, 2.4% for AGIs $75k-100k, 8.7% for AGIs over 100k)
Profit/loss from business: +$6,457 (reported on 13.2% of returns)
Here:
+$6,457
State:
+$10,417
(% of AGI for various income ranges: -13.3% for AGIs below $10k, 5.8% for AGIs $10k-25k, 3.3% for AGIs $25k-50k, 2.1% for AGIs $50k-75k, 1.7% for AGIs $75k-100k, 0.6% for AGIs over 100k)
IRA payment deduction: $2,808 (reported on 4.6% of returns)
54139:
$2,808
Wisconsin:
$2,900
Total itemized deductions: $14,603 (24% of AGI, reported on 32.4% of returns)
Here:
$14,603
State:
$18,160
Here:
24.5% of AGI
State:
21.1% of AGI
(% of AGI for various income ranges: 17.3% for AGIs below $10k, 11.0% for AGIs $10k-25k, 11.4% for AGIs $25k-50k, 14.0% for AGIs $50k-75k, 15.9% for AGIs $75k-100k, 12.3% for AGIs over 100k)
Charity contributions deductions: $1,416 (2% of AGI, reported on 27.6% of returns)
Here:
$1,416
State:
$2,711
Here:
2.3% of AGI
State:
3.0% of AGI
(% of AGI for various income ranges: 1.0% for AGIs $10k-25k, 0.8% for AGIs $25k-50k, 1.2% for AGIs $50k-75k, 1.4% for AGIs $75k-100k, 1.4% for AGIs over 100k)
Total tax: $4,140 (reported on 75.6% of returns)
54139:
$4,140
State:
$7,114
(% of AGI for various income ranges: 5.5% for AGIs below $10k, 4.7% for AGIs $10k-25k, 6.9% for AGIs $25k-50k, 7.8% for AGIs $50k-75k, 10.4% for AGIs $75k-100k, 15.7% for AGIs over 100k)
Earned income credit: $1,386 (reported on 11.2% of returns)
Here:
$1,386
State:
$1,544
Percentage of individuals using paid preparers for their 2004 taxes: 71.1%
Here:
71%
State:
57%
(% for various income ranges: 66.7% for AGIs below $10k, 70.9% for AGIs $10k-25k, 69.7% for AGIs $25k-50k, 75.4% for AGIs $50k-75k, 78.5% for AGIs $75k-100k, 77.8% for AGIs over 100k)
Household received Food Stamps/SNAP in the past 12 months: 70 Household did not receive Food Stamps/SNAP in the past 12 months: 1,251
Women who had a birth in the past 12 months: 40 (35 now married, 4 unmarried) Women who did not have a birth in the past 12 months: 581 (288 now married, 293 unmarried)
Housing units in zip code 54139 with a mortgage: 513 (43 second mortgage, 36 both second mortgage and home equity loan) Houses without a mortgage: 6
Median monthly owner costs for units with a mortgage: $1,333 Median monthly owner costs for units without a mortgage: $485
Residents with income below the poverty level in 2022:
This zip code:
7.1%
Whole state:
10.7%
Residents with income below 50% of the poverty level in 2022:
This zip code:
3.4%
Whole state:
5.7%
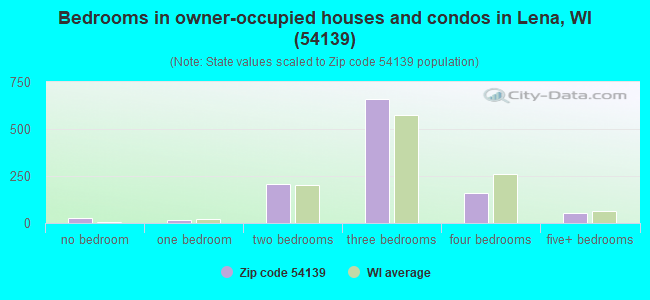
Median number of rooms in houses and condos:
Here:
6.0
State:
6.5
Median number of rooms in apartments:
Here:
4.9
State:
4.1
Notable locations in this zip code not listed on our city pages
Cemeteries: Sacred Heart Cemetery (1), Saint Charles Cemetery (2), Kelly Brook Cemetery (3), Pine Hill Cemetery (4), Lena Cemetery (5). Display/hide their locations on the map
Size of family households: 504 2-persons, 148 3-persons, 161 4-persons, 102 5-persons, 19 6-persons, 4 7-or-more-persons
Size of nonfamily households: 312 1-person, 68 2-persons, 5 3-persons
494 married couples with children.
217 single-parent households (171 men, 46 women).
98.4% of residents of 54139 zip code speak English at home.
1.3% of residents speak Spanish at home (39% very well, 20% well, 41% not well).
0.3% of residents speak other Indo-European language at home (100% very well).
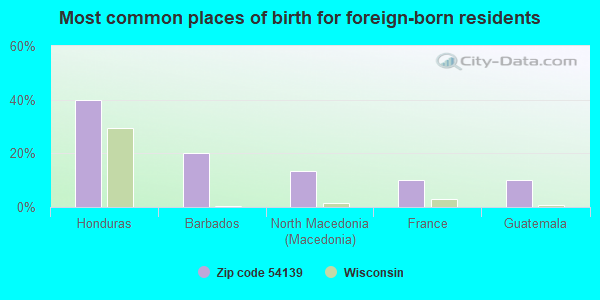
Foreign born population: 30 (0.9%) (45.2% of them are naturalized citizens)
This zip code:
0.9%
Whole state:
5.0%
40%Honduras
20%Barbados
13%North Macedonia (Macedonia)
10%France
10%Guatemala
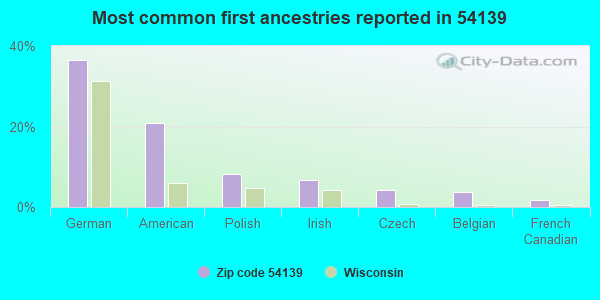
37%German
21%American
8%Polish
7%Irish
4%Czech
4%Belgian
2%French Canadian
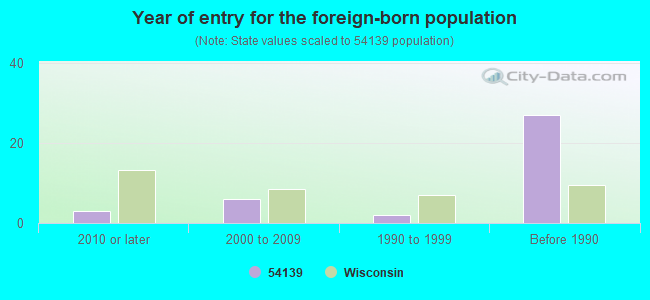
Year of entry for the foreign-born population
32010 or later
62000 to 2009
21990 to 1999
27Before 1990
Facilities with environmental interests located in this zip code:
ANTIQUE AUTOMOTIVE (5631 HWY 22 in LENA, WI)
Conditionally Exempt Small Quantity Generators, less than 100 kg/month of hazardous waste (Resource Conservation and Recovery Act (tracking hazardous waste)) - notification STATE MASTER (Wisconsin database) - RCRAINFO-WID988617122, CESQG, HAZARDOUS WASTE PROGRAM Organizations: MCGRAY LAWRENCE (CONTACT/OWNER)
Housing units lacking complete plumbing facilities: 1.5% Housing units lacking complete kitchen facilities: 3.1%
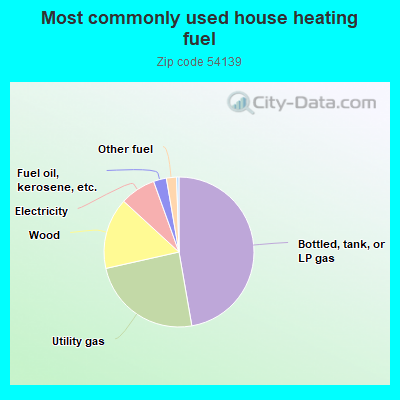
47.4%Bottled, tank, or LP gas
24.3%Utility gas
15.4%Wood
7.7%Electricity
2.8%Fuel oil, kerosene, etc.
2.2%Other fuel
0.5%No fuel used
Population in 1990: 2,684. Population change in the 1990s: +394 (+14.7%).
Place of birth for U.S.-born residents:
This state: 2,834
Northeast: 35
Midwest: 233
South: 28
West: 90
69% of the 54139 zip code residents lived in the same house 5 years ago. Out of people who lived in different houses, 59% lived in this county. Out of people who lived in different counties, 50% lived in Wisconsin.
96% of the 54139 zip code residents lived in the same house 1 year ago. Out of people who lived in different houses, 48% moved from this county. Out of people who lived in different houses, 32% moved from different county within same state. Out of people who lived in different houses, 24% moved from different state.
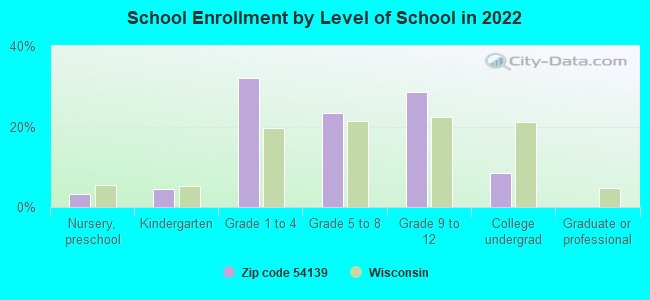
Private vs. public school enrollment:
Students in private schools in grades 1 to 8 (elementary and middle school): 51
Here:
14.2%
Wisconsin:
16.7%
Students in private schools in grades 9 to 12 (high school): 16
Here:
8.7%
Wisconsin:
12.5%
Students in private undergraduate colleges: 13
Here:
23.6%
Wisconsin:
17.5%
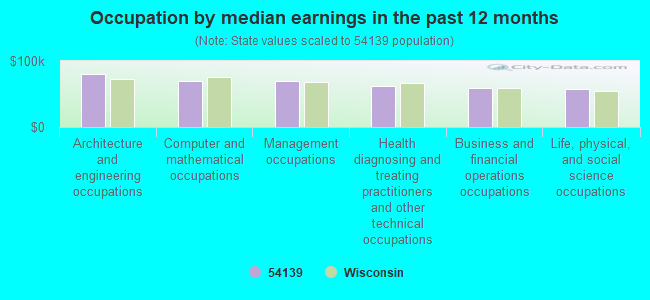
Occupation by median earnings in the past 12 months ($)
79,884Architecture and engineering occupations
70,412Computer and mathematical occupations
69,066Management occupations
61,719Health diagnosing and treating practitioners and other technical occupations
58,674Business and financial operations occupations
57,555Life, physical, and social science occupations
Top industries in this zip code by the number of employees in 2005:
Health Care and Social Assistance: Residential Mental Retardation Facilities (100-249 employees: 1 establishment)
Accommodation and Food Services: Full-Service Restaurants (10-19: 3)
Construction: Commercial and Institutional Building Construction (10-19: 1, 1-4: 2)
Construction: Site Preparation Contractors (10-19: 1, 1-4: 1)
Health Care and Social Assistance: All Other Outpatient Care Centers (10-19: 1, 1-4: 1)
Other Services (except Public Administration): Religious Organizations (5-9: 2, 1-4: 1)
Finance and Insurance: Direct Property and Casualty Insurance Carriers (10-19: 1)
Other Services (except Public Administration): Labor Unions and Similar Labor Organizations (10-19: 1)
People in group quarters in 2000:
8 people in other noninstitutional group quarters
Fatal accident statistics in 2013:
Fatal accident count: 1
Vehicles involved in fatal accidents: 1
Fatal accidents caused by drunken drivers: 1
Fatalities: 1
Persons involved in fatal accidents: 1
Pedestrians involved in fatal accidents: 0
Fatal accident statistics in 2010:
Fatal accident count: 1
Vehicles involved in fatal accidents: 2
Fatal accidents caused by drunken drivers: 1
Fatalities: 1
Persons involved in fatal accidents: 3
Pedestrians involved in fatal accidents: 0
Home Mortgage Disclosure Act Aggregated Statistics For Year 2009 (Based on 8 partial tracts)
A) FHA, FSA/RHS & VA Home Purchase Loans
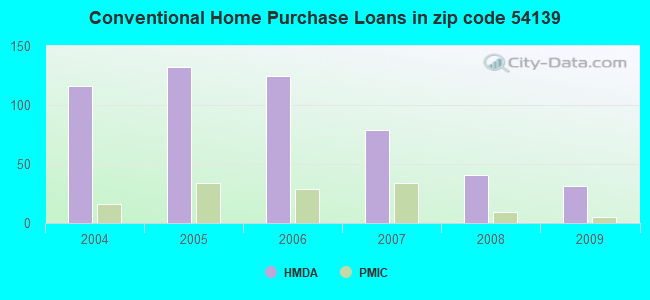
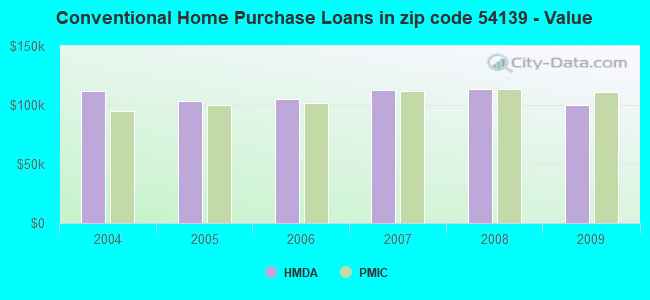
B) Conventional Home Purchase Loans
C) Refinancings
D) Home Improvement Loans
F) Non-occupant Loans on < 5 Family Dwellings (A B C & D)
G) Loans On Manufactured Home Dwelling (A B C & D)
Number
Average Value
Number
Average Value
Number
Average Value
Number
Average Value
Number
Average Value
Number
Average Value
LOANS ORIGINATED
19
$103,653
31
$100,400
246
$139,928
18
$49,185
31
$148,119
9
$73,026
APPLICATIONS APPROVED, NOT ACCEPTED
0
$0
1
$22,650
26
$168,311
4
$16,110
3
$165,360
0
$0
APPLICATIONS DENIED
5
$133,300
7
$78,360
93
$135,199
6
$53,873
11
$143,476
10
$144,239
APPLICATIONS WITHDRAWN
0
$0
3
$131,600
37
$142,769
1
$57,600
4
$133,238
1
$110,070
FILES CLOSED FOR INCOMPLETENESS
0
$0
0
$0
8
$89,750
0
$0
2
$36,615
0
$0
Aggregated Statistics For Year 2008 (Based on 8 partial tracts)
A) FHA, FSA/RHS & VA Home Purchase Loans
B) Conventional Home Purchase Loans
C) Refinancings
D) Home Improvement Loans
E) Loans on Dwellings For 5+ Families
F) Non-occupant Loans on < 5 Family Dwellings (A B C & D)
G) Loans On Manufactured Home Dwelling (A B C & D)
Number
Average Value
Number
Average Value
Number
Average Value
Number
Average Value
Number
Average Value
Number
Average Value
Number
Average Value
LOANS ORIGINATED
13
$95,082
41
$113,658
161
$119,494
35
$41,489
1
$175,820
24
$119,262
15
$91,209
APPLICATIONS APPROVED, NOT ACCEPTED
1
$121,950
5
$70,466
45
$110,737
5
$39,278
0
$0
7
$81,696
4
$129,538
APPLICATIONS DENIED
6
$99,218
10
$67,256
103
$126,341
11
$78,243
0
$0
9
$111,413
16
$101,962
APPLICATIONS WITHDRAWN
1
$102,210
3
$112,080
28
$165,839
1
$11,280
0
$0
4
$152,182
2
$78,845
FILES CLOSED FOR INCOMPLETENESS
1
$189,920
2
$190,470
3
$150,357
1
$132,940
0
$0
0
$0
0
$0
Aggregated Statistics For Year 2007 (Based on 8 partial tracts)
A) FHA, FSA/RHS & VA Home Purchase Loans
B) Conventional Home Purchase Loans
C) Refinancings
D) Home Improvement Loans
F) Non-occupant Loans on < 5 Family Dwellings (A B C & D)
G) Loans On Manufactured Home Dwelling (A B C & D)
Number
Average Value
Number
Average Value
Number
Average Value
Number
Average Value
Number
Average Value
Number
Average Value
LOANS ORIGINATED
6
$95,492
79
$112,764
231
$121,512
36
$35,391
41
$108,167
19
$88,496
APPLICATIONS APPROVED, NOT ACCEPTED
0
$0
12
$88,441
49
$116,156
5
$16,710
4
$71,762
4
$130,795
APPLICATIONS DENIED
2
$73,745
27
$102,201
154
$126,443
13
$53,879
10
$93,697
12
$117,759
APPLICATIONS WITHDRAWN
2
$43,780
4
$67,838
46
$114,895
5
$58,348
3
$165,873
4
$91,985
FILES CLOSED FOR INCOMPLETENESS
0
$0
1
$89,750
18
$121,859
1
$173,700
0
$0
0
$0
Aggregated Statistics For Year 2006 (Based on 8 partial tracts)
A) FHA, FSA/RHS & VA Home Purchase Loans
B) Conventional Home Purchase Loans
C) Refinancings
D) Home Improvement Loans
E) Loans on Dwellings For 5+ Families
F) Non-occupant Loans on < 5 Family Dwellings (A B C & D)
G) Loans On Manufactured Home Dwelling (A B C & D)
Number
Average Value
Number
Average Value
Number
Average Value
Number
Average Value
Number
Average Value
Number
Average Value
Number
Average Value
LOANS ORIGINATED
5
$96,940
125
$105,302
253
$98,813
62
$39,217
0
$0
53
$93,103
30
$54,434
APPLICATIONS APPROVED, NOT ACCEPTED
2
$107,970
10
$95,634
36
$94,257
7
$20,593
0
$0
2
$93,020
5
$52,598
APPLICATIONS DENIED
2
$63,870
23
$82,055
136
$109,427
26
$38,571
2
$362,180
10
$92,259
10
$86,472
APPLICATIONS WITHDRAWN
0
$0
10
$73,404
76
$116,339
7
$101,519
0
$0
3
$116,667
3
$55,990
FILES CLOSED FOR INCOMPLETENESS
0
$0
1
$184,910
21
$121,183
0
$0
0
$0
0
$0
1
$67,730
Aggregated Statistics For Year 2005 (Based on 8 partial tracts)
A) FHA, FSA/RHS & VA Home Purchase Loans
B) Conventional Home Purchase Loans
C) Refinancings
D) Home Improvement Loans
E) Loans on Dwellings For 5+ Families
F) Non-occupant Loans on < 5 Family Dwellings (A B C & D)
G) Loans On Manufactured Home Dwelling (A B C & D)
Number
Average Value
Number
Average Value
Number
Average Value
Number
Average Value
Number
Average Value
Number
Average Value
Number
Average Value
LOANS ORIGINATED
7
$104,393
132
$103,801
327
$112,736
62
$84,602
1
$77,900
37
$136,444
32
$61,467
APPLICATIONS APPROVED, NOT ACCEPTED
2
$184,670
13
$85,517
37
$93,711
9
$31,663
0
$0
3
$29,457
1
$127,740
APPLICATIONS DENIED
2
$76,190
27
$135,617
143
$117,145
20
$57,986
0
$0
8
$73,779
15
$95,087
APPLICATIONS WITHDRAWN
0
$0
11
$113,885
70
$135,130
10
$99,212
0
$0
4
$175,215
7
$91,324
FILES CLOSED FOR INCOMPLETENESS
0
$0
3
$143,463
34
$148,418
1
$56,360
0
$0
0
$0
1
$77,130
Aggregated Statistics For Year 2004 (Based on 8 partial tracts)
A) FHA, FSA/RHS & VA Home Purchase Loans
B) Conventional Home Purchase Loans
C) Refinancings
D) Home Improvement Loans
F) Non-occupant Loans on < 5 Family Dwellings (A B C & D)
G) Loans On Manufactured Home Dwelling (A B C & D)
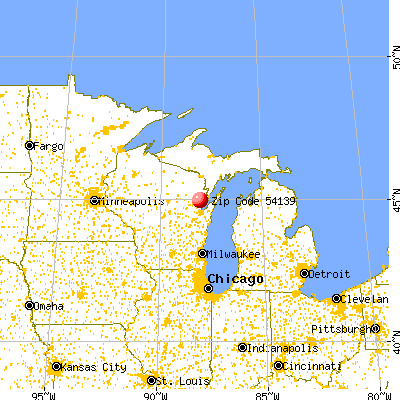


 Nearest zip codes: 54112, 54154, 54153, 54101, 54161, 54141.