Estimated zip code population in 2022: 5,400 Zip code population in 2010: 4,903 Zip code population in 2000: 4,696
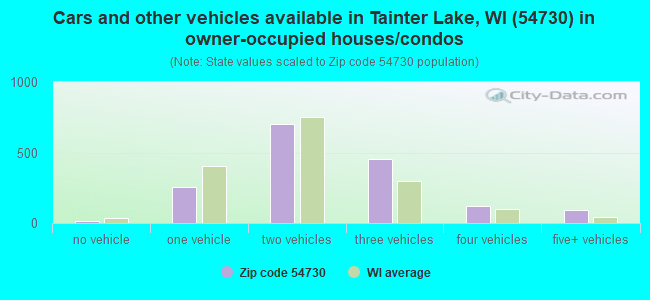
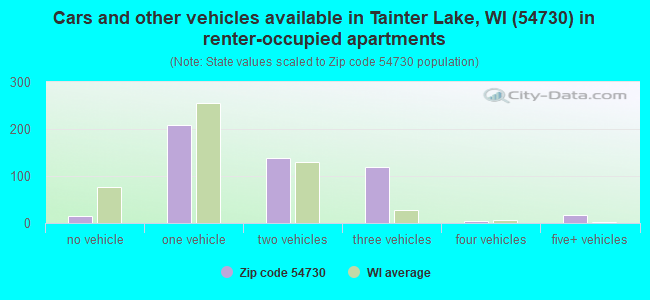
Houses and condos: 2,386 Renter-occupied apartments: 504
% of renters here:
23%
State:
32%
March 2022 cost of living index in zip code 54730: 86.1 (less than average, U.S. average is 100)
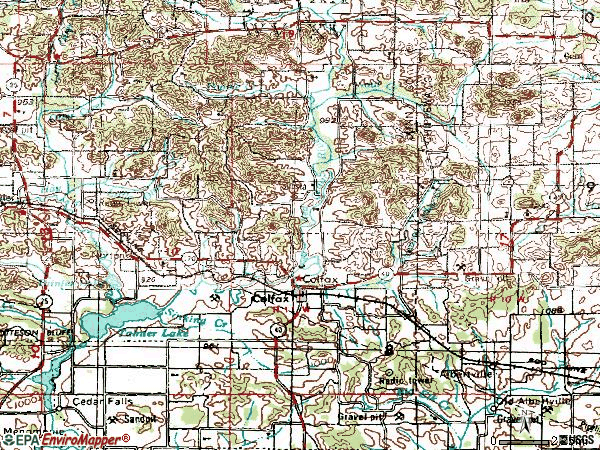
Land area: 139.0 sq. mi. Water area: 3.4 sq. mi.
Population density: 39 people per square mile
(very low).
OSM Map
General Map
Google Map
MSN Map
OSM Map
General Map
Google Map
MSN Map
OSM Map
General Map
Google Map
MSN Map
OSM Map
General Map
Google Map
MSN Map
Please wait while loading the map...
Real estate property taxes paid for housing units in 2022:
This zip code:
1.3% ($2,939)
Wisconsin:
1.4% ($3,497)
Median real estate property taxes paid for housing units with mortgages in 2022: $2,822 (1.2%) Median real estate property taxes paid for housing units with no mortgage in 2022: $3,202 (1.3%)
Business Search- 14 Million verified businesses
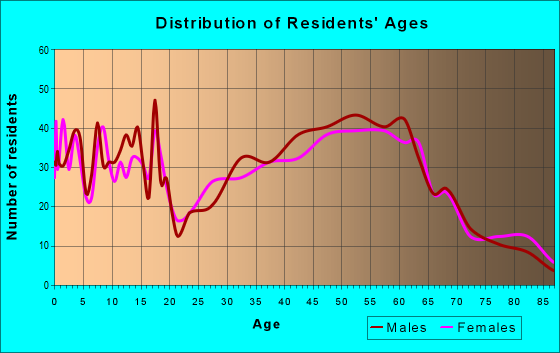
Males: 2,836
(52.5%)
Females: 2,564
(47.5%)
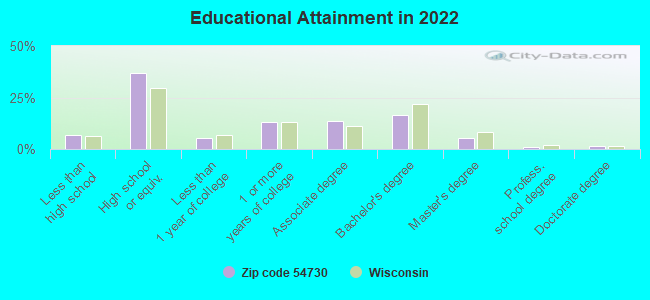
For population 25 years and over in 54730:
High school or higher: 92.6%
Bachelor's degree or higher: 24.3%
Graduate or professional degree: 8.0%
Unemployed: 3.0%
Mean travel time to work (commute): 26.4 minutes
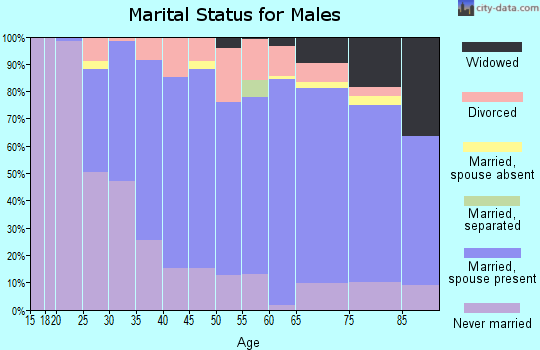
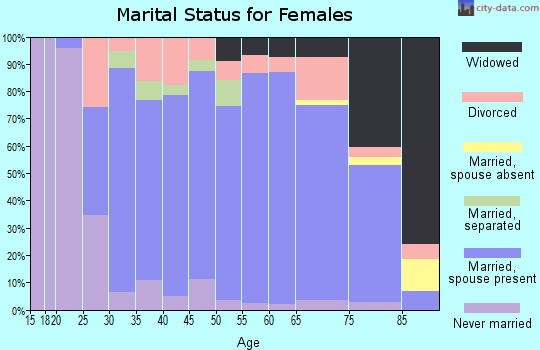
For population 15 years and over in 54730:
Never married: 27.8%
Now married: 52.1%
Separated: 0.9%
Widowed: 5.9%
Divorced: 13.3%
Zip code 54730 compared to state average:
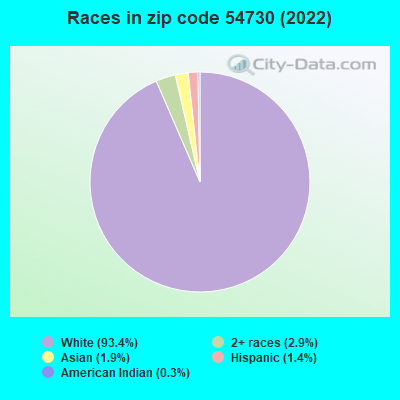
Black race population percentage significantly below state average.
Hispanic race population percentage significantly below state average.
Foreign-born population percentage below state average.
Length of stay since moving in significantly above state average.
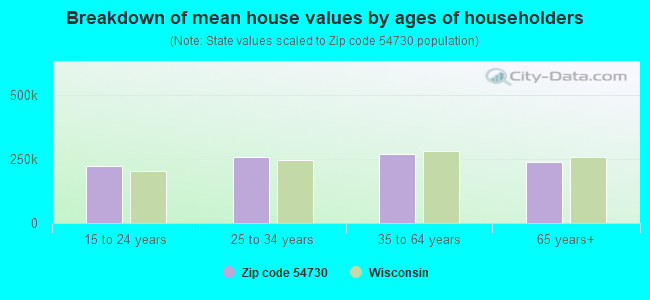
Estimated median house/condo value in 2022: $229,312
54730:
$229,312
Wisconsin:
$252,800
According to our research of Wisconsin and other state lists, there were 11 registered sex offenders living in 54730 zip code as of April 27, 2024. The ratio of all residents to sex offenders in zip code 54730 is 453 to 1. The ratio of registered sex offenders to all residents in this zip code is lower than the state average.
Median resident age:
This zip code:
41.8 years
Wisconsin median age:
40.4 years
Average household size:
This zip code:
2.5 people
Wisconsin:
2.3 people
Averages for the 2020 tax year for zip code 54730, filed in 2021:
Average Adjusted Gross Income (AGI) in 2020: $61,003 (Individual Income Tax Returns)
Here:
$61,003
State:
$72,319
Salary/wage: $52,107 (reported on 81.1% of returns)
Here:
$52,107
State:
$59,242
(% of AGI for various income ranges: 1258.5% for AGIs below $25k, 3852.6% for AGIs $25k-50k, 5957.7% for AGIs $50k-75k, 10203.3% for AGIs $75k-100k, 16091.3% for AGIs $100k-200k)
Taxable interest for individuals: $990 (reported on 42.9% of returns)
This zip code:
$990
Wisconsin:
$1,431
(% of AGI for various income ranges: 46.6% for AGIs below $25k, 38.9% for AGIs $25k-50k, 47.0% for AGIs $50k-75k, 54.8% for AGIs $75k-100k, 88.3% for AGIs $100k-200k)
Ordinary dividends: $2,536 (reported on 21.6% of returns)
Here:
$2,536
State:
$6,481
(% of AGI for various income ranges: 36.4% for AGIs below $25k, 34.1% for AGIs $25k-50k, 85.3% for AGIs $50k-75k, 110.0% for AGIs $75k-100k, 172.2% for AGIs $100k-200k)
Net capital gain/loss in AGI: +$11,176 (reported on 19.3% of returns)
Here:
+$11,176
State:
+$18,329
(% of AGI for various income ranges: 38.9% for AGIs below $25k, 85.9% for AGIs $25k-50k, 189.3% for AGIs $50k-75k, 217.6% for AGIs $75k-100k, 713.0% for AGIs $100k-200k)
Profit/loss from business: +$12,281 (reported on 13.9% of returns)
Here:
+$12,281
State:
+$14,562
(% of AGI for various income ranges: 87.4% for AGIs below $25k, 204.8% for AGIs $25k-50k, 224.3% for AGIs $50k-75k, 329.5% for AGIs $75k-100k, 740.4% for AGIs $100k-200k)
Taxable individual retirement arrangement distribution: $15,271 (reported on 12.0% of returns)
54730:
$15,271
Wisconsin:
$19,348
(% of AGI for various income ranges: 92.8% for AGIs below $25k, 166.5% for AGIs $25k-50k, 269.7% for AGIs $50k-75k, 461.9% for AGIs $75k-100k, 762.2% for AGIs $100k-200k)
Total itemized deductions: $30,454 (reported on 5.0% of returns)
Here:
$30,454
State:
$33,000
(% of AGI for various income ranges: 207.4% for AGIs $25k-50k, 229.0% for AGIs $50k-75k, 351.0% for AGIs $75k-100k, 687.4% for AGIs $100k-200k)
Charity contributions: $6,590 (reported on 3.9% of returns)
Here:
$6,590
State:
$12,044
(% of AGI for various income ranges: 35.4% for AGIs $25k-50k, 37.1% for AGIs $75k-100k, 181.7% for AGIs $100k-200k)
Taxes paid: $7,477 (reported on 5.0% of returns)
54730:
$7,477
State:
$8,228
(% of AGI for various income ranges: 33.3% for AGIs $25k-50k, 47.0% for AGIs $50k-75k, 108.1% for AGIs $75k-100k, 196.1% for AGIs $100k-200k)
Earned income credit: $2,193 (reported on 10.8% of returns)
Here:
$2,193
State:
$2,155
(% of AGI for various income ranges: 67.4% for AGIs below $25k, 64.6% for AGIs $25k-50k)
Percentage of individuals using paid preparers for their 2020 taxes: 95.4%
Here:
95%
State:
94%
(% for various income ranges: 93.2% for AGIs below $25k, 95.4% for AGIs $25k-50k, 97.6% for AGIs $50k-75k, 94.1% for AGIs $75k-100k, 97.4% for AGIs $100k-200k, 100.0% for AGIs over 200k)
Averages for the 2012 tax year for zip code 54730, filed in 2013:
Average Adjusted Gross Income (AGI) in 2012: $51,829 (Individual Income Tax Returns)
Here:
$51,829
State:
$57,939
Salary/wage: $43,273 (reported on 83.4% of returns)
Here:
$43,273
State:
$48,248
(% of AGI for various income ranges: 71.0% for AGIs below $25k, 75.4% for AGIs $25k-50k, 74.8% for AGIs $50k-75k, 76.6% for AGIs $75k-100k, 70.9% for AGIs $100k-200k, 38.9% for AGIs over 200k)
Taxable interest for individuals: $1,213 (reported on 38.6% of returns)
This zip code:
$1,213
Wisconsin:
$1,224
(% of AGI for various income ranges: 2.2% for AGIs below $25k, 1.1% for AGIs $25k-50k, 0.9% for AGIs $50k-75k, 0.8% for AGIs $75k-100k, 0.5% for AGIs $100k-200k, 0.6% for AGIs over 200k)
Ordinary dividends: $3,139 (reported on 21.2% of returns)
Here:
$3,139
State:
$5,137
(% of AGI for various income ranges: 2.0% for AGIs below $25k, 0.5% for AGIs $25k-50k, 1.3% for AGIs $50k-75k, 1.2% for AGIs $75k-100k, 0.5% for AGIs $100k-200k, 3.1% for AGIs over 200k)
Net capital gain/loss in AGI: +$14,732 (reported on 19.5% of returns)
Here:
+$14,732
State:
+$11,137
(% of AGI for various income ranges: 1.3% for AGIs below $25k, 1.0% for AGIs $25k-50k, 2.5% for AGIs $50k-75k, 2.4% for AGIs $75k-100k, 3.5% for AGIs $100k-200k, 27.8% for AGIs over 200k)
Profit/loss from business: +$8,330 (reported on 16.6% of returns)
Here:
+$8,330
State:
+$11,943
(% of AGI for various income ranges: 6.0% for AGIs below $25k, 4.8% for AGIs $25k-50k, 2.8% for AGIs $50k-75k, 2.1% for AGIs $75k-100k, 1.6% for AGIs $100k-200k)
Taxable individual retirement arrangement distribution: $13,200 (reported on 10.4% of returns)
54730:
$13,200
Wisconsin:
$14,087
(% of AGI for various income ranges: 3.1% for AGIs below $25k, 3.1% for AGIs $25k-50k, 2.1% for AGIs $50k-75k, 2.8% for AGIs $75k-100k, 4.1% for AGIs $100k-200k)
Total itemized deductions: $19,570 (22% of AGI, reported on 32.8% of returns)
Here:
$19,570
State:
$22,257
Here:
21.8% of AGI
State:
20.1% of AGI
(% of AGI for various income ranges: 10.3% for AGIs below $25k, 8.0% for AGIs $25k-50k, 11.7% for AGIs $50k-75k, 14.0% for AGIs $75k-100k, 15.2% for AGIs $100k-200k, 13.5% for AGIs over 200k)
Charity contributions: $2,808 (reported on 24.5% of returns)
Here:
$2,808
State:
$3,370
(% of AGI for various income ranges: 0.5% for AGIs below $25k, 0.7% for AGIs $25k-50k, 1.0% for AGIs $50k-75k, 1.4% for AGIs $75k-100k, 1.4% for AGIs $100k-200k, 3.1% for AGIs over 200k)
Taxes paid: $8,729 (reported on 32.8% of returns)
54730:
$8,729
State:
$10,731
(% of AGI for various income ranges: 2.3% for AGIs below $25k, 3.1% for AGIs $25k-50k, 4.7% for AGIs $50k-75k, 6.2% for AGIs $75k-100k, 8.2% for AGIs $100k-200k, 7.1% for AGIs over 200k)
Earned income credit: $1,903 (reported on 14.1% of returns)
Here:
$1,903
State:
$2,094
(% of AGI for various income ranges: 4.4% for AGIs below $25k, 1.0% for AGIs $25k-50k)
Percentage of individuals using paid preparers for their 2012 taxes: 62.7%
Here:
63%
State:
54%
(% for various income ranges: 59.5% for AGIs below $25k, 62.1% for AGIs $25k-50k, 66.7% for AGIs $50k-75k, 63.3% for AGIs $75k-100k, 65.0% for AGIs $100k-200k, 75.0% for AGIs over 200k)
Averages for the 2004 tax year for zip code 54730, filed in 2005:
Average Adjusted Gross Income (AGI) in 2004: $42,409 (Individual Income Tax Returns)
Here:
$42,409
State:
$47,735
Salary/wage: $36,344 (reported on 86.7% of returns)
Here:
$36,344
State:
$41,540
(% of AGI for various income ranges: 131.1% for AGIs below $10k, 76.5% for AGIs $10k-25k, 80.3% for AGIs $25k-50k, 79.2% for AGIs $50k-75k, 81.8% for AGIs $75k-100k, 52.5% for AGIs over 100k)
Taxable interest for individuals: $1,193 (reported on 53.1% of returns)
This zip code:
$1,193
Wisconsin:
$1,420
(% of AGI for various income ranges: 6.4% for AGIs below $10k, 2.8% for AGIs $10k-25k, 1.8% for AGIs $25k-50k, 1.5% for AGIs $50k-75k, 0.8% for AGIs $75k-100k, 0.8% for AGIs over 100k)
Taxable dividends: $1,763 (reported on 26.6% of returns)
Here:
$1,763
State:
$2,869
(% of AGI for various income ranges: 5.2% for AGIs below $10k, 1.5% for AGIs $10k-25k, 0.7% for AGIs $25k-50k, 0.6% for AGIs $50k-75k, 0.5% for AGIs $75k-100k, 2.1% for AGIs over 100k)
Net capital gain/loss: +$13,722 (reported on 22.5% of returns)
Here:
+$13,722
State:
+$9,569
(% of AGI for various income ranges: 0.5% for AGIs below $10k, 5.1% for AGIs $10k-25k, 3.6% for AGIs $25k-50k, 3.6% for AGIs $50k-75k, 3.5% for AGIs $75k-100k, 19.4% for AGIs over 100k)
Profit/loss from business: +$6,816 (reported on 16.8% of returns)
Here:
+$6,816
State:
+$10,417
(% of AGI for various income ranges: 0.8% for AGIs below $10k, 4.2% for AGIs $10k-25k, 3.8% for AGIs $25k-50k, 3.5% for AGIs $50k-75k, 1.4% for AGIs $75k-100k, 1.1% for AGIs over 100k)
IRA payment deduction: $2,824 (reported on 4.1% of returns)
54730:
$2,824
Wisconsin:
$2,900
(% of AGI for various income ranges: 0.3% for AGIs $10k-25k, 0.5% for AGIs $25k-50k, 0.3% for AGIs $50k-75k, 0.3% for AGIs $75k-100k)
Self-employed pension: $7,500 (reported on 0.9% of returns)
Here:
$7,500
Wisconsin:
$11,934
Total itemized deductions: $15,779 (22% of AGI, reported on 36.5% of returns)
Here:
$15,779
State:
$18,160
Here:
21.8% of AGI
State:
21.1% of AGI
(% of AGI for various income ranges: 19.6% for AGIs below $10k, 10.7% for AGIs $10k-25k, 11.4% for AGIs $25k-50k, 14.9% for AGIs $50k-75k, 16.0% for AGIs $75k-100k, 13.5% for AGIs over 100k)
Charity contributions deductions: $2,266 (3% of AGI, reported on 29.5% of returns)
Here:
$2,266
State:
$2,711
Here:
2.9% of AGI
State:
3.0% of AGI
(% of AGI for various income ranges: 1.0% for AGIs below $10k, 0.7% for AGIs $10k-25k, 1.0% for AGIs $25k-50k, 1.1% for AGIs $50k-75k, 1.7% for AGIs $75k-100k, 3.0% for AGIs over 100k)
Total tax: $5,310 (reported on 79.0% of returns)
54730:
$5,310
State:
$7,114
(% of AGI for various income ranges: 4.2% for AGIs below $10k, 4.3% for AGIs $10k-25k, 6.7% for AGIs $25k-50k, 8.1% for AGIs $50k-75k, 9.6% for AGIs $75k-100k, 18.0% for AGIs over 100k)
Earned income credit: $1,444 (reported on 11.9% of returns)
Here:
$1,444
State:
$1,544
Percentage of individuals using paid preparers for their 2004 taxes: 64.7%
Here:
65%
State:
57%
(% for various income ranges: 56.5% for AGIs below $10k, 67.1% for AGIs $10k-25k, 66.6% for AGIs $25k-50k, 66.9% for AGIs $50k-75k, 65.0% for AGIs $75k-100k, 67.9% for AGIs over 100k)
Likely homosexual households (counted as self-reported same-sex unmarried-partner households)
Lesbian couples: 0.2% of all households
Gay men: 0.5% of all households
Household received Food Stamps/SNAP in the past 12 months: 246 Household did not receive Food Stamps/SNAP in the past 12 months: 1,904
Women who had a birth in the past 12 months: 50 (12 now married, 37 unmarried) Women who did not have a birth in the past 12 months: 1,118 (531 now married, 587 unmarried)
Housing units in zip code 54730 with a mortgage: 1,046 (108 second mortgage, 87 both second mortgage and home equity loan) Houses without a mortgage: 57
Median monthly owner costs for units with a mortgage: $1,433 Median monthly owner costs for units without a mortgage: $607
Residents with income below the poverty level in 2022:
This zip code:
6.3%
Whole state:
10.7%
Residents with income below 50% of the poverty level in 2022:
This zip code:
3.3%
Whole state:
5.7%
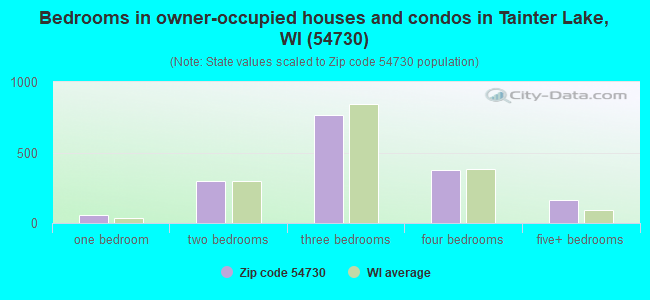
Median number of rooms in houses and condos:
Here:
6.6
State:
6.5
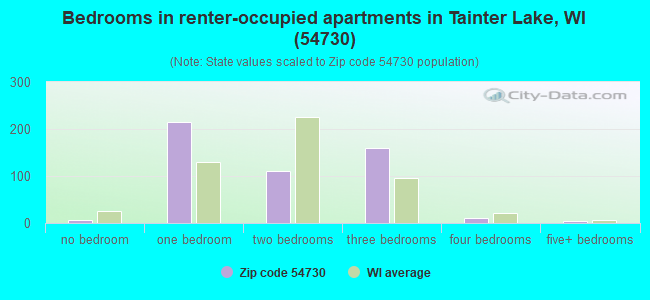
Median number of rooms in apartments:
Here:
3.6
State:
4.1
Notable locations in this zip code not listed on our city pages
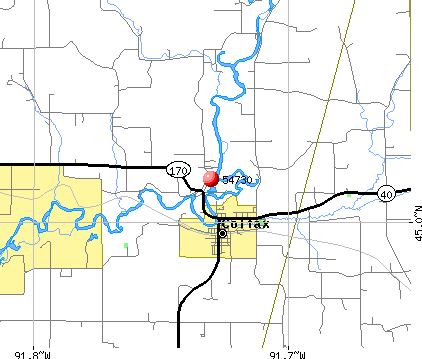
Notable locations in zip code 54730: Howard Townhall (A), Grant Townhall (B), Colfax Rescue Squad (C), Chippewa Fire District Station 6 (D), Colfax Community Fire Department (E). Display/hide their locations on the map
Churches in zip code 54730 include: Norton Church (A), Faith Church (B), Holden Church (C), Tainter Church (D), Saint Johns Church (E), North Running Valley Church (F). Display/hide their locations on the map
Cemeteries: Hill Grove Cemetery (1), Lower Running Valley Cemetery (2), Evergreen Cemetery (3), Popple Creek Cemetery (4). Display/hide their locations on the map
Rivers and creeks: Running Valley Creek (A), Beaver Creek (B), Hay River (C), Hay Creek (D), Trout Creek (E), Popple Creek (F), Bronken Creek (G), Eighteenmile Creek (H), Eddies Creek (I). Display/hide their locations on the map
952 married couples with children.
281 single-parent households (132 men, 149 women).
96.5% of residents of 54730 zip code speak English at home.
1.0% of residents speak Spanish at home (59% very well, 29% well, 12% not well).
0.8% of residents speak other Indo-European language at home (85% very well, 12% well, 2% not well).
1.4% of residents speak Asian or Pacific Island language at home (88% very well, 7% well, 5% not well).
0.2% of residents speak other language at home (100% very well).
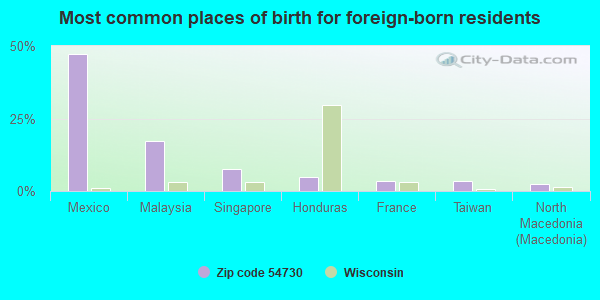
Foreign born population: 121 (2.3%) (50.1% of them are naturalized citizens)
This zip code:
2.3%
Whole state:
5.0%
47%Mexico
17%Malaysia
7%Singapore
5%Honduras
3%France
3%Taiwan
2%North Macedonia (Macedonia)
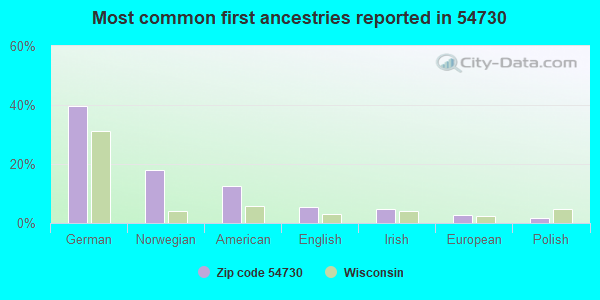
40%German
18%Norwegian
13%American
5%English
5%Irish
3%European
2%Polish
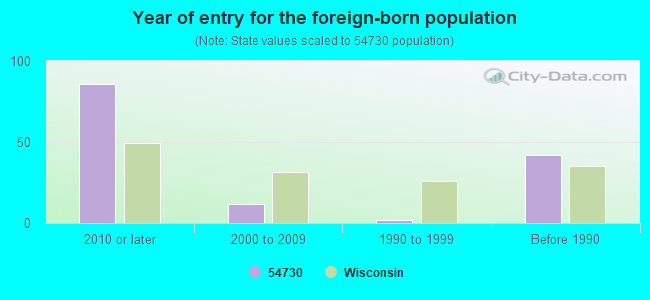
Year of entry for the foreign-born population
862010 or later
122000 to 2009
21990 to 1999
42Before 1990
Facilities with environmental interests located in this zip code:
ACADEMIC CENTER (601 UNIVERSITY AVE in COLFAX, WI)
(National Center for Education Statistics) - STATE ID-0400 (National Center for Education Statistics) - STATE ID-0300 Organizations: COLFAX SCH DIST (SCHOOL DISTRICT)
ABI INC (20TH ST S AND SCENIC RD in COLFAX, WI)
Conditionally Exempt Small Quantity Generators, less than 100 kg/month of hazardous waste (Resource Conservation and Recovery Act (tracking hazardous waste)) - notification STATE MASTER (Wisconsin database) - RCRAINFO-WID988577482, CESQG Organizations: ANDERSON DONALD (CONTACT/OWNER)
AREA NURSING HOME INC (1011 UNIVERSITY AVE in COLFAX, WI)
Small Quantity Generators, between 100 kg and 1000 kg of hazardous waste/month (Resource Conservation and Recovery Act (tracking hazardous waste))
Housing units lacking complete plumbing facilities: 0.2% Housing units lacking complete kitchen facilities: 0.8%
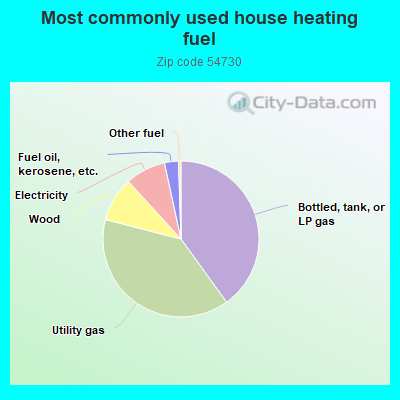
40.1%Bottled, tank, or LP gas
39.0%Utility gas
9.2%Wood
8.4%Electricity
2.9%Fuel oil, kerosene, etc.
0.5%Other fuel
Population in 1990: 4,073. Population change in the 1990s: +623 (+15.3%).
Place of birth for U.S.-born residents:
This state: 4,124
Northeast: 61
Midwest: 793
South: 100
West: 184
64% of the 54730 zip code residents lived in the same house 5 years ago. Out of people who lived in different houses, 47% lived in this county. Out of people who lived in different counties, 50% lived in Wisconsin.
95% of the 54730 zip code residents lived in the same house 1 year ago. Out of people who lived in different houses, 30% moved from this county. Out of people who lived in different houses, 59% moved from different county within same state. Out of people who lived in different houses, 14% moved from different state. Out of people who lived in different houses, 3% moved from abroad.
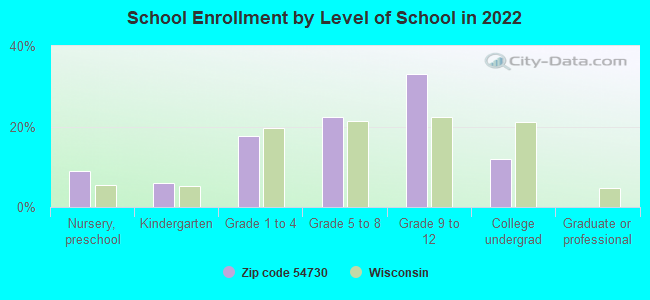
Private vs. public school enrollment:
Students in private schools in grades 1 to 8 (elementary and middle school): 45
Here:
9.0%
Wisconsin:
16.7%
Students in private schools in grades 9 to 12 (high school): 19
Here:
4.8%
Wisconsin:
12.5%
Students in private undergraduate colleges:
Here:
0.0%
Wisconsin:
17.5%
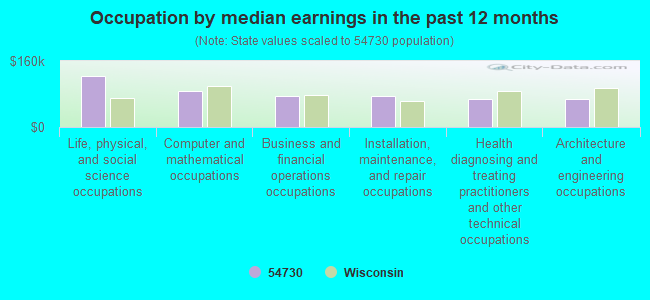
Occupation by median earnings in the past 12 months ($)
123,018Life, physical, and social science occupations
86,697Computer and mathematical occupations
75,317Business and financial operations occupations
74,545Installation, maintenance, and repair occupations
67,958Health diagnosing and treating practitioners and other technical occupations
67,047Architecture and engineering occupations
Companies with federal contracts located in this zip code:
BRUHN, EDWIN (1001 HIGH STREET in COLFAX, WI; small business) : $52,246 in 9 contractsfrom 2003 to 2006
Contracts for Operation of Government-Owned Facilities -- Recreation Facilities (Non-Building) by Army, U.S. Army Corps of Engineers - civil program financing only Signed by year:2000: $0; 2001: $0; 2002: $0; 2003: $6,298; 2004: $12,672; 2005: $12,876; 2006: $20,400.
Biggest contracts:
$10,200 with Army for Operation of Government-Owned Facilities -- Recreation Facilities (Non-Building). Taking place in AR. Signed on 2006-02-17. Completion date: 2005-09-30.
$10,200, same as above.Signed on 2006-02-13. Completion date: 2005-09-30.
$6,480, same as above.Signed on 2004-03-05. Completion date: 2004-09-13.
$6,480 with U.S. Army Corps of Engineers - civil program financing only for Operation of Government-Owned Facilities -- Recreation Facilities (Non-Building). Taking place in AR. Signed on 2004-03-05. Completion date: 2004-09-13.
Top industries in this zip code by the number of employees in 2005:
Health Care and Social Assistance: Nursing Care Facilities (50-99 employees: 1 establishment)
Professional, Scientific, and Technical Services: Testing Laboratories (20-49: 1)
Health Care and Social Assistance: Residential Mental Retardation Facilities (10-19: 1)
People in group quarters in 2010:
59 people in nursing facilities/skilled-nursing facilities
11 people in group homes intended for adults
People in group quarters in 2000:
58 people in nursing homes
Fatal accident statistics in 2014:
Fatal accident count: 1
Vehicles involved in fatal accidents: 1
Fatal accidents caused by drunken drivers: 1
Fatalities: 1
Persons involved in fatal accidents: 3
Pedestrians involved in fatal accidents: 0
Fatal accident statistics in 2010:
Fatal accident count: 1
Vehicles involved in fatal accidents: 1
Fatal accidents caused by drunken drivers: 0
Fatalities: 1
Persons involved in fatal accidents: 1
Pedestrians involved in fatal accidents: 0
Home Mortgage Disclosure Act Aggregated Statistics For Year 2009 (Based on 2 partial tracts)
A) FHA, FSA/RHS & VA Home Purchase Loans
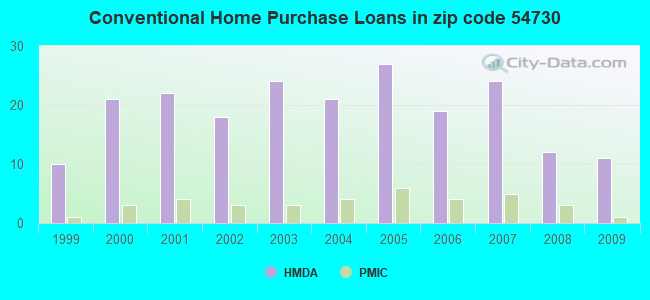
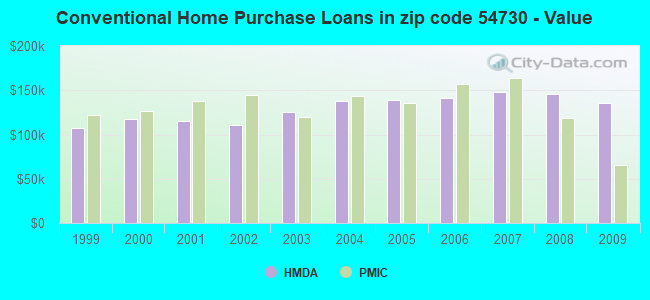
B) Conventional Home Purchase Loans
C) Refinancings
D) Home Improvement Loans
E) Loans on Dwellings For 5+ Families
F) Non-occupant Loans on < 5 Family Dwellings (A B C & D)
G) Loans On Manufactured Home Dwelling (A B C & D)
Number
Average Value
Number
Average Value
Number
Average Value
Number
Average Value
Number
Average Value
Number
Average Value
Number
Average Value
LOANS ORIGINATED
2
$127,680
11
$135,341
84
$157,474
5
$62,220
1
$335,140
4
$249,348
3
$88,567
APPLICATIONS APPROVED, NOT ACCEPTED
0
$0
2
$129,680
10
$127,111
0
$0
0
$0
0
$0
0
$0
APPLICATIONS DENIED
0
$0
2
$94,130
16
$116,476
1
$45,060
0
$0
0
$0
2
$56,245
APPLICATIONS WITHDRAWN
0
$0
1
$68,760
12
$150,544
0
$0
0
$0
1
$66,760
0
$0
FILES CLOSED FOR INCOMPLETENESS
0
$0
0
$0
3
$115,717
0
$0
0
$0
0
$0
0
$0
Aggregated Statistics For Year 2008 (Based on 2 partial tracts)
A) FHA, FSA/RHS & VA Home Purchase Loans
B) Conventional Home Purchase Loans
C) Refinancings
D) Home Improvement Loans
F) Non-occupant Loans on < 5 Family Dwellings (A B C & D)
G) Loans On Manufactured Home Dwelling (A B C & D)
Number
Average Value
Number
Average Value
Number
Average Value
Number
Average Value
Number
Average Value
Number
Average Value
LOANS ORIGINATED
3
$186,817
12
$145,592
52
$148,194
8
$62,880
3
$162,783
3
$115,717
APPLICATIONS APPROVED, NOT ACCEPTED
0
$0
1
$73,100
10
$111,356
1
$66,760
0
$0
0
$0
APPLICATIONS DENIED
0
$0
3
$106,817
15
$160,825
1
$53,070
1
$59,750
0
$0
APPLICATIONS WITHDRAWN
0
$0
1
$362,170
6
$124,230
1
$39,720
0
$0
0
$0
FILES CLOSED FOR INCOMPLETENESS
0
$0
0
$0
0
$0
0
$0
0
$0
0
$0
Aggregated Statistics For Year 2007 (Based on 2 partial tracts)
A) FHA, FSA/RHS & VA Home Purchase Loans
B) Conventional Home Purchase Loans
C) Refinancings
D) Home Improvement Loans
F) Non-occupant Loans on < 5 Family Dwellings (A B C & D)
G) Loans On Manufactured Home Dwelling (A B C & D)
Number
Average Value
Number
Average Value
Number
Average Value
Number
Average Value
Number
Average Value
Number
Average Value
LOANS ORIGINATED
1
$99,470
24
$148,541
38
$146,547
6
$42,170
6
$170,182
3
$138,637
APPLICATIONS APPROVED, NOT ACCEPTED
0
$0
1
$143,530
7
$159,794
0
$0
0
$0
0
$0
APPLICATIONS DENIED
0
$0
2
$141,530
13
$166,052
2
$31,710
1
$86,790
1
$44,730
APPLICATIONS WITHDRAWN
0
$0
1
$189,260
6
$164,285
0
$0
0
$0
0
$0
FILES CLOSED FOR INCOMPLETENESS
0
$0
1
$71,100
1
$284,730
0
$0
0
$0
0
$0
Aggregated Statistics For Year 2006 (Based on 2 partial tracts)
A) FHA, FSA/RHS & VA Home Purchase Loans
B) Conventional Home Purchase Loans
C) Refinancings
D) Home Improvement Loans
F) Non-occupant Loans on < 5 Family Dwellings (A B C & D)
G) Loans On Manufactured Home Dwelling (A B C & D)
Number
Average Value
Number
Average Value
Number
Average Value
Number
Average Value
Number
Average Value
Number
Average Value
LOANS ORIGINATED
1
$171,910
19
$141,426
45
$145,285
9
$23,551
5
$387,274
1
$33,380
APPLICATIONS APPROVED, NOT ACCEPTED
0
$0
0
$0
7
$91,127
0
$0
1
$99,140
0
$0
APPLICATIONS DENIED
0
$0
2
$121,835
16
$133,562
3
$81,337
0
$0
0
$0
APPLICATIONS WITHDRAWN
0
$0
0
$0
11
$121,595
0
$0
0
$0
0
$0
FILES CLOSED FOR INCOMPLETENESS
0
$0
0
$0
4
$162,392
0
$0
0
$0
0
$0
Aggregated Statistics For Year 2005 (Based on 2 partial tracts)
A) FHA, FSA/RHS & VA Home Purchase Loans
B) Conventional Home Purchase Loans
C) Refinancings
D) Home Improvement Loans
F) Non-occupant Loans on < 5 Family Dwellings (A B C & D)
G) Loans On Manufactured Home Dwelling (A B C & D)
Number
Average Value
Number
Average Value
Number
Average Value
Number
Average Value
Number
Average Value
Number
Average Value
LOANS ORIGINATED
2
$168,070
27
$139,442
51
$136,393
10
$41,258
5
$119,300
3
$65,203
APPLICATIONS APPROVED, NOT ACCEPTED
0
$0
3
$138,860
4
$146,538
1
$9,350
0
$0
1
$33,710
APPLICATIONS DENIED
0
$0
4
$91,295
13
$140,196
2
$47,065
0
$0
1
$110,490
APPLICATIONS WITHDRAWN
0
$0
1
$29,710
15
$123,172
1
$22,360
1
$85,450
0
$0
FILES CLOSED FOR INCOMPLETENESS
0
$0
0
$0
3
$168,123
0
$0
0
$0
0
$0
Aggregated Statistics For Year 2004 (Based on 2 partial tracts)
B) Conventional Home Purchase Loans
C) Refinancings
D) Home Improvement Loans
F) Non-occupant Loans on < 5 Family Dwellings (A B C & D)
G) Loans On Manufactured Home Dwelling (A B C & D)
Number
Average Value
Number
Average Value
Number
Average Value
Number
Average Value
Number
Average Value
LOANS ORIGINATED
21
$138,161
52
$123,743
8
$28,999
4
$108,235
2
$46,065
APPLICATIONS APPROVED, NOT ACCEPTED
2
$104,315
4
$117,248
1
$21,030
0
$0
0
$0
APPLICATIONS DENIED
1
$152,210
15
$119,345
1
$18,690
0
$0
1
$89,790
APPLICATIONS WITHDRAWN
1
$95,130
12
$131,044
1
$68,430
0
$0
1
$69,430
FILES CLOSED FOR INCOMPLETENESS
0
$0
3
$101,253
0
$0
0
$0
0
$0
Aggregated Statistics For Year 2003 (Based on 2 partial tracts)
B) Conventional Home Purchase Loans
C) Refinancings
D) Home Improvement Loans
F) Non-occupant Loans on < 5 Family Dwellings (A B C & D)
Number
Average Value
Number
Average Value
Number
Average Value
Number
Average Value
LOANS ORIGINATED
24
$125,495
117
$112,956
6
$22,253
5
$137,926
APPLICATIONS APPROVED, NOT ACCEPTED
1
$91,800
2
$131,850
1
$17,690
0
$0
APPLICATIONS DENIED
4
$87,705
16
$114,097
1
$10,680
0
$0
APPLICATIONS WITHDRAWN
1
$90,130
10
$99,506
0
$0
0
$0
FILES CLOSED FOR INCOMPLETENESS
0
$0
1
$175,910
0
$0
0
$0
Aggregated Statistics For Year 2002 (Based on 2 partial tracts)
A) FHA, FSA/RHS & VA Home Purchase Loans
B) Conventional Home Purchase Loans
C) Refinancings
D) Home Improvement Loans
F) Non-occupant Loans on < 5 Family Dwellings (A B C & D)
Number
Average Value
Number
Average Value
Number
Average Value
Number
Average Value
Number
Average Value
LOANS ORIGINATED
1
$121,500
18
$110,321
102
$103,367
7
$21,124
5
$91,996
APPLICATIONS APPROVED, NOT ACCEPTED
0
$0
1
$160,890
5
$117,564
0
$0
0
$0
APPLICATIONS DENIED
0
$0
4
$90,460
14
$96,731
2
$15,855
0
$0
APPLICATIONS WITHDRAWN
0
$0
3
$97,023
8
$102,476
1
$15,020
1
$113,490
FILES CLOSED FOR INCOMPLETENESS
0
$0
0
$0
1
$27,710
0
$0
0
$0
Aggregated Statistics For Year 2001 (Based on 2 partial tracts)
A) FHA, FSA/RHS & VA Home Purchase Loans
B) Conventional Home Purchase Loans
C) Refinancings
D) Home Improvement Loans
F) Non-occupant Loans on < 5 Family Dwellings (A B C & D)
Number
Average Value
Number
Average Value
Number
Average Value
Number
Average Value
Number
Average Value
LOANS ORIGINATED
1
$61,750
22
$115,389
75
$100,242
8
$31,461
2
$137,190
APPLICATIONS APPROVED, NOT ACCEPTED
0
$0
1
$105,480
4
$89,292
0
$0
0
$0
APPLICATIONS DENIED
0
$0
2
$71,765
10
$96,034
1
$27,370
1
$53,070
APPLICATIONS WITHDRAWN
0
$0
1
$116,830
6
$128,958
1
$23,700
0
$0
FILES CLOSED FOR INCOMPLETENESS
0
$0
0
$0
1
$135,860
0
$0
0
$0
Aggregated Statistics For Year 2000 (Based on 2 partial tracts)
A) FHA, FSA/RHS & VA Home Purchase Loans
B) Conventional Home Purchase Loans
C) Refinancings
D) Home Improvement Loans
F) Non-occupant Loans on < 5 Family Dwellings (A B C & D)
Number
Average Value
Number
Average Value
Number
Average Value
Number
Average Value
Number
Average Value
LOANS ORIGINATED
1
$83,780
21
$117,672
17
$72,827
11
$17,236
2
$118,500
APPLICATIONS APPROVED, NOT ACCEPTED
0
$0
2
$50,235
2
$72,935
0
$0
0
$0
APPLICATIONS DENIED
0
$0
2
$70,935
8
$63,922
1
$22,700
0
$0
APPLICATIONS WITHDRAWN
0
$0
1
$43,060
4
$76,775
0
$0
0
$0
FILES CLOSED FOR INCOMPLETENESS
0
$0
0
$0
0
$0
0
$0
0
$0
Aggregated Statistics For Year 1999 (Based on 1 partial tract)
B) Conventional Home Purchase Loans
C) Refinancings
D) Home Improvement Loans
F) Non-occupant Loans on < 5 Family Dwellings (A B C & D)
Detailed PMIC statistics for the following Tracts:0104.00
2004 - 2018 National Fire Incident Reporting System (NFIRS) incidents
Based on the data from the years 2004 - 2018 the average number of fire incidents per year is 12. The highest number of fire incidents - 37 took place in 2013, and the least - 0 in 2005. The data has a rising trend.
When looking into fire subcategories, the most incidents belonged to: Structure Fires (61.0%), and Outside Fires (27.1%).
Fire incident types reported to NFIRS in Zip Code 54730
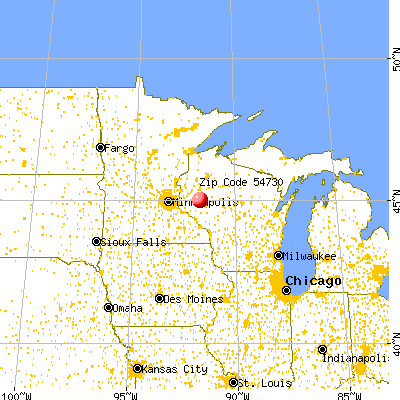


 Nearest zip codes: 54765, 54739, 54772, 54763, 54724, 54751.
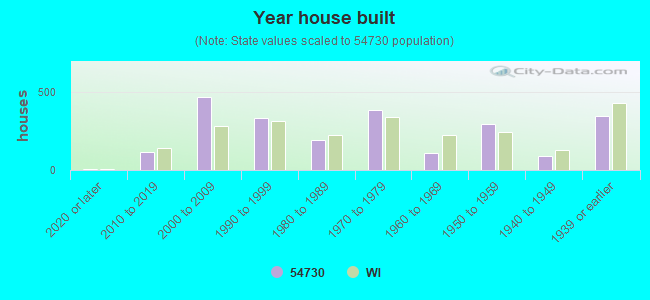


 Based on the data from the years 2004 - 2018 the average number of fire incidents per year is 12. The highest number of fire incidents - 37 took place in 2013, and the least - 0 in 2005. The data has a rising trend.
 When looking into fire subcategories, the most incidents belonged to: Structure Fires (61.0%), and Outside Fires (27.1%).