Estimated zip code population in 2022: 29,282 Zip code population in 2010: 27,863 Zip code population in 2000: 26,551
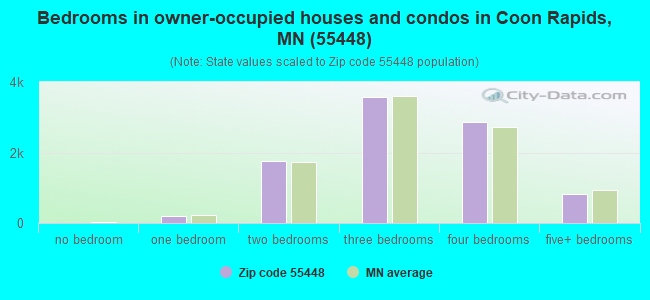
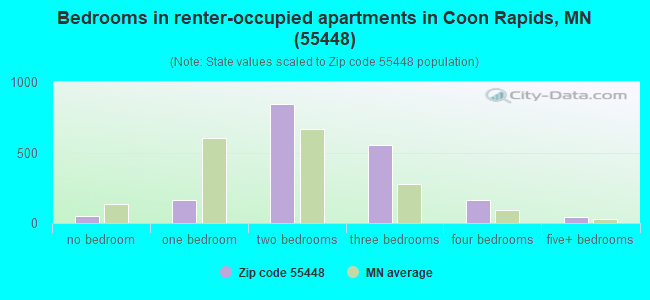
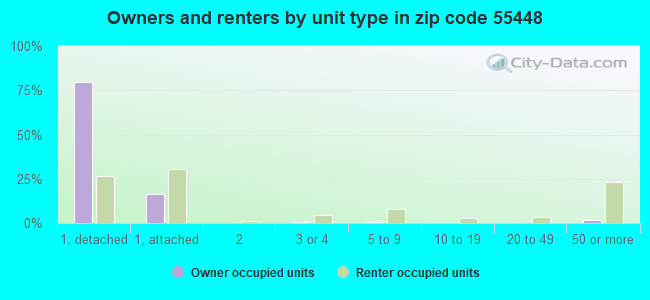
Houses and condos: 11,185 Renter-occupied apartments: 1,838
% of renters here:
17%
State:
28%
March 2022 cost of living index in zip code 55448: 114.6 (more than average, U.S. average is 100)
Land area: 10.9 sq. mi. Water area: 0.2 sq. mi.
Population density: 2,695 people per square mile
(average).
OSM Map
General Map
Google Map
MSN Map
OSM Map
General Map
Google Map
MSN Map
OSM Map
General Map
Google Map
MSN Map
OSM Map
General Map
Google Map
MSN Map
Please wait while loading the map...
Real estate property taxes paid for housing units in 2022:
This zip code:
0.9% ($2,813)
Minnesota:
1.0% ($3,087)
Median real estate property taxes paid for housing units with mortgages in 2022: $2,742 (0.9%) Median real estate property taxes paid for housing units with no mortgage in 2022: $2,995 (1.0%)
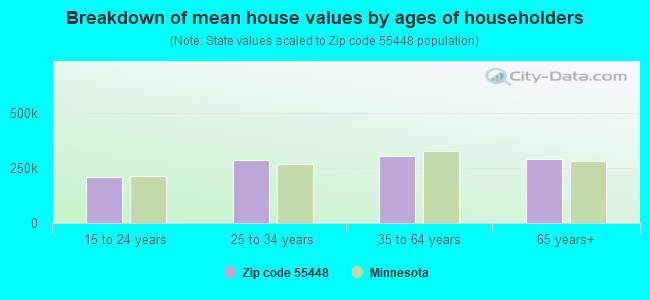
Estimated median house/condo value in 2022: $311,419
55448:
$311,419
Minnesota:
$314,600
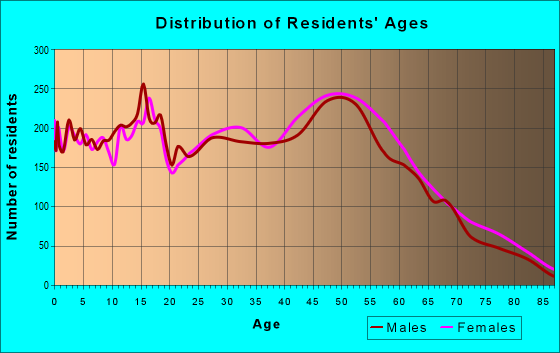
Median resident age:
This zip code:
41.1 years
Minnesota median age:
39.0 years
Average household size:
This zip code:
2.6 people
Minnesota:
2.4 people
Averages for the 2020 tax year for zip code 55448, filed in 2021:
Average Adjusted Gross Income (AGI) in 2020: $65,322 (Individual Income Tax Returns)
Here:
$65,322
State:
$82,178
Salary/wage: $57,704 (reported on 84.3% of returns)
Here:
$57,704
State:
$67,438
(% of AGI for various income ranges: 1141.0% for AGIs below $25k, 3706.7% for AGIs $25k-50k, 6731.1% for AGIs $50k-75k, 9821.3% for AGIs $75k-100k, 18860.6% for AGIs $100k-200k, 63150.0% for AGIs over 200k)
Taxable interest for individuals: $1,130 (reported on 26.9% of returns)
This zip code:
$1,130
Minnesota:
$1,814
(% of AGI for various income ranges: 13.3% for AGIs below $25k, 14.5% for AGIs $25k-50k, 25.7% for AGIs $50k-75k, 40.5% for AGIs $75k-100k, 102.6% for AGIs $100k-200k, 1076.2% for AGIs over 200k)
Ordinary dividends: $2,747 (reported on 18.1% of returns)
Here:
$2,747
State:
$6,928
(% of AGI for various income ranges: 18.7% for AGIs below $25k, 28.7% for AGIs $25k-50k, 55.2% for AGIs $50k-75k, 89.4% for AGIs $75k-100k, 166.5% for AGIs $100k-200k, 1296.9% for AGIs over 200k)
Net capital gain/loss in AGI: +$8,851 (reported on 15.2% of returns)
Here:
+$8,851
State:
+$20,591
(% of AGI for various income ranges: 2.0% for AGIs below $25k, 20.0% for AGIs $25k-50k, 51.2% for AGIs $50k-75k, 156.4% for AGIs $75k-100k, 429.3% for AGIs $100k-200k, 8441.5% for AGIs over 200k)
Profit/loss from business: +$10,341 (reported on 11.9% of returns)
Here:
+$10,341
State:
+$14,342
(% of AGI for various income ranges: 78.4% for AGIs below $25k, 115.3% for AGIs $25k-50k, 158.8% for AGIs $50k-75k, 231.8% for AGIs $75k-100k, 322.0% for AGIs $100k-200k, 2055.4% for AGIs over 200k)
Taxable individual retirement arrangement distribution: $18,469 (reported on 10.7% of returns)
55448:
$18,469
Minnesota:
$20,675
(% of AGI for various income ranges: 75.2% for AGIs below $25k, 126.3% for AGIs $25k-50k, 216.0% for AGIs $50k-75k, 424.7% for AGIs $75k-100k, 869.2% for AGIs $100k-200k, 2010.8% for AGIs over 200k)
Self-employed (Keogh) retirement plans: $14,800 (reported on 0.2% of returns)
55448:
$14,800
Minnesota:
$23,059
(% of AGI for various income ranges: 31.7% for AGIs $100k-200k)
Total itemized deductions: $25,484 (reported on 8.9% of returns)
Here:
$25,484
State:
$33,311
(% of AGI for various income ranges: 53.6% for AGIs below $25k, 115.7% for AGIs $25k-50k, 292.9% for AGIs $50k-75k, 565.9% for AGIs $75k-100k, 788.4% for AGIs $100k-200k, 4606.9% for AGIs over 200k)
Charity contributions: $6,741 (reported on 6.5% of returns)
Here:
$6,741
State:
$11,879
(% of AGI for various income ranges: 4.7% for AGIs below $25k, 15.2% for AGIs $25k-50k, 30.9% for AGIs $50k-75k, 69.6% for AGIs $75k-100k, 196.5% for AGIs $100k-200k, 1497.7% for AGIs over 200k)
Taxes paid: $7,329 (reported on 8.8% of returns)
55448:
$7,329
State:
$8,252
(% of AGI for various income ranges: 7.6% for AGIs below $25k, 25.9% for AGIs $25k-50k, 92.0% for AGIs $50k-75k, 181.6% for AGIs $75k-100k, 250.6% for AGIs $100k-200k, 1058.5% for AGIs over 200k)
Earned income credit: $1,996 (reported on 10.9% of returns)
Here:
$1,996
State:
$2,055
(% of AGI for various income ranges: 64.2% for AGIs below $25k, 50.8% for AGIs $25k-50k, 0.7% for AGIs $50k-75k)
Percentage of individuals using paid preparers for their 2020 taxes: 93.3%
Here:
93%
State:
94%
(% for various income ranges: 92.1% for AGIs below $25k, 94.1% for AGIs $25k-50k, 93.3% for AGIs $50k-75k, 92.7% for AGIs $75k-100k, 94.1% for AGIs $100k-200k, 95.2% for AGIs over 200k)
Averages for the 2012 tax year for zip code 55448, filed in 2013:
Average Adjusted Gross Income (AGI) in 2012: $56,013 (Individual Income Tax Returns)
Here:
$56,013
State:
$67,192
Salary/wage: $51,246 (reported on 87.3% of returns)
Here:
$51,246
State:
$55,182
(% of AGI for various income ranges: 77.1% for AGIs below $25k, 81.4% for AGIs $25k-50k, 80.4% for AGIs $50k-75k, 82.4% for AGIs $75k-100k, 82.9% for AGIs $100k-200k, 63.7% for AGIs over 200k)
Taxable interest for individuals: $763 (reported on 32.1% of returns)
This zip code:
$763
Minnesota:
$1,664
(% of AGI for various income ranges: 0.9% for AGIs below $25k, 0.4% for AGIs $25k-50k, 0.4% for AGIs $50k-75k, 0.3% for AGIs $75k-100k, 0.4% for AGIs $100k-200k, 0.5% for AGIs over 200k)
Ordinary dividends: $2,132 (reported on 19.3% of returns)
Here:
$2,132
State:
$5,665
(% of AGI for various income ranges: 1.1% for AGIs below $25k, 0.6% for AGIs $25k-50k, 0.5% for AGIs $50k-75k, 0.6% for AGIs $75k-100k, 0.8% for AGIs $100k-200k, 1.2% for AGIs over 200k)
Net capital gain/loss in AGI: +$6,081 (reported on 13.8% of returns)
Here:
+$6,081
State:
+$16,131
(% of AGI for various income ranges: 0.2% for AGIs $50k-75k, 0.3% for AGIs $75k-100k, 1.3% for AGIs $100k-200k, 10.3% for AGIs over 200k)
Profit/loss from business: +$9,884 (reported on 11.8% of returns)
Here:
+$9,884
State:
+$12,430
(% of AGI for various income ranges: 4.8% for AGIs below $25k, 2.7% for AGIs $25k-50k, 2.1% for AGIs $50k-75k, 1.6% for AGIs $75k-100k, 1.5% for AGIs $100k-200k, 1.8% for AGIs over 200k)
Taxable individual retirement arrangement distribution: $13,319 (reported on 10.8% of returns)
55448:
$13,319
Minnesota:
$15,212
(% of AGI for various income ranges: 3.9% for AGIs below $25k, 2.6% for AGIs $25k-50k, 2.4% for AGIs $50k-75k, 2.3% for AGIs $75k-100k, 2.6% for AGIs $100k-200k, 2.4% for AGIs over 200k)
Self-employment retirement plans: $11,250 (reported on 0.3% of returns)
55448:
$11,250
Minnesota:
$17,874
Total itemized deductions: $19,225 (21% of AGI, reported on 42.7% of returns)
Here:
$19,225
State:
$24,665
Here:
21.5% of AGI
State:
19.6% of AGI
(% of AGI for various income ranges: 11.4% for AGIs below $25k, 12.0% for AGIs $25k-50k, 14.4% for AGIs $50k-75k, 15.6% for AGIs $75k-100k, 16.6% for AGIs $100k-200k, 14.1% for AGIs over 200k)
Charity contributions: $2,656 (reported on 35.2% of returns)
Here:
$2,656
State:
$3,948
(% of AGI for various income ranges: 0.9% for AGIs below $25k, 1.1% for AGIs $25k-50k, 1.4% for AGIs $50k-75k, 1.8% for AGIs $75k-100k, 2.1% for AGIs $100k-200k, 2.0% for AGIs over 200k)
Taxes paid: $7,306 (reported on 42.5% of returns)
55448:
$7,306
State:
$10,589
(% of AGI for various income ranges: 2.1% for AGIs below $25k, 3.2% for AGIs $25k-50k, 4.7% for AGIs $50k-75k, 5.8% for AGIs $75k-100k, 7.4% for AGIs $100k-200k, 7.2% for AGIs over 200k)
Earned income credit: $1,979 (reported on 11.9% of returns)
Here:
$1,979
State:
$2,037
(% of AGI for various income ranges: 4.5% for AGIs below $25k, 0.7% for AGIs $25k-50k)
Percentage of individuals using paid preparers for their 2012 taxes: 47.2%
Here:
47%
State:
55%
(% for various income ranges: 39.5% for AGIs below $25k, 48.0% for AGIs $25k-50k, 52.0% for AGIs $50k-75k, 50.9% for AGIs $75k-100k, 53.1% for AGIs $100k-200k, 62.5% for AGIs over 200k)
Averages for the 2004 tax year for zip code 55448, filed in 2005:
Average Adjusted Gross Income (AGI) in 2004: $50,340 (Individual Income Tax Returns)
Here:
$50,340
State:
$53,560
Salary/wage: $47,140 (reported on 90.7% of returns)
Here:
$47,140
State:
$46,177
(% of AGI for various income ranges: 114.0% for AGIs below $10k, 78.1% for AGIs $10k-25k, 86.1% for AGIs $25k-50k, 86.4% for AGIs $50k-75k, 89.7% for AGIs $75k-100k, 80.0% for AGIs over 100k)
Taxable interest for individuals: $866 (reported on 43.0% of returns)
This zip code:
$866
Minnesota:
$1,796
(% of AGI for various income ranges: 2.3% for AGIs below $10k, 1.6% for AGIs $10k-25k, 0.8% for AGIs $25k-50k, 0.4% for AGIs $50k-75k, 0.4% for AGIs $75k-100k, 0.9% for AGIs over 100k)
Taxable dividends: $1,250 (reported on 24.7% of returns)
Here:
$1,250
State:
$3,096
(% of AGI for various income ranges: 1.9% for AGIs below $10k, 0.7% for AGIs $10k-25k, 0.5% for AGIs $25k-50k, 0.4% for AGIs $50k-75k, 0.5% for AGIs $75k-100k, 0.8% for AGIs over 100k)
Net capital gain/loss: +$5,084 (reported on 17.8% of returns)
Here:
+$5,084
State:
+$10,864
(% of AGI for various income ranges: -1.8% for AGIs below $10k, -0.2% for AGIs $10k-25k, 0.2% for AGIs $25k-50k, 0.5% for AGIs $50k-75k, 0.6% for AGIs $75k-100k, 5.2% for AGIs over 100k)
Profit/loss from business: +$7,813 (reported on 13.0% of returns)
Here:
+$7,813
State:
+$10,442
(% of AGI for various income ranges: 0.5% for AGIs below $10k, 5.0% for AGIs $10k-25k, 2.4% for AGIs $25k-50k, 1.8% for AGIs $50k-75k, 1.3% for AGIs $75k-100k, 1.9% for AGIs over 100k)
IRA payment deduction: $2,950 (reported on 2.2% of returns)
55448:
$2,950
Minnesota:
$2,955
(% of AGI for various income ranges: 0.1% for AGIs $10k-25k, 0.2% for AGIs $25k-50k, 0.1% for AGIs $50k-75k, 0.1% for AGIs $75k-100k, 0.1% for AGIs over 100k)
Self-employed pension: $7,985 (reported on 0.5% of returns)
Here:
$7,985
Minnesota:
$12,099
(% of AGI for various income ranges: 0.1% for AGIs $25k-50k, 0.0% for AGIs $50k-75k, 0.0% for AGIs $75k-100k, 0.2% for AGIs over 100k)
Total itemized deductions: $16,701 (22% of AGI, reported on 51.9% of returns)
Here:
$16,701
State:
$20,035
Here:
22.2% of AGI
State:
21.3% of AGI
(% of AGI for various income ranges: 15.1% for AGIs below $10k, 11.8% for AGIs $10k-25k, 17.3% for AGIs $25k-50k, 19.2% for AGIs $50k-75k, 19.2% for AGIs $75k-100k, 15.5% for AGIs over 100k)
Charity contributions deductions: $2,260 (3% of AGI, reported on 46.4% of returns)
Here:
$2,260
State:
$3,333
Here:
2.9% of AGI
State:
3.4% of AGI
(% of AGI for various income ranges: 0.8% for AGIs below $10k, 1.1% for AGIs $10k-25k, 1.6% for AGIs $25k-50k, 2.1% for AGIs $50k-75k, 2.5% for AGIs $75k-100k, 2.4% for AGIs over 100k)
Total tax: $6,374 (reported on 82.0% of returns)
55448:
$6,374
State:
$8,485
(% of AGI for various income ranges: 2.8% for AGIs below $10k, 4.8% for AGIs $10k-25k, 7.3% for AGIs $25k-50k, 8.4% for AGIs $50k-75k, 9.4% for AGIs $75k-100k, 15.9% for AGIs over 100k)
Earned income credit: $1,482 (reported on 8.3% of returns)
Here:
$1,482
State:
$1,523
Percentage of individuals using paid preparers for their 2004 taxes: 51.4%
Here:
51%
State:
59%
(% for various income ranges: 37.6% for AGIs below $10k, 50.5% for AGIs $10k-25k, 52.9% for AGIs $25k-50k, 57.7% for AGIs $50k-75k, 54.6% for AGIs $75k-100k, 55.6% for AGIs over 100k)
Likely homosexual households (counted as self-reported same-sex unmarried-partner households)
Lesbian couples: 0.2% of all households
Gay men: 0.1% of all households
Household received Food Stamps/SNAP in the past 12 months: 671 Household did not receive Food Stamps/SNAP in the past 12 months: 10,427
Women who had a birth in the past 12 months: 246 (201 now married, 46 unmarried) Women who did not have a birth in the past 12 months: 6,590 (2,653 now married, 3,935 unmarried)
Housing units in zip code 55448 with a mortgage: 6,819 (581 second mortgage, 29 home equity loan, 423 both second mortgage and home equity loan) Houses without a mortgage: 212
Median monthly owner costs for units with a mortgage: $1,686 Median monthly owner costs for units without a mortgage: $619
Residents with income below the poverty level in 2022:
This zip code:
6.9%
Whole state:
9.6%
Residents with income below 50% of the poverty level in 2022:
This zip code:
4.6%
Whole state:
5.2%
Median number of rooms in houses and condos:
Here:
7.0
State:
7.1
Median number of rooms in apartments:
Here:
4.5
State:
3.8
Notable locations in this zip code not listed on our city pages
Notable locations in zip code 55448: Bunker Hills Golf Course (A), Coon Rapids Fire Department Station 2 (B), Northdale Library (C). Display/hide their locations on the map
Shopping Centers: Northdale Shopping Center (1), Northtown Village Shopping Center (2), Riverdale Crossing Shopping Center (3). Display/hide their locations on the map
Churches in zip code 55448 include: World of Life Alliance Church (A), Berean Church (B), Unity North Church (C), Presbyterian Church of the Master (D), Chapel Hill Church (E), Believers Bible Chapel (F), Peace Church (G). Display/hide their locations on the map
Parks in zip code 55448 include: Moor Park (1), Nelson Park (2), Woodview Park (3), Bunker Hills Regional Park (4), Sand Creek Park (5), Bison Creek Park (6), Woodland Heights Park (7), Woodland Oaks Park (8), Wilderness Park (9). Display/hide their locations on the map
4,072 married couples with children.
1,548 single-parent households (493 men, 1,055 women).
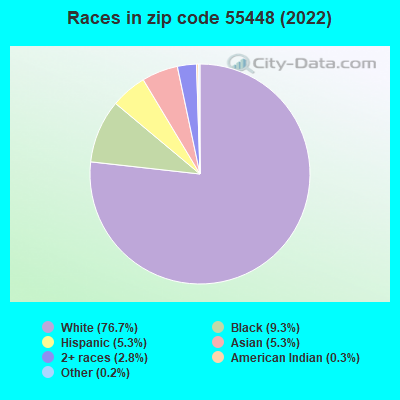
86.2% of residents of 55448 zip code speak English at home.
3.5% of residents speak Spanish at home (50% very well, 27% well, 19% not well, 3% not at all).
3.2% of residents speak other Indo-European language at home (45% very well, 31% well, 14% not well, 10% not at all).
4.0% of residents speak Asian or Pacific Island language at home (72% very well, 20% well, 9% not well).
3.3% of residents speak other language at home (86% very well, 5% well, 9% not well).
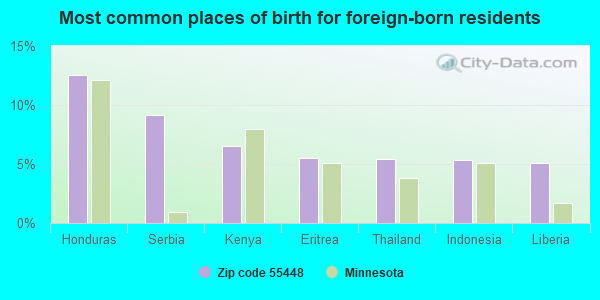
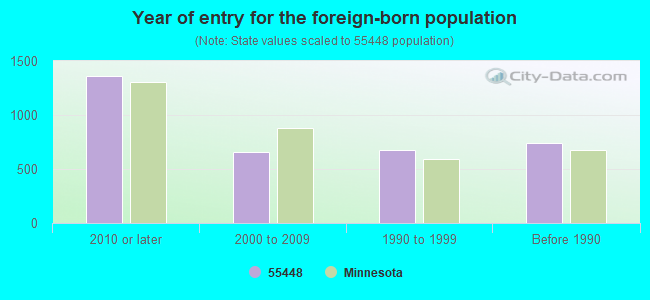
Foreign born population: 3,177 (10.8%) (62.6% of them are naturalized citizens)
Major facilities with environmental interests located in this zip code:
MODERN TOOL (1200 NORTHDALE BLVD in COON RAPIDS, MN)
AIR MINOR (AIRS/AFS) STATE MASTER (Minnesota Pollution Control Agency permits and compilance tracking) - AIRS-2700300092, AIR PROGRAM, RCRAINFO-MND982605438, CESQG, AFS-2700300092, AIR SYNTHETIC MINOR, RCRIS-MND982605438, CESQG CRITERIA AND HAZARDOUS AIR POLLUTANT INVENTORY (Inventory of air pollution sources) Small Quantity Generators, between 100 kg and 1000 kg of hazardous waste/month (Resource Conservation and Recovery Act (tracking hazardous waste)) - notification Business SIC classification: METAL STAMPINGS Business NAICS classification: METAL STAMPING. Organizations: WOOLSTON GROVER (CONTACT/OWNER)
, MODERN TOOL INC (CONTACT/OWNER)
NORTH CITIES ANIMAL HOSPITAL (1760 116TH AVE NW in COON RAPIDS, MN)
STATE MASTER (Minnesota Pollution Control Agency permits and compilance tracking) - RCRAINFO-MND981960503, HAZARDOUS WASTE PROGRAM, RCRIS-MND981960503, Conditionally Exempt Small Quantity Generators, less than 100 kg/month of hazardous waste (Resource Conservation and Recovery Act (tracking hazardous waste)) - notification (Resource Conservation and Recovery Act (tracking hazardous waste)) Business SIC classification: VETERINARY SERVICES FOR ANIMAL SPECIALTIES Business NAICS classification: VETERINARY SERVICES. Organizations: THOMPSON STANLEY L (CONTACT/OWNER)
AMERICAN TOOL GRINDING INC (11485 XEON ST NW in COON RAPIDS, MN)
STATE MASTER (Minnesota Pollution Control Agency permits and compilance tracking) - RCRAINFO-MND985761204, CESQG, RCRIS-MND985761204, Conditionally Exempt Small Quantity Generators, less than 100 kg/month of hazardous waste (Resource Conservation and Recovery Act (tracking hazardous waste)) - notification TRANSPORTER (Resource Conservation and Recovery Act (tracking hazardous waste)) - notification Organizations: STEWART MICHAEL (CONTACT/OWNER)
ANOKA COUNTY COMMUNITY ACTION (11740 XEON BLVD in COON RAPIDS, MN)
STATE MASTER (Minnesota Pollution Control Agency permits and compilance tracking) - RCRAINFO-MNR000034264, CESQG, RCRIS-MNR000034264, Small Quantity Generators, between 100 kg and 1000 kg of hazardous waste/month (Resource Conservation and Recovery Act (tracking hazardous waste)) - notification Organizations: MCFARLAND PATRIC (CONTACT/OWNER)
BEST BUY 540 (12633 RIVERDALE BLVD in COON RAPIDS, MN)
STATE MASTER (Minnesota Pollution Control Agency permits and compilance tracking) - RCRIS-MNS000101816, CESQG Conditionally Exempt Small Quantity Generators, less than 100 kg/month of hazardous waste (Resource Conservation and Recovery Act (tracking hazardous waste)) Organizations: BEST BUY ENTERPRISES (CONTACT/OWNER)
NORTH SUBURBAN CHIROPRACTIC (12045 HANSON BLVD NW in COON RAPIDS, MN)
STATE MASTER (Minnesota Pollution Control Agency permits and compilance tracking) - RCRAINFO-MNR000071217, CESQG, RCRIS-MNR000071217, Conditionally Exempt Small Quantity Generators, less than 100 kg/month of hazardous waste (Resource Conservation and Recovery Act (tracking hazardous waste)) - notification Business SIC classification: OFFICES AND CLINICS OF CHIROPRACTORS Business NAICS classification: OFFICES OF CHIROPRACTORS. Organizations: HERTEL JERRY (CONTACT/OWNER)
NORTHDALE 76 (11401 FOLEY BLVD NW in COON RAPIDS, MN)
STATE MASTER (Minnesota Pollution Control Agency permits and compilance tracking) - RCRAINFO-MND985716364, HAZARDOUS WASTE PROGRAM, RCRIS-MND985716364, Conditionally Exempt Small Quantity Generators, less than 100 kg/month of hazardous waste (Resource Conservation and Recovery Act (tracking hazardous waste)) - notification Organizations: BERGMANIS ROBERT (CONTACT/OWNER)
Alternative names: NORTHDALE TEXACO
OVERBY KEN (10825 MAGNOLIA ST in COON RAPIDS, MN)
STATE MASTER (Minnesota Pollution Control Agency permits and compilance tracking) - RCRAINFO-MN0000080937, CESQG, RCRIS-MN0000080937, Conditionally Exempt Small Quantity Generators, less than 100 kg/month of hazardous waste (Resource Conservation and Recovery Act (tracking hazardous waste)) - notification
HOLIDAY TRACK EQUIPMENT (11350 XEON in COON RAPIDS, MN)
STATE MASTER (Minnesota Pollution Control Agency permits and compilance tracking) - RCRAINFO-MNR000061986, CESQG, RCRIS-MNR000061986, Conditionally Exempt Small Quantity Generators, less than 100 kg/month of hazardous waste (Resource Conservation and Recovery Act (tracking hazardous waste)) - notification Organizations: BEACH KENNETH (CONTACT/OWNER)
, HOLIDAY TRACK & EQUIPMENT (CONTACT/OWNER)
Alternative names: HOLIDAY TRACK& EQUIPMENT
CHECKER AUTO PARTS 1809 (441 NORTHDALE BLVD in COON RAPIDS, MN)
STATE MASTER (Minnesota Pollution Control Agency permits and compilance tracking) - RCRIS-MNS000106351, CESQG Conditionally Exempt Small Quantity Generators, less than 100 kg/month of hazardous waste (Resource Conservation and Recovery Act (tracking hazardous waste)) Business SIC classification: AUTO AND HOME SUPPLY STORES Business NAICS classification: AUTOMOTIVE PARTS AND ACCESSORIES STORES. Organizations: CSK AUTO INC (CONTACT/OWNER)
CHIROPRACTIC HEALTH SERVICES (11245 FOLEY BLVD NW in COON RAPIDS, MN)
STATE MASTER (Minnesota Pollution Control Agency permits and compilance tracking) - RCRAINFO-MNR000070771, CESQG, RCRIS-MNR000070771, Conditionally Exempt Small Quantity Generators, less than 100 kg/month of hazardous waste (Resource Conservation and Recovery Act (tracking hazardous waste)) - notification Business SIC classification: OFFICES AND CLINICS OF CHIROPRACTORS Business NAICS classification: OFFICES OF CHIROPRACTORS. Organizations: REED KATHLYN (CONTACT/OWNER)
Alternative names: CHIOPRACTIC HEALTH SVCS
STATE MASTER (Minnesota Pollution Control Agency permits and compilance tracking) - RCRAINFO-MND985752039, CESQG, RCRIS-MND985752039, Conditionally Exempt Small Quantity Generators, less than 100 kg/month of hazardous waste (Resource Conservation and Recovery Act (tracking hazardous waste)) - notification Organizations: BARR RODGER (CONTACT/OWNER)
FOLEY DENTAL (11237 FOLEY BLVD in COON RAPIDS, MN)
STATE MASTER (Minnesota Pollution Control Agency permits and compilance tracking) - RCRAINFO-MND985703123, HAZARDOUS WASTE PROGRAM, RCRIS-MND985703123, Conditionally Exempt Small Quantity Generators, less than 100 kg/month of hazardous waste (Resource Conservation and Recovery Act (tracking hazardous waste)) - notification Business SIC classification: HEALTH AND ALLIED SERVICES Organizations: ANDERSON THOMAS AND AUSTIN ROGER E (CONTACT/OWNER)
Housing units lacking complete plumbing facilities: 0.1%
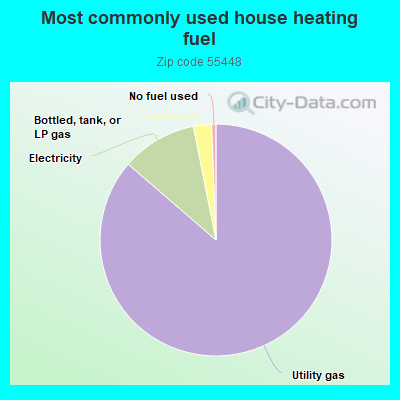
86.0%Utility gas
10.5%Electricity
2.5%Bottled, tank, or LP gas
0.6%No fuel used
Population in 1990: 25,234. Population change in the 1990s: +1,317 (+5.2%).
Place of birth for U.S.-born residents:
This state: 19,633
Northeast: 512
Midwest: 3,806
South: 693
West: 1,214
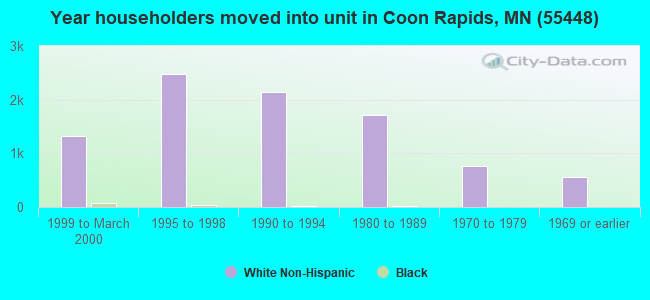
62% of the 55448 zip code residents lived in the same house 5 years ago. Out of people who lived in different houses, 44% lived in this county. Out of people who lived in different counties, 50% lived in Minnesota.
90% of the 55448 zip code residents lived in the same house 1 year ago. Out of people who lived in different houses, 46% moved from this county. Out of people who lived in different houses, 40% moved from different county within same state. Out of people who lived in different houses, 7% moved from different state. Out of people who lived in different houses, 6% moved from abroad.
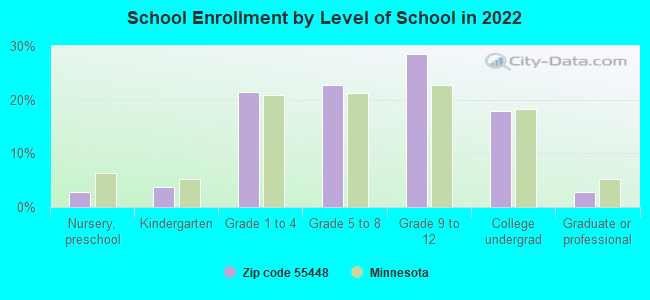
Private vs. public school enrollment:
Students in private schools in grades 1 to 8 (elementary and middle school): 105
Here:
3.6%
Minnesota:
12.9%
Students in private schools in grades 9 to 12 (high school): 85
Here:
4.5%
Minnesota:
8.6%
Students in private undergraduate colleges: 222
Here:
18.7%
Minnesota:
26.2%
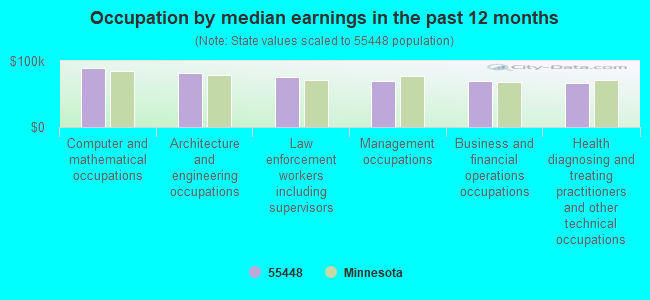
Occupation by median earnings in the past 12 months ($)
89,935Computer and mathematical occupations
81,278Architecture and engineering occupations
75,251Law enforcement workers including supervisors
70,375Management occupations
69,747Business and financial operations occupations
66,839Health diagnosing and treating practitioners and other technical occupations
Companies with federal contracts located in this zip code:
NCC ACQUISITION CORPORATION (11358 KUMQUAT ST NW in COON RAPIDS, MN; small business) : $76,063 in 5 contractsfrom 2001 to 2005
Contracts for Other ADP and Telecommunications Services (includes data storage on tapes, compact disks, etc.), Hazardous Substance Removal, Cleanup, and Disposal Services and Operational Support, Electrical and Electronic Properties Measuring and Testing Instruments, Maintenance, Repair and Rebuilding of Equipment -- Communication, Detection, and Coherent Radiation Equipment by Army, Defense Logistics Agency, Navy Signed by year:2000: $0; 2001: $41,842; 2002: $1,213; 2003: $0; 2004: $0; 2005: $33,008; 2006: $0.
Biggest contracts:
$41,842 with Army for Other ADP and Telecommunications Services (includes data storage on tapes, compact disks, etc.). Taking place in AZ. Signed on 2001-01-11. Completion date: 2001-01-27.
$25,990 with Defense Logistics Agency for Hazardous Substance Removal, Cleanup, and Disposal Services and Operational Support. Signed on 2005-06-07. Completion date: 2005-09-19.
$4,018 with Navy for Electrical and Electronic Properties Measuring and Testing Instruments. Taking place in CO. Signed on 2005-02-03. Completion date: 2005-02-04.
$3,000 with Defense Logistics Agency for Hazardous Substance Removal, Cleanup, and Disposal Services and Operational Support. Signed on 2005-06-07. Completion date: 2005-09-19.
WAAGE, MICHAEL (2275 132ND LANE NW in MINNEAPOLIS, MN; small business) : $26,057 in 4 contractsfrom 2003 to 2004
$21,057 with Air Force for Maintenance, Repair or Alteration of Real Property -- Airport Runways. Signed on 2003-09-30. Completion date: 2003-10-24.
$3,500 with Air Force for Maintenance, Repair or Alteration of Real Property -- Troop Housing Facilities. Signed on 2004-09-29. Completion date: 2004-10-29.
$900, same as above.Signed on 2004-12-09. Completion date: 2004-12-17.
$600, same as above.Signed on 2004-11-23. Completion date: 2004-12-15.
AMERICINN INTERNATIONAL LLC (3430 N DALE BLVD in MINNEAPOLIS, MN; small business)
$7,480 with Army for Lodging - Hotel/Motel. Signed on 2003-12-23. Completion date: 2003-12-15.
SPIRAL MANUFACTURING CO , INC (11419 YELLOW PINE ST NW in MINNEAPOLIS, MN; small business)
$1,421 with Army for Hose, Pipe, Tube, Lubrication, and Railing Fittings. Signed on 2004-07-20. Completion date: 2004-08-09.
Top industries in this zip code by the number of employees in 2005:
2002 - 2018 National Fire Incident Reporting System (NFIRS) incidents
According to the data from the years 2002 - 2018 the average number of fire incidents per year is 52. The highest number of fires - 93 took place in 2006, and the least - 30 in 2009. The data has a dropping trend.
When looking into fire subcategories, the most incidents belonged to: Structure Fires (42.0%), and Outside Fires (32.8%).
Fire incident types reported to NFIRS in Zip Code 55448
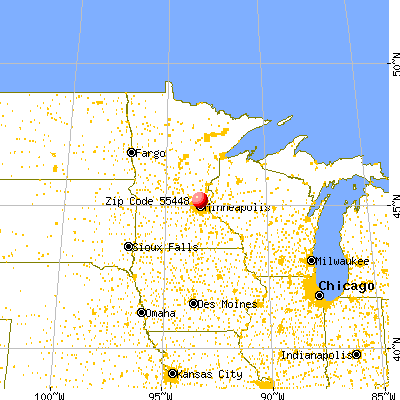


 Nearest zip codes: 55433, 55434, 55304, 55443, 55316, 55444.


 According to the data from the years 2002 - 2018 the average number of fire incidents per year is 52. The highest number of fires - 93 took place in 2006, and the least - 30 in 2009. The data has a dropping trend.
 When looking into fire subcategories, the most incidents belonged to: Structure Fires (42.0%), and Outside Fires (32.8%).