Estimated zip code population in 2022: 34,257 Zip code population in 2010: 33,613 Zip code population in 2000: 34,714
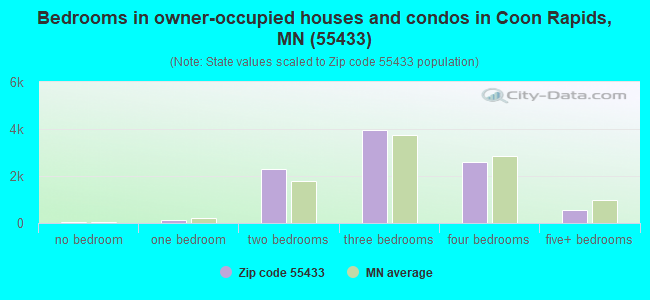
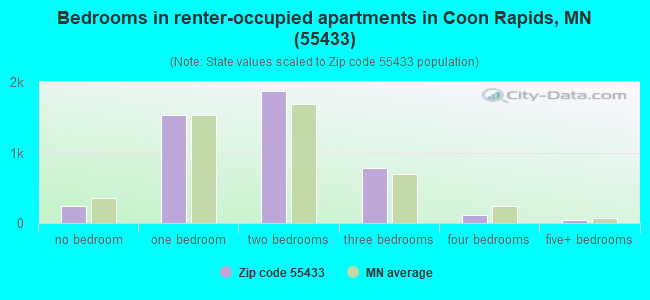
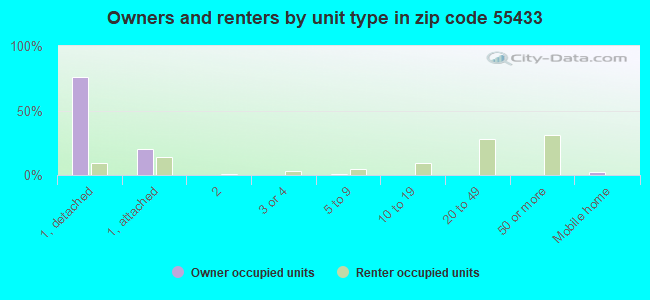
Houses and condos: 14,409 Renter-occupied apartments: 4,587
% of renters here:
32%
State:
28%
March 2022 cost of living index in zip code 55433: 113.7 (more than average, U.S. average is 100)
Land area: 11.6 sq. mi. Water area: 0.6 sq. mi.
Population density: 2,950 people per square mile
(average).
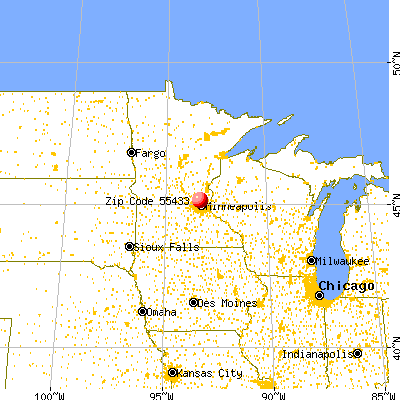
OSM Map
General Map
Google Map
MSN Map
OSM Map
General Map
Google Map
MSN Map
OSM Map
General Map
Google Map
MSN Map
OSM Map
General Map
Google Map
MSN Map
Please wait while loading the map...
Real estate property taxes paid for housing units in 2022:
This zip code:
0.9% ($2,529)
Minnesota:
1.0% ($3,087)
Median real estate property taxes paid for housing units with mortgages in 2022: $2,463 (0.9%) Median real estate property taxes paid for housing units with no mortgage in 2022: $2,626 (0.9%)
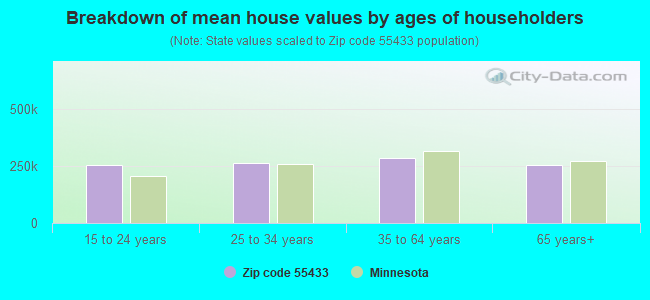
Estimated median house/condo value in 2022: $279,827
55433:
$279,827
Minnesota:
$314,600
According to our research of Minnesota and other state lists, there was 1 registered sex offender living in 55433 zip code as of April 27, 2024. The ratio of all residents to sex offenders in zip code 55433 is 34,921 to 1. The ratio of registered sex offenders to all residents in this zip code is much lower than the state average.
Median resident age:
This zip code:
39.0 years
Minnesota median age:
39.0 years
Average household size:
This zip code:
2.4 people
Minnesota:
2.4 people
Averages for the 2020 tax year for zip code 55433, filed in 2021:
Average Adjusted Gross Income (AGI) in 2020: $56,717 (Individual Income Tax Returns)
Here:
$56,717
State:
$82,178
Salary/wage: $50,546 (reported on 84.7% of returns)
Here:
$50,546
State:
$67,438
(% of AGI for various income ranges: 1138.0% for AGIs below $25k, 3732.0% for AGIs $25k-50k, 6699.2% for AGIs $50k-75k, 10014.3% for AGIs $75k-100k, 18251.6% for AGIs $100k-200k, 62736.2% for AGIs over 200k)
Taxable interest for individuals: $809 (reported on 22.6% of returns)
This zip code:
$809
Minnesota:
$1,814
(% of AGI for various income ranges: 11.9% for AGIs below $25k, 11.9% for AGIs $25k-50k, 18.3% for AGIs $50k-75k, 33.4% for AGIs $75k-100k, 75.8% for AGIs $100k-200k, 653.8% for AGIs over 200k)
Ordinary dividends: $2,630 (reported on 15.1% of returns)
Here:
$2,630
State:
$6,928
(% of AGI for various income ranges: 21.9% for AGIs below $25k, 18.0% for AGIs $25k-50k, 45.4% for AGIs $50k-75k, 86.2% for AGIs $75k-100k, 163.6% for AGIs $100k-200k, 1662.5% for AGIs over 200k)
Net capital gain/loss in AGI: +$9,298 (reported on 12.5% of returns)
Here:
+$9,298
State:
+$20,591
(% of AGI for various income ranges: 9.0% for AGIs below $25k, 14.2% for AGIs $25k-50k, 46.2% for AGIs $50k-75k, 103.8% for AGIs $75k-100k, 347.8% for AGIs $100k-200k, 16753.8% for AGIs over 200k)
Profit/loss from business: +$8,279 (reported on 10.5% of returns)
Here:
+$8,279
State:
+$14,342
(% of AGI for various income ranges: 68.1% for AGIs below $25k, 91.5% for AGIs $25k-50k, 127.0% for AGIs $50k-75k, 141.8% for AGIs $75k-100k, 293.4% for AGIs $100k-200k, 865.0% for AGIs over 200k)
Taxable individual retirement arrangement distribution: $16,265 (reported on 9.4% of returns)
55433:
$16,265
Minnesota:
$20,675
(% of AGI for various income ranges: 81.6% for AGIs below $25k, 97.7% for AGIs $25k-50k, 189.2% for AGIs $50k-75k, 381.2% for AGIs $75k-100k, 685.5% for AGIs $100k-200k, 2926.2% for AGIs over 200k)
Total itemized deductions: $24,173 (reported on 6.8% of returns)
Here:
$24,173
State:
$33,311
(% of AGI for various income ranges: 43.7% for AGIs below $25k, 79.9% for AGIs $25k-50k, 265.2% for AGIs $50k-75k, 473.4% for AGIs $75k-100k, 635.2% for AGIs $100k-200k, 5362.5% for AGIs over 200k)
Charity contributions: $6,930 (reported on 4.8% of returns)
Here:
$6,930
State:
$11,879
(% of AGI for various income ranges: 3.0% for AGIs below $25k, 9.5% for AGIs $25k-50k, 33.1% for AGIs $50k-75k, 69.5% for AGIs $75k-100k, 150.8% for AGIs $100k-200k, 2408.8% for AGIs over 200k)
Taxes paid: $6,856 (reported on 6.8% of returns)
55433:
$6,856
State:
$8,252
(% of AGI for various income ranges: 5.8% for AGIs below $25k, 18.3% for AGIs $25k-50k, 78.0% for AGIs $50k-75k, 160.3% for AGIs $75k-100k, 205.8% for AGIs $100k-200k, 1142.5% for AGIs over 200k)
Earned income credit: $2,164 (reported on 13.3% of returns)
Here:
$2,164
State:
$2,055
(% of AGI for various income ranges: 72.7% for AGIs below $25k, 59.7% for AGIs $25k-50k, 0.8% for AGIs $50k-75k)
Percentage of individuals using paid preparers for their 2020 taxes: 93.0%
Here:
93%
State:
94%
(% for various income ranges: 92.0% for AGIs below $25k, 93.8% for AGIs $25k-50k, 93.6% for AGIs $50k-75k, 92.2% for AGIs $75k-100k, 93.3% for AGIs $100k-200k, 92.3% for AGIs over 200k)
Averages for the 2012 tax year for zip code 55433, filed in 2013:
Average Adjusted Gross Income (AGI) in 2012: $48,413 (Individual Income Tax Returns)
Here:
$48,413
State:
$67,192
Salary/wage: $44,609 (reported on 86.8% of returns)
Here:
$44,609
State:
$55,182
(% of AGI for various income ranges: 76.1% for AGIs below $25k, 83.8% for AGIs $25k-50k, 82.0% for AGIs $50k-75k, 82.2% for AGIs $75k-100k, 81.7% for AGIs $100k-200k, 58.3% for AGIs over 200k)
Taxable interest for individuals: $735 (reported on 27.7% of returns)
This zip code:
$735
Minnesota:
$1,664
(% of AGI for various income ranges: 0.7% for AGIs below $25k, 0.3% for AGIs $25k-50k, 0.4% for AGIs $50k-75k, 0.3% for AGIs $75k-100k, 0.4% for AGIs $100k-200k, 1.1% for AGIs over 200k)
Ordinary dividends: $2,030 (reported on 16.1% of returns)
Here:
$2,030
State:
$5,665
(% of AGI for various income ranges: 0.8% for AGIs below $25k, 0.5% for AGIs $25k-50k, 0.5% for AGIs $50k-75k, 0.5% for AGIs $75k-100k, 0.7% for AGIs $100k-200k, 1.8% for AGIs over 200k)
Net capital gain/loss in AGI: +$4,896 (reported on 10.9% of returns)
Here:
+$4,896
State:
+$16,131
(% of AGI for various income ranges: 0.1% for AGIs $25k-50k, 0.3% for AGIs $50k-75k, 0.5% for AGIs $75k-100k, 0.7% for AGIs $100k-200k, 10.4% for AGIs over 200k)
Profit/loss from business: +$8,374 (reported on 10.3% of returns)
Here:
+$8,374
State:
+$12,430
(% of AGI for various income ranges: 5.0% for AGIs below $25k, 2.0% for AGIs $25k-50k, 1.1% for AGIs $50k-75k, 1.3% for AGIs $75k-100k, 1.2% for AGIs $100k-200k, 2.1% for AGIs over 200k)
Taxable individual retirement arrangement distribution: $13,251 (reported on 9.8% of returns)
55433:
$13,251
Minnesota:
$15,212
(% of AGI for various income ranges: 4.0% for AGIs below $25k, 2.3% for AGIs $25k-50k, 2.2% for AGIs $50k-75k, 2.5% for AGIs $75k-100k, 3.0% for AGIs $100k-200k, 2.8% for AGIs over 200k)
Self-employment retirement plans: $15,400 (reported on 0.2% of returns)
55433:
$15,400
Minnesota:
$17,874
Total itemized deductions: $17,543 (22% of AGI, reported on 36.6% of returns)
Here:
$17,543
State:
$24,665
Here:
21.8% of AGI
State:
19.6% of AGI
(% of AGI for various income ranges: 8.3% for AGIs below $25k, 10.6% for AGIs $25k-50k, 13.6% for AGIs $50k-75k, 14.9% for AGIs $75k-100k, 15.4% for AGIs $100k-200k, 15.2% for AGIs over 200k)
Charity contributions: $2,611 (reported on 29.9% of returns)
Here:
$2,611
State:
$3,948
(% of AGI for various income ranges: 0.8% for AGIs below $25k, 1.0% for AGIs $25k-50k, 1.5% for AGIs $50k-75k, 1.8% for AGIs $75k-100k, 2.0% for AGIs $100k-200k, 3.0% for AGIs over 200k)
Taxes paid: $6,597 (reported on 36.5% of returns)
55433:
$6,597
State:
$10,589
(% of AGI for various income ranges: 1.6% for AGIs below $25k, 3.0% for AGIs $25k-50k, 4.6% for AGIs $50k-75k, 5.5% for AGIs $75k-100k, 6.9% for AGIs $100k-200k, 8.2% for AGIs over 200k)
Earned income credit: $2,005 (reported on 15.4% of returns)
Here:
$2,005
State:
$2,037
(% of AGI for various income ranges: 5.2% for AGIs below $25k, 0.8% for AGIs $25k-50k)
Percentage of individuals using paid preparers for their 2012 taxes: 45.9%
Here:
46%
State:
55%
(% for various income ranges: 39.3% for AGIs below $25k, 46.5% for AGIs $25k-50k, 49.6% for AGIs $50k-75k, 52.0% for AGIs $75k-100k, 54.2% for AGIs $100k-200k, 64.7% for AGIs over 200k)
Averages for the 2004 tax year for zip code 55433, filed in 2005:
Average Adjusted Gross Income (AGI) in 2004: $43,868 (Individual Income Tax Returns)
Here:
$43,868
State:
$53,560
Salary/wage: $40,818 (reported on 90.3% of returns)
Here:
$40,818
State:
$46,177
(% of AGI for various income ranges: 98.1% for AGIs below $10k, 78.4% for AGIs $10k-25k, 87.0% for AGIs $25k-50k, 86.4% for AGIs $50k-75k, 87.5% for AGIs $75k-100k, 75.7% for AGIs over 100k)
Taxable interest for individuals: $986 (reported on 38.9% of returns)
This zip code:
$986
Minnesota:
$1,796
(% of AGI for various income ranges: 2.6% for AGIs below $10k, 1.5% for AGIs $10k-25k, 0.6% for AGIs $25k-50k, 0.6% for AGIs $50k-75k, 0.4% for AGIs $75k-100k, 1.5% for AGIs over 100k)
Taxable dividends: $1,348 (reported on 21.1% of returns)
Here:
$1,348
State:
$3,096
(% of AGI for various income ranges: 1.7% for AGIs below $10k, 0.9% for AGIs $10k-25k, 0.5% for AGIs $25k-50k, 0.5% for AGIs $50k-75k, 0.5% for AGIs $75k-100k, 1.1% for AGIs over 100k)
Net capital gain/loss: +$4,061 (reported on 14.8% of returns)
Here:
+$4,061
State:
+$10,864
(% of AGI for various income ranges: -0.8% for AGIs below $10k, -0.1% for AGIs $10k-25k, 0.1% for AGIs $25k-50k, 0.4% for AGIs $50k-75k, 1.0% for AGIs $75k-100k, 5.0% for AGIs over 100k)
Profit/loss from business: +$7,524 (reported on 11.8% of returns)
Here:
+$7,524
State:
+$10,442
(% of AGI for various income ranges: 6.9% for AGIs below $10k, 4.2% for AGIs $10k-25k, 1.5% for AGIs $25k-50k, 1.8% for AGIs $50k-75k, 1.5% for AGIs $75k-100k, 2.3% for AGIs over 100k)
IRA payment deduction: $2,503 (reported on 1.9% of returns)
55433:
$2,503
Minnesota:
$2,955
(% of AGI for various income ranges: 0.2% for AGIs $10k-25k, 0.2% for AGIs $25k-50k, 0.1% for AGIs $50k-75k, 0.1% for AGIs $75k-100k, 0.0% for AGIs over 100k)
Self-employed pension: $7,870 (reported on 0.4% of returns)
Here:
$7,870
Minnesota:
$12,099
(% of AGI for various income ranges: 0.0% for AGIs $25k-50k, 0.0% for AGIs $50k-75k, 0.1% for AGIs $75k-100k, 0.2% for AGIs over 100k)
Total itemized deductions: $15,733 (23% of AGI, reported on 45.8% of returns)
Here:
$15,733
State:
$20,035
Here:
23.3% of AGI
State:
21.3% of AGI
(% of AGI for various income ranges: 8.9% for AGIs below $10k, 11.8% for AGIs $10k-25k, 15.9% for AGIs $25k-50k, 18.7% for AGIs $50k-75k, 17.6% for AGIs $75k-100k, 15.6% for AGIs over 100k)
Charity contributions deductions: $2,241 (3% of AGI, reported on 40.4% of returns)
Here:
$2,241
State:
$3,333
Here:
3.2% of AGI
State:
3.4% of AGI
(% of AGI for various income ranges: 0.6% for AGIs below $10k, 1.2% for AGIs $10k-25k, 1.6% for AGIs $25k-50k, 2.1% for AGIs $50k-75k, 2.3% for AGIs $75k-100k, 2.7% for AGIs over 100k)
Total tax: $5,360 (reported on 79.6% of returns)
55433:
$5,360
State:
$8,485
(% of AGI for various income ranges: 2.4% for AGIs below $10k, 4.3% for AGIs $10k-25k, 7.1% for AGIs $25k-50k, 8.6% for AGIs $50k-75k, 9.8% for AGIs $75k-100k, 16.4% for AGIs over 100k)
Earned income credit: $1,519 (reported on 11.5% of returns)
Here:
$1,519
State:
$1,523
Percentage of individuals using paid preparers for their 2004 taxes: 51.5%
Here:
52%
State:
59%
(% for various income ranges: 39.7% for AGIs below $10k, 52.8% for AGIs $10k-25k, 53.0% for AGIs $25k-50k, 54.3% for AGIs $50k-75k, 55.1% for AGIs $75k-100k, 59.0% for AGIs over 100k)
Likely homosexual households (counted as self-reported same-sex unmarried-partner households)
Lesbian couples: 0.1% of all households
Gay men: 0.4% of all households
Household received Food Stamps/SNAP in the past 12 months: 1,189 Household did not receive Food Stamps/SNAP in the past 12 months: 13,002
Women who had a birth in the past 12 months: 584 (233 now married, 335 unmarried) Women who did not have a birth in the past 12 months: 7,509 (3,276 now married, 4,233 unmarried)
Housing units in zip code 55433 with a mortgage: 6,406 (616 second mortgage, 8 home equity loan, 368 both second mortgage and home equity loan) Houses without a mortgage: 88
Median monthly owner costs for units with a mortgage: $1,584 Median monthly owner costs for units without a mortgage: $588
Residents with income below the poverty level in 2022:
This zip code:
8.9%
Whole state:
9.6%
Residents with income below 50% of the poverty level in 2022:
This zip code:
5.8%
Whole state:
5.2%
Median number of rooms in houses and condos:
Here:
6.7
State:
7.1
Median number of rooms in apartments:
Here:
3.7
State:
3.8
Notable locations in this zip code not listed on our city pages
Notable locations in zip code 55433: Coon Rapids Fire Department Station 3 (A), Coon Rapids Fire Department Station 1 (B), Crooked Lake Library (C). Display/hide their locations on the map
Shopping Centers: Coon Rapids Family Center Mall Shopping Center (1), Coon Rapids Shopping Center (2), Coon Rapids Square Shopping Center (3), Coon Rapids Village Shopping Center (4), Round Lake Shoppes Shopping Center (5), Springbrook Mall Shopping Center (6), Village Ten Shopping Center (7). Display/hide their locations on the map
Churches in zip code 55433 include: Salvation Army (A), Olive Branch Lutheran Church (B), East River Church (C), Faith Church (D), In the Word Church (E), Grace Gospel Bible Church (F), Epiphany Catholic Church of Coon Rapids (G), Cross of Christ Lutheran Church (H), Coon Rapids United Methodist Church (I). Display/hide their locations on the map
Parks in zip code 55433 include: Flintwood Park (1), Mercy Park (2), Palm Olive Park (3), Prospect Park (4), Riverview Park (5), Vineyard Park (6), Woodcrest Park (7), Coon Rapids Dam Regional Park (8), Thorp Park (9). Display/hide their locations on the map
Tourist attractions (not listed on the city page) : Libraries - Crooked Lake Branch (Cultural Attractions- Events- & Facilities; 11440 Crooked Lake Boulevard Northwest) (1), Lilli Putt (Amusement & Theme Parks; 1349 Coon Rapids Boulevard Northwest) (2), Cheap Skate Inline Center (Amusement & Theme Parks; 3075 Coon Rapids Boulevard Northwest) (3), Pulltab Parlors (3065 Coon Rapids Boulevard Northwest) (4). Display/hide their approximate locations on the map
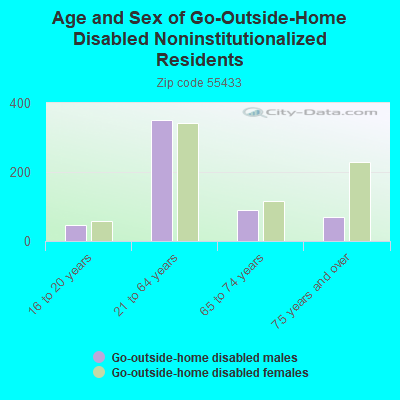
In group quarters: 225 (-1 institutionalized population)
Size of family households: 4,151 2-persons, 1,648 3-persons, 1,407 4-persons, 856 5-persons, 266 6-persons, 180 7-or-more-persons
Size of nonfamily households: 4,351 1-person, 1,251 2-persons, 103 3-persons
4,127 married couples with children.
2,361 single-parent households (633 men, 1,728 women).
90.4% of residents of 55433 zip code speak English at home.
1.3% of residents speak Spanish at home (53% very well, 24% well, 23% not well).
1.8% of residents speak other Indo-European language at home (62% very well, 22% well, 13% not well, 3% not at all).
2.7% of residents speak Asian or Pacific Island language at home (54% very well, 25% well, 16% not well, 5% not at all).
4.0% of residents speak other language at home (67% very well, 27% well, 5% not well).
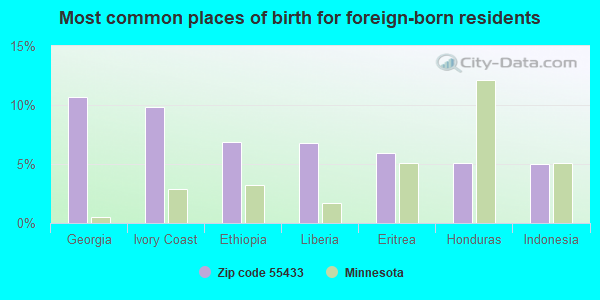
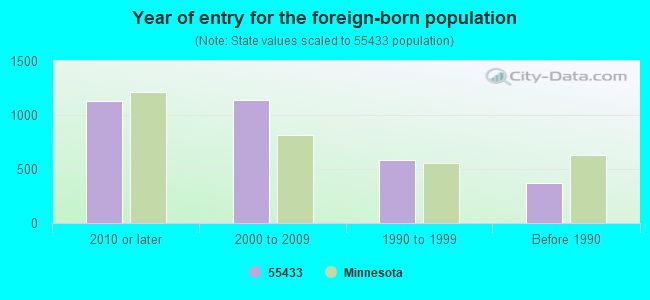
Foreign born population: 3,056 (8.9%) (71.4% of them are naturalized citizens)
AIR MINOR (AIRS/AFS) STATE MASTER (Minnesota Pollution Control Agency permits and compilance tracking) - AIRS-2700300081, AIR PROGRAM, RCRAINFO-MND982070732, LQG, AFS-2700300081, AIR SYNTHETIC MINOR, RCRIS-MND982070732, LQG CRITERIA AND HAZARDOUS AIR POLLUTANT INVENTORY (Inventory of air pollution sources) HAZARDOUS WASTE BIENNIAL REPORTER (Resource Conservation and Recovery Act (tracking hazardous waste)) - ICIS-, ENFORCEMENT/COMPLIANCE ACTIVITY Large Quantity Generators, more that 1000 kg of hazardous waste/month (Resource Conservation and Recovery Act (tracking hazardous waste)) - ICIS-, ENFORCEMENT/COMPLIANCE ACTIVITY TRI REPORTER (Tracking of toxic chemicals releasing facilities) Business SIC classification: SEARCH, DETECTION, NAVIGATION, GUIDANCE, AERONAUTICAL, AND NAUTICAL SYSTEMS AND INSTRUMENTS Business NAICS classification: SEARCH, DETECTION, NAVIGATION, GUIDANCE, AERONAUTICAL, AND NAUTICAL SYSTEM AND INSTRUMENT MANUFACTURING. Organizations: ACTION CONSTRUCTION CO (CONTACT/OWNER)
, HONEYWELL - COMMERCIAL AVIATION PRODUCTS (CONTACT/OWNER)
Alternative names: HONEYWELL INCORPORATED CAS SPO, HONEYWELL INC COMMERCIAL FLIGHT SYSTEMS, HONEYWELL AEROSPACE COON RAPIDS, HONEYWELL AT-CAP, HONEYWELL CES-MSP
NORTHDALE MIDDLEBROOK JR HIGH (11301 DOGWOOD ST NW in COON RAPIDS, MN)
STATE MASTER (Minnesota Pollution Control Agency permits and compilance tracking) - RCRAINFO-MND100323187, HAZARDOUS WASTE PROGRAM, RCRIS-MND100323187, (National Center for Education Statistics) - STATE ID-010011090 Conditionally Exempt Small Quantity Generators, less than 100 kg/month of hazardous waste (Resource Conservation and Recovery Act (tracking hazardous waste)) - notification Organizations: ANOKA HENNEPIN ISD II (CONTACT/OWNER)
, ANOKA-HENNEPIN (SCHOOL DISTRICT)
MIDWEST FINISHING INC (9289 EVERGREEN BLVD. in COON RAPIDS, MN)
HAZARDOUS WASTE BIENNIAL REPORTER (Resource Conservation and Recovery Act (tracking hazardous waste)) - ICIS-, ENFORCEMENT/COMPLIANCE ACTIVITY (Resource Conservation and Recovery Act (tracking hazardous waste)) - ICIS-, ENFORCEMENT/COMPLIANCE ACTIVITY TRI REPORTER (Tracking of toxic chemicals releasing facilities) Business SIC classification: ELECTROPLATING, PLATING, POLISHING, ANODIZING, AND COLORING
ALUMIPLATE INC (8960 SPRINGBROOK DR STE 105 in COON RAPIDS, MN)
STATE MASTER (Minnesota Pollution Control Agency permits and compilance tracking) - AIRS-2700300165, AIR PROGRAM, AFS-2700300165, AIR SYNTHETIC MINOR, RCRIS-MN0000448613, LQG CRITERIA AND HAZARDOUS AIR POLLUTANT INVENTORY (Inventory of air pollution sources) HAZARDOUS WASTE BIENNIAL REPORTER (Resource Conservation and Recovery Act (tracking hazardous waste)) Large Quantity Generators, more that 1000 kg of hazardous waste/month (Resource Conservation and Recovery Act (tracking hazardous waste)) TRI REPORTER (Tracking of toxic chemicals releasing facilities) Business SIC and NAICS classification: ELECTROPLATING, PLATING, POLISHING, ANODIZING, AND COLORING
NORTH COUNTRY FORD (3401 COON RAPIDS BOULEVARD in COON RAPIDS, MN)
STATE MASTER (Minnesota Pollution Control Agency permits and compilance tracking) - RCRAINFO-MND981091176, CESQG, RCRIS-MND981091176, (Resource Conservation and Recovery Act (tracking hazardous waste)) Organizations: ANOKA MOTORS LLC (CONTACT/OWNER)
, UHAUL OF MINNESOTA (CONTACT/OWNER)
, U-HAUL OF MINNESOTA (CONTACT/OWNER)
Alternative names: UHAUL - COON RAPIDS RERS
GREEN BAY PACKAGING INC TWIN TOWN DIV (555 87TH LANE NW in COON RAPIDS, MN)
STATE MASTER (Minnesota Pollution Control Agency permits and compilance tracking) - AIRS-2700300140, AIR PROGRAM, RCRAINFO-MNR000000067, CESQG, PCS-A00001449, GENERAL PERMIT STORM WATER IND, AFS-2700300140, AIR SYNTHETIC MINOR, PCS-A00001449, NPDES STORMWATER PERMIT, RCRIS-MNR000000067, CESQG CRITERIA AND HAZARDOUS AIR POLLUTANT INVENTORY (Inventory of air pollution sources) National Pollutant Discharge Elimination System NON-MAJOR (Tracking pollutant discharge elimination systems) - permit Conditionally Exempt Small Quantity Generators, less than 100 kg/month of hazardous waste (Resource Conservation and Recovery Act (tracking hazardous waste)) - notification Business SIC classification: CORRUGATED AND SOLID FIBER BOXES Business NAICS classification: CORRUGATED AND SOLID FIBER BOX MANUFACTURING. Alternative names: GREEN BAY PACKAGING INC - COON RAPIDS
ABRA AUTO BODY AND GLASS (11585 ROBINSON DR in COON RAPIDS, MN)
AIR MINOR (AIRS/AFS) STATE MASTER (Minnesota Pollution Control Agency permits and compilance tracking) - AIRS-2700300230, AIR PROGRAM, RCRAINFO-MNR000061937, CESQG, AFS-2700300230, AIR SYNTHETIC MINOR, RCRIS-MNR000061937, SQG Conditionally Exempt Small Quantity Generators, less than 100 kg/month of hazardous waste (Resource Conservation and Recovery Act (tracking hazardous waste)) - notification Business SIC classification: TOP, BODY, AND UPHOLSTERY REPAIR SHOPS AND PAINT SHOPS Business NAICS classification: AUTOMOTIVE BODY, PAINT, AND INTERIOR REPAIR AND MAINTENANCE. Organizations: STOWE ALLEN (CONTACT/OWNER)
, ABRA AUTO BODY & GLASS (CONTACT/OWNER)
Alternative names: ABRA AUTO BODY & GLASS - COON RAPIDS
STATE MASTER (Minnesota Pollution Control Agency permits and compilance tracking) - RCRAINFO-MND981537103, HAZARDOUS WASTE PROGRAM, RCRIS-MND981537103, (Resource Conservation and Recovery Act (tracking hazardous waste)) Organizations: M AND J INDUSTRIES INC (CONTACT/OWNER)
Alternative names: COON RAPIDS AMOCO CERTICARE
EXCEL MARINE & MOTOR SPORTS (3050 COON RAPIDS BLVD in COON RAPIDS, MN)
STATE MASTER (Minnesota Pollution Control Agency permits and compilance tracking) - RCRAINFO-MNR000080457, CESQG, RCRIS-MNR000080457, Small Quantity Generators, between 100 kg and 1000 kg of hazardous waste/month (Resource Conservation and Recovery Act (tracking hazardous waste)) - notification Conditionally Exempt Small Quantity Generators, less than 100 kg/month of hazardous waste (Resource Conservation and Recovery Act (tracking hazardous waste)) - notification Business SIC and NAICS classification: MARINAS Organizations: DOUGLAS HOUGH (CONTACT/OWNER)
Alternative names: EXCEL MOTOR SPORTS, RAPID SPORT CTR INC
FANNIE MAE COON RAPIDS (3834 114TH LN NW in COON RAPIDS, MN)
STATE MASTER (Minnesota Pollution Control Agency permits and compilance tracking) - RCRAINFO-MN0000119214, CESQG, RCRIS-MN0000119214, (Resource Conservation and Recovery Act (tracking hazardous waste))
GRETEMAN BRIAN J DPM (2520 COON RAPIDS BLVD STE 110 in COON RAPIDS, MN)
STATE MASTER (Minnesota Pollution Control Agency permits and compilance tracking) - RCRAINFO-MNR000070763, CESQG, RCRIS-MNR000070763, (Resource Conservation and Recovery Act (tracking hazardous waste)) Organizations: GRETEMAN BRIAN J DPM PA (CONTACT/OWNER)
GLIDDEN CO (2160 NORTHDALE BLVD in COON RAPIDS, MN)
STATE MASTER (Minnesota Pollution Control Agency permits and compilance tracking) - RCRIS-MNR000112177, LQG (Resource Conservation and Recovery Act (tracking hazardous waste)) Organizations: THE GLIDDEN CO (CONTACT/OWNER)
Alternative names: ICI DULUX PAINTS#354
OAK PARK STANDARD (10938 UNIVERSITY AVE NW in COON RAPIDS, MN)
STATE MASTER (Minnesota Pollution Control Agency permits and compilance tracking) - RCRAINFO-MND985704154, HAZARDOUS WASTE PROGRAM, RCRIS-MND985704154, CESQG (Resource Conservation and Recovery Act (tracking hazardous waste)) Business SIC classification: GASOLINE SERVICE STATIONS Business NAICS classification: GASOLINE STATIONS WITH CONVENIENCE STORES. Organizations: V & P STANDARD INC (CONTACT/OWNER)
, NORTHDALE UNIVERSITY LLC (CONTACT/OWNER)
Housing units lacking complete plumbing facilities: 0.1% Housing units lacking complete kitchen facilities: 0.2%
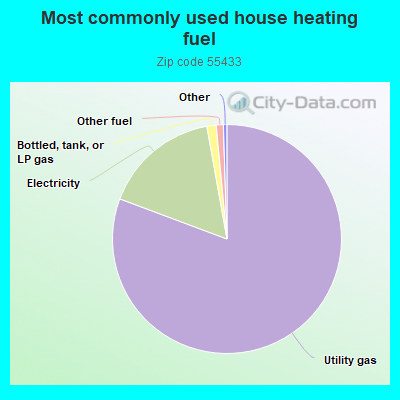
80.7%Utility gas
16.5%Electricity
1.3%Bottled, tank, or LP gas
1.0%Other fuel
Population in 1990: 27,580. Population change in the 1990s: +7,134 (+25.9%).
Place of birth for U.S.-born residents:
This state: 24,187
Northeast: 835
Midwest: 4,169
South: 615
West: 1,181
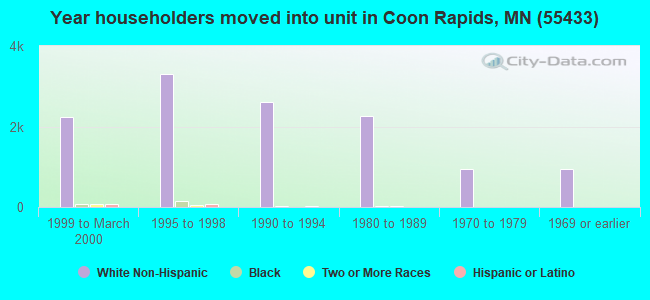
58% of the 55433 zip code residents lived in the same house 5 years ago. Out of people who lived in different houses, 45% lived in this county. Out of people who lived in different counties, 50% lived in Minnesota.
88% of the 55433 zip code residents lived in the same house 1 year ago. Out of people who lived in different houses, 35% moved from this county. Out of people who lived in different houses, 55% moved from different county within same state. Out of people who lived in different houses, 6% moved from different state. Out of people who lived in different houses, 3% moved from abroad.
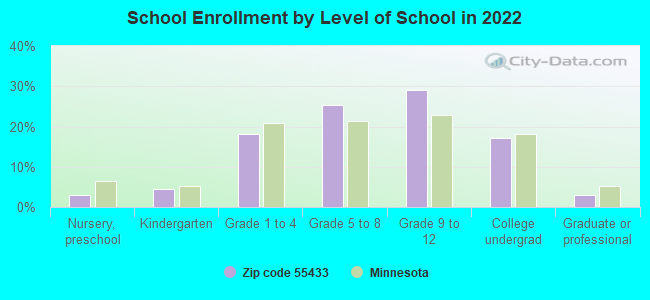
Private vs. public school enrollment:
Students in private schools in grades 1 to 8 (elementary and middle school): 252
Here:
8.3%
Minnesota:
12.9%
Students in private schools in grades 9 to 12 (high school): 121
Here:
5.9%
Minnesota:
8.6%
Students in private undergraduate colleges: 118
Here:
10.1%
Minnesota:
26.2%
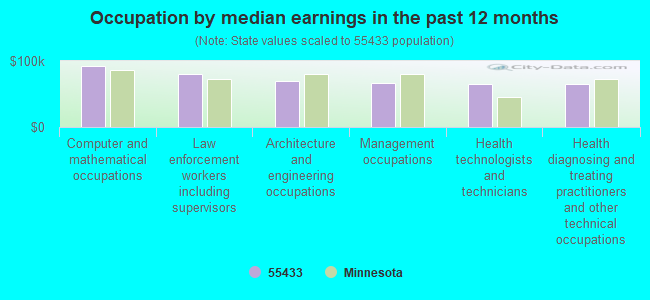
Occupation by median earnings in the past 12 months ($)
91,851Computer and mathematical occupations
79,987Law enforcement workers including supervisors
69,333Architecture and engineering occupations
65,938Management occupations
65,287Health technologists and technicians
65,206Health diagnosing and treating practitioners and other technical occupations
Companies with federal contracts located in this zip code (MINNEAPOLIS, MN):
NORTH CITIES HEALTH CARE INC (9899 NW AOCET ST) 210 employees, $6829406 revenue: $992,809 in 22 contractsfrom 1999 to 2005
Contracts for Nursing Home Care Contracts by Department of Veterans Affairs Signed by year:2000: $50,000; 2001: $27,000; 2002: $148,426; 2003: $405,355; 2004: $221,769; 2005: $101,259; 2006: $0.
Biggest contracts:
$101,259 with Department of Veterans Affairs for Nursing Home Care Contracts. Signed on 2005-10-01. Effective on 2006-04-01. Completion date: 2006-06-30.
$81,800, same as above.Signed on 2004-10-01. Completion date: 2004-12-31.
$71,773, same as above.Signed on 2003-10-01. Effective on 2004-04-01. Completion date: 2004-06-30.
$63,000, same as above.Signed on 2002-06-15. Completion date: 2002-09-15.
INTEGRIS METALS, INC (455 85TH AVE NW; small business) : $68,087 in 6 contractsfrom 2001 to 2005
Contracts for Plate, Sheet, Strip, and Foil; Nonferrous Base Metal by Bureau of Prisoners/Federal Prison System, U.S. Army Corps of Engineers - civil program financing only, Army Signed by year:2000: $0; 2001: $6,562; 2002: $0; 2003: $0; 2004: $37,150; 2005: $24,375; 2006: $0.
Biggest contracts:
$24,375 with Bureau of Prisoners/Federal Prison System for Plate, Sheet, Strip, and Foil; Nonferrous Base Metal. Taking place in IN. Signed on 2005-08-09. Completion date: 2005-08-18.
$18,779 with U.S. Army Corps of Engineers - civil program financing only for Plate, Sheet, Strip, and Foil; Nonferrous Base Metal. Taking place in TN. Signed on 2004-07-22. Completion date: 2004-07-26.
$18,779 with Army for Plate, Sheet, Strip, and Foil; Nonferrous Base Metal. Taking place in TN. Signed on 2004-07-22. Completion date: 2004-07-26.
$6,562 with Army for Plate, Sheet, Strip, and Foil; Nonferrous Base Metal. Taking place in AR. Signed on 2001-11-26. Completion date: 2001-12-07.
AVANTA ORTHOPAEDICS, INC (8600 EVERGREEN BLVD; small business) : $48,612 in 17 contractsfrom 2002 to 2006
Contracts for Medical and Surgical Instruments, Equipment, and Supplies by Air Force, Navy, Army Signed by year:2000: $0; 2001: $0; 2002: $30,400; 2003: $7,850; 2004: $12,500; 2005: $6,032; 2006: -$8,170.
Biggest contracts:
$30,400 with Air Force for Medical and Surgical Instruments, Equipment, and Supplies. Taking place in CA. Signed on 2002-11-06. Completion date: 2002-11-07.
$5,600 with Navy for Medical and Surgical Instruments, Equipment, and Supplies. Taking place in CA. Signed on 2004-05-07. Completion date: 2004-05-10.
$4,000, same as above.Signed on 2004-07-14. Completion date: 2004-07-14.
$4,000, same as above.Signed on 2003-12-01. Completion date: 2003-10-01.
INTEGRIS METALS INC (455 85TH AVE NW; small business) : $22,214 in 3 contractsfrom 2002 to 2003
$13,558 with U.S. Army Corps of Engineers - civil program financing only for Miscellaneous Prefabricated Structures. Taking place in SD. Signed on 2002-09-27. Completion date: 2002-09-19.
$7,656 with U.S. Army Corps of Engineers - civil program financing only for Plate, Sheet, Strip, Foil; and Leaf. Taking place in SD. Signed on 2003-09-19. Completion date: 2003-09-11.
$1,000 with U.S. Army Corps of Engineers - civil program financing only for Miscellaneous Prefabricated Structures. Taking place in SD. Signed on 2002-09-27. Completion date: 2002-09-19.
HONEYWELL INTERNATIONAL INC (8840 EVERGREEN BLVD) : $10,673 in 2 contractsin 2006
$23,800 with Air Force for Maintenance, Repair and Rebuilding of Equipment -- Instruments and Laboratory Equipment. Signed on 2006-05-08. Completion date: 2006-06-12.
-$13,127, same as above.Signed on 2006-05-24. Completion date: 2006-06-12.
JAMES STOLIS (11643 YUKON ST; small business)
$7,500 with Defense Logistics Agency for Miscellaneous Alarm, Signal and Security Detection Systems. Signed on 2005-01-19. Completion date: 2005-02-11.
ARROW TANK & ENGINEERING CO (8950 EVERGREEN BLVD NW; small business) : $6,520 in 2 contractsfrom 2002 to 2004
$3,600 with Army for Valves, Nonpowered. Signed on 2004-05-18. Completion date: 2004-06-30.
$2,920 with Army for Storage Tanks. Signed on 2002-12-05. Completion date: 2003-01-03.
Top industries in this zip code by the number of employees in 2005:
Health Care and Social Assistance: General Medical and Surgical Hospitals (over 1000 employees: 1 establishment)
Health Care and Social Assistance: Offices of Physicians (except Mental Health Specialists) (250-499: 1, 100-249: 1, 50-99: 1, 20-49: 7, 5-9: 5, 1-4: 10)
2002 - 2018 National Fire Incident Reporting System (NFIRS) incidents
Based on the data from the years 2002 - 2018 the average number of fire incidents per year is 82. The highest number of reported fire incidents - 113 took place in 2003, and the least - 55 in 2008. The data has a declining trend.
When looking into fire subcategories, the most reports belonged to: Structure Fires (47.8%), and Outside Fires (29.2%).
Fire incident types reported to NFIRS in Zip Code 55433


 Nearest zip codes: 55448, 55443, 55444, 55434, 55316, 55445.


 Based on the data from the years 2002 - 2018 the average number of fire incidents per year is 82. The highest number of reported fire incidents - 113 took place in 2003, and the least - 55 in 2008. The data has a declining trend.
 When looking into fire subcategories, the most reports belonged to: Structure Fires (47.8%), and Outside Fires (29.2%).