Coon Rapids, Minnesota Submit your own pictures of this city and show them to the world
OSM Map
General Map
Google Map
MSN Map
OSM Map
General Map
Google Map
MSN Map
OSM Map
General Map
Google Map
MSN Map
OSM Map
General Map
Google Map
MSN Map
Please wait while loading the map...
Population in 2022: 62,785 (100% urban, 0% rural). Population change since 2000: +1.9%Males: 31,443 Females: 31,342
March 2022 cost of living index in Coon Rapids: 113.9 (more than average, U.S. average is 100) Percentage of residents living in poverty in 2022: 7.7%for White Non-Hispanic residents , 18.6% for Black residents , 10.3% for Hispanic or Latino residents , 12.6% for American Indian residents , 5.7% for other race residents , 16.4% for two or more races residents )
Profiles of local businesses
Business Search - 14 Million verified businesses
Data:
Median household income ($)
Median household income (% change since 2000)
Household income diversity
Ratio of average income to average house value (%)
Ratio of average income to average rent
Median household income ($) - White
Median household income ($) - Black or African American
Median household income ($) - Asian
Median household income ($) - Hispanic or Latino
Median household income ($) - American Indian and Alaska Native
Median household income ($) - Multirace
Median household income ($) - Other Race
Median household income for houses/condos with a mortgage ($)
Median household income for apartments without a mortgage ($)
Races - White alone (%)
Races - White alone (% change since 2000)
Races - Black alone (%)
Races - Black alone (% change since 2000)
Races - American Indian alone (%)
Races - American Indian alone (% change since 2000)
Races - Asian alone (%)
Races - Asian alone (% change since 2000)
Races - Hispanic (%)
Races - Hispanic (% change since 2000)
Races - Native Hawaiian and Other Pacific Islander alone (%)
Races - Native Hawaiian and Other Pacific Islander alone (% change since 2000)
Races - Two or more races (%)
Races - Two or more races (% change since 2000)
Races - Other race alone (%)
Races - Other race alone (% change since 2000)
Racial diversity
Unemployment (%)
Unemployment (% change since 2000)
Unemployment (%) - White
Unemployment (%) - Black or African American
Unemployment (%) - Asian
Unemployment (%) - Hispanic or Latino
Unemployment (%) - American Indian and Alaska Native
Unemployment (%) - Multirace
Unemployment (%) - Other Race
Population density (people per square mile)
Population - Males (%)
Population - Females (%)
Population - Males (%) - White
Population - Males (%) - Black or African American
Population - Males (%) - Asian
Population - Males (%) - Hispanic or Latino
Population - Males (%) - American Indian and Alaska Native
Population - Males (%) - Multirace
Population - Males (%) - Other Race
Population - Females (%) - White
Population - Females (%) - Black or African American
Population - Females (%) - Asian
Population - Females (%) - Hispanic or Latino
Population - Females (%) - American Indian and Alaska Native
Population - Females (%) - Multirace
Population - Females (%) - Other Race
Coronavirus confirmed cases (Apr 27, 2024)
Deaths caused by coronavirus (Apr 27, 2024)
Coronavirus confirmed cases (per 100k population) (Apr 27, 2024)
Deaths caused by coronavirus (per 100k population) (Apr 27, 2024)
Daily increase in number of cases (Apr 27, 2024)
Weekly increase in number of cases (Apr 27, 2024)
Cases doubled (in days) (Apr 27, 2024)
Hospitalized patients (Apr 18, 2022)
Negative test results (Apr 18, 2022)
Total test results (Apr 18, 2022)
COVID Vaccine doses distributed (per 100k population) (Sep 19, 2023)
COVID Vaccine doses administered (per 100k population) (Sep 19, 2023)
COVID Vaccine doses distributed (Sep 19, 2023)
COVID Vaccine doses administered (Sep 19, 2023)
Likely homosexual households (%)
Likely homosexual households (% change since 2000)
Likely homosexual households - Lesbian couples (%)
Likely homosexual households - Lesbian couples (% change since 2000)
Likely homosexual households - Gay men (%)
Likely homosexual households - Gay men (% change since 2000)
Cost of living index
Median gross rent ($)
Median contract rent ($)
Median monthly housing costs ($)
Median house or condo value ($)
Median house or condo value ($ change since 2000)
Mean house or condo value by units in structure - 1, detached ($)
Mean house or condo value by units in structure - 1, attached ($)
Mean house or condo value by units in structure - 2 ($)
Mean house or condo value by units in structure by units in structure - 3 or 4 ($)
Mean house or condo value by units in structure - 5 or more ($)
Mean house or condo value by units in structure - Boat, RV, van, etc. ($)
Mean house or condo value by units in structure - Mobile home ($)
Median house or condo value ($) - White
Median house or condo value ($) - Black or African American
Median house or condo value ($) - Asian
Median house or condo value ($) - Hispanic or Latino
Median house or condo value ($) - American Indian and Alaska Native
Median house or condo value ($) - Multirace
Median house or condo value ($) - Other Race
Median resident age
Resident age diversity
Median resident age - Males
Median resident age - Females
Median resident age - White
Median resident age - Black or African American
Median resident age - Asian
Median resident age - Hispanic or Latino
Median resident age - American Indian and Alaska Native
Median resident age - Multirace
Median resident age - Other Race
Median resident age - Males - White
Median resident age - Males - Black or African American
Median resident age - Males - Asian
Median resident age - Males - Hispanic or Latino
Median resident age - Males - American Indian and Alaska Native
Median resident age - Males - Multirace
Median resident age - Males - Other Race
Median resident age - Females - White
Median resident age - Females - Black or African American
Median resident age - Females - Asian
Median resident age - Females - Hispanic or Latino
Median resident age - Females - American Indian and Alaska Native
Median resident age - Females - Multirace
Median resident age - Females - Other Race
Commute - mean travel time to work (minutes)
Travel time to work - Less than 5 minutes (%)
Travel time to work - Less than 5 minutes (% change since 2000)
Travel time to work - 5 to 9 minutes (%)
Travel time to work - 5 to 9 minutes (% change since 2000)
Travel time to work - 10 to 19 minutes (%)
Travel time to work - 10 to 19 minutes (% change since 2000)
Travel time to work - 20 to 29 minutes (%)
Travel time to work - 20 to 29 minutes (% change since 2000)
Travel time to work - 30 to 39 minutes (%)
Travel time to work - 30 to 39 minutes (% change since 2000)
Travel time to work - 40 to 59 minutes (%)
Travel time to work - 40 to 59 minutes (% change since 2000)
Travel time to work - 60 to 89 minutes (%)
Travel time to work - 60 to 89 minutes (% change since 2000)
Travel time to work - 90 or more minutes (%)
Travel time to work - 90 or more minutes (% change since 2000)
Marital status - Never married (%)
Marital status - Now married (%)
Marital status - Separated (%)
Marital status - Widowed (%)
Marital status - Divorced (%)
Median family income ($)
Median family income (% change since 2000)
Median non-family income ($)
Median non-family income (% change since 2000)
Median per capita income ($)
Median per capita income (% change since 2000)
Median family income ($) - White
Median family income ($) - Black or African American
Median family income ($) - Asian
Median family income ($) - Hispanic or Latino
Median family income ($) - American Indian and Alaska Native
Median family income ($) - Multirace
Median family income ($) - Other Race
Median year house/condo built
Median year apartment built
Year house built - Built 2005 or later (%)
Year house built - Built 2000 to 2004 (%)
Year house built - Built 1990 to 1999 (%)
Year house built - Built 1980 to 1989 (%)
Year house built - Built 1970 to 1979 (%)
Year house built - Built 1960 to 1969 (%)
Year house built - Built 1950 to 1959 (%)
Year house built - Built 1940 to 1949 (%)
Year house built - Built 1939 or earlier (%)
Average household size
Household density (households per square mile)
Average household size - White
Average household size - Black or African American
Average household size - Asian
Average household size - Hispanic or Latino
Average household size - American Indian and Alaska Native
Average household size - Multirace
Average household size - Other Race
Occupied housing units (%)
Vacant housing units (%)
Owner occupied housing units (%)
Renter occupied housing units (%)
Vacancy status - For rent (%)
Vacancy status - For sale only (%)
Vacancy status - Rented or sold, not occupied (%)
Vacancy status - For seasonal, recreational, or occasional use (%)
Vacancy status - For migrant workers (%)
Vacancy status - Other vacant (%)
Residents with income below the poverty level (%)
Residents with income below 50% of the poverty level (%)
Children below poverty level (%)
Poor families by family type - Married-couple family (%)
Poor families by family type - Male, no wife present (%)
Poor families by family type - Female, no husband present (%)
Poverty status for native-born residents (%)
Poverty status for foreign-born residents (%)
Poverty among high school graduates not in families (%)
Poverty among people who did not graduate high school not in families (%)
Residents with income below the poverty level (%) - White
Residents with income below the poverty level (%) - Black or African American
Residents with income below the poverty level (%) - Asian
Residents with income below the poverty level (%) - Hispanic or Latino
Residents with income below the poverty level (%) - American Indian and Alaska Native
Residents with income below the poverty level (%) - Multirace
Residents with income below the poverty level (%) - Other Race
Air pollution - Air Quality Index (AQI)
Air pollution - CO
Air pollution - NO2
Air pollution - SO2
Air pollution - Ozone
Air pollution - PM10
Air pollution - PM25
Air pollution - Pb
Crime - Murders per 100,000 population
Crime - Rapes per 100,000 population
Crime - Robberies per 100,000 population
Crime - Assaults per 100,000 population
Crime - Burglaries per 100,000 population
Crime - Thefts per 100,000 population
Crime - Auto thefts per 100,000 population
Crime - Arson per 100,000 population
Crime - City-data.com crime index
Crime - Violent crime index
Crime - Property crime index
Crime - Murders per 100,000 population (5 year average)
Crime - Rapes per 100,000 population (5 year average)
Crime - Robberies per 100,000 population (5 year average)
Crime - Assaults per 100,000 population (5 year average)
Crime - Burglaries per 100,000 population (5 year average)
Crime - Thefts per 100,000 population (5 year average)
Crime - Auto thefts per 100,000 population (5 year average)
Crime - Arson per 100,000 population (5 year average)
Crime - City-data.com crime index (5 year average)
Crime - Violent crime index (5 year average)
Crime - Property crime index (5 year average)
1996 Presidential Elections Results (%) - Democratic Party (Clinton)
1996 Presidential Elections Results (%) - Republican Party (Dole)
1996 Presidential Elections Results (%) - Other
2000 Presidential Elections Results (%) - Democratic Party (Gore)
2000 Presidential Elections Results (%) - Republican Party (Bush)
2000 Presidential Elections Results (%) - Other
2004 Presidential Elections Results (%) - Democratic Party (Kerry)
2004 Presidential Elections Results (%) - Republican Party (Bush)
2004 Presidential Elections Results (%) - Other
2008 Presidential Elections Results (%) - Democratic Party (Obama)
2008 Presidential Elections Results (%) - Republican Party (McCain)
2008 Presidential Elections Results (%) - Other
2012 Presidential Elections Results (%) - Democratic Party (Obama)
2012 Presidential Elections Results (%) - Republican Party (Romney)
2012 Presidential Elections Results (%) - Other
2016 Presidential Elections Results (%) - Democratic Party (Clinton)
2016 Presidential Elections Results (%) - Republican Party (Trump)
2016 Presidential Elections Results (%) - Other
2020 Presidential Elections Results (%) - Democratic Party (Biden)
2020 Presidential Elections Results (%) - Republican Party (Trump)
2020 Presidential Elections Results (%) - Other
Ancestries Reported - Arab (%)
Ancestries Reported - Czech (%)
Ancestries Reported - Danish (%)
Ancestries Reported - Dutch (%)
Ancestries Reported - English (%)
Ancestries Reported - French (%)
Ancestries Reported - French Canadian (%)
Ancestries Reported - German (%)
Ancestries Reported - Greek (%)
Ancestries Reported - Hungarian (%)
Ancestries Reported - Irish (%)
Ancestries Reported - Italian (%)
Ancestries Reported - Lithuanian (%)
Ancestries Reported - Norwegian (%)
Ancestries Reported - Polish (%)
Ancestries Reported - Portuguese (%)
Ancestries Reported - Russian (%)
Ancestries Reported - Scotch-Irish (%)
Ancestries Reported - Scottish (%)
Ancestries Reported - Slovak (%)
Ancestries Reported - Subsaharan African (%)
Ancestries Reported - Swedish (%)
Ancestries Reported - Swiss (%)
Ancestries Reported - Ukrainian (%)
Ancestries Reported - United States (%)
Ancestries Reported - Welsh (%)
Ancestries Reported - West Indian (%)
Ancestries Reported - Other (%)
Educational Attainment - No schooling completed (%)
Educational Attainment - Less than high school (%)
Educational Attainment - High school or equivalent (%)
Educational Attainment - Less than 1 year of college (%)
Educational Attainment - 1 or more years of college (%)
Educational Attainment - Associate degree (%)
Educational Attainment - Bachelor's degree (%)
Educational Attainment - Master's degree (%)
Educational Attainment - Professional school degree (%)
Educational Attainment - Doctorate degree (%)
School Enrollment - Nursery, preschool (%)
School Enrollment - Kindergarten (%)
School Enrollment - Grade 1 to 4 (%)
School Enrollment - Grade 5 to 8 (%)
School Enrollment - Grade 9 to 12 (%)
School Enrollment - College undergrad (%)
School Enrollment - Graduate or professional (%)
School Enrollment - Not enrolled in school (%)
School enrollment - Public schools (%)
School enrollment - Private schools (%)
School enrollment - Not enrolled (%)
Median number of rooms in houses and condos
Median number of rooms in apartments
Housing units lacking complete plumbing facilities (%)
Housing units lacking complete kitchen facilities (%)
Density of houses
Urban houses (%)
Rural houses (%)
Households with people 60 years and over (%)
Households with people 65 years and over (%)
Households with people 75 years and over (%)
Households with one or more nonrelatives (%)
Households with no nonrelatives (%)
Population in households (%)
Family households (%)
Nonfamily households (%)
Population in families (%)
Family households with own children (%)
Median number of bedrooms in owner occupied houses
Mean number of bedrooms in owner occupied houses
Median number of bedrooms in renter occupied houses
Mean number of bedrooms in renter occupied houses
Median number of vehichles in owner occupied houses
Mean number of vehichles in owner occupied houses
Median number of vehichles in renter occupied houses
Mean number of vehichles in renter occupied houses
Mortgage status - with mortgage (%)
Mortgage status - with second mortgage (%)
Mortgage status - with home equity loan (%)
Mortgage status - with both second mortgage and home equity loan (%)
Mortgage status - without a mortgage (%)
Average family size
Average family size - White
Average family size - Black or African American
Average family size - Asian
Average family size - Hispanic or Latino
Average family size - American Indian and Alaska Native
Average family size - Multirace
Average family size - Other Race
Geographical mobility - Same house 1 year ago (%)
Geographical mobility - Moved within same county (%)
Geographical mobility - Moved from different county within same state (%)
Geographical mobility - Moved from different state (%)
Geographical mobility - Moved from abroad (%)
Place of birth - Born in state of residence (%)
Place of birth - Born in other state (%)
Place of birth - Native, outside of US (%)
Place of birth - Foreign born (%)
Housing units in structures - 1, detached (%)
Housing units in structures - 1, attached (%)
Housing units in structures - 2 (%)
Housing units in structures - 3 or 4 (%)
Housing units in structures - 5 to 9 (%)
Housing units in structures - 10 to 19 (%)
Housing units in structures - 20 to 49 (%)
Housing units in structures - 50 or more (%)
Housing units in structures - Mobile home (%)
Housing units in structures - Boat, RV, van, etc. (%)
House/condo owner moved in on average (years ago)
Renter moved in on average (years ago)
Year householder moved into unit - Moved in 1999 to March 2000 (%)
Year householder moved into unit - Moved in 1995 to 1998 (%)
Year householder moved into unit - Moved in 1990 to 1994 (%)
Year householder moved into unit - Moved in 1980 to 1989 (%)
Year householder moved into unit - Moved in 1970 to 1979 (%)
Year householder moved into unit - Moved in 1969 or earlier (%)
Means of transportation to work - Drove car alone (%)
Means of transportation to work - Carpooled (%)
Means of transportation to work - Public transportation (%)
Means of transportation to work - Bus or trolley bus (%)
Means of transportation to work - Streetcar or trolley car (%)
Means of transportation to work - Subway or elevated (%)
Means of transportation to work - Railroad (%)
Means of transportation to work - Ferryboat (%)
Means of transportation to work - Taxicab (%)
Means of transportation to work - Motorcycle (%)
Means of transportation to work - Bicycle (%)
Means of transportation to work - Walked (%)
Means of transportation to work - Other means (%)
Working at home (%)
Industry diversity
Most Common Industries - Agriculture, forestry, fishing and hunting, and mining (%)
Most Common Industries - Agriculture, forestry, fishing and hunting (%)
Most Common Industries - Mining, quarrying, and oil and gas extraction (%)
Most Common Industries - Construction (%)
Most Common Industries - Manufacturing (%)
Most Common Industries - Wholesale trade (%)
Most Common Industries - Retail trade (%)
Most Common Industries - Transportation and warehousing, and utilities (%)
Most Common Industries - Transportation and warehousing (%)
Most Common Industries - Utilities (%)
Most Common Industries - Information (%)
Most Common Industries - Finance and insurance, and real estate and rental and leasing (%)
Most Common Industries - Finance and insurance (%)
Most Common Industries - Real estate and rental and leasing (%)
Most Common Industries - Professional, scientific, and management, and administrative and waste management services (%)
Most Common Industries - Professional, scientific, and technical services (%)
Most Common Industries - Management of companies and enterprises (%)
Most Common Industries - Administrative and support and waste management services (%)
Most Common Industries - Educational services, and health care and social assistance (%)
Most Common Industries - Educational services (%)
Most Common Industries - Health care and social assistance (%)
Most Common Industries - Arts, entertainment, and recreation, and accommodation and food services (%)
Most Common Industries - Arts, entertainment, and recreation (%)
Most Common Industries - Accommodation and food services (%)
Most Common Industries - Other services, except public administration (%)
Most Common Industries - Public administration (%)
Occupation diversity
Most Common Occupations - Management, business, science, and arts occupations (%)
Most Common Occupations - Management, business, and financial occupations (%)
Most Common Occupations - Management occupations (%)
Most Common Occupations - Business and financial operations occupations (%)
Most Common Occupations - Computer, engineering, and science occupations (%)
Most Common Occupations - Computer and mathematical occupations (%)
Most Common Occupations - Architecture and engineering occupations (%)
Most Common Occupations - Life, physical, and social science occupations (%)
Most Common Occupations - Education, legal, community service, arts, and media occupations (%)
Most Common Occupations - Community and social service occupations (%)
Most Common Occupations - Legal occupations (%)
Most Common Occupations - Education, training, and library occupations (%)
Most Common Occupations - Arts, design, entertainment, sports, and media occupations (%)
Most Common Occupations - Healthcare practitioners and technical occupations (%)
Most Common Occupations - Health diagnosing and treating practitioners and other technical occupations (%)
Most Common Occupations - Health technologists and technicians (%)
Most Common Occupations - Service occupations (%)
Most Common Occupations - Healthcare support occupations (%)
Most Common Occupations - Protective service occupations (%)
Most Common Occupations - Fire fighting and prevention, and other protective service workers including supervisors (%)
Most Common Occupations - Law enforcement workers including supervisors (%)
Most Common Occupations - Food preparation and serving related occupations (%)
Most Common Occupations - Building and grounds cleaning and maintenance occupations (%)
Most Common Occupations - Personal care and service occupations (%)
Most Common Occupations - Sales and office occupations (%)
Most Common Occupations - Sales and related occupations (%)
Most Common Occupations - Office and administrative support occupations (%)
Most Common Occupations - Natural resources, construction, and maintenance occupations (%)
Most Common Occupations - Farming, fishing, and forestry occupations (%)
Most Common Occupations - Construction and extraction occupations (%)
Most Common Occupations - Installation, maintenance, and repair occupations (%)
Most Common Occupations - Production, transportation, and material moving occupations (%)
Most Common Occupations - Production occupations (%)
Most Common Occupations - Transportation occupations (%)
Most Common Occupations - Material moving occupations (%)
People in Group quarters - Institutionalized population (%)
People in Group quarters - Correctional institutions (%)
People in Group quarters - Federal prisons and detention centers (%)
People in Group quarters - Halfway houses (%)
People in Group quarters - Local jails and other confinement facilities (including police lockups) (%)
People in Group quarters - Military disciplinary barracks (%)
People in Group quarters - State prisons (%)
People in Group quarters - Other types of correctional institutions (%)
People in Group quarters - Nursing homes (%)
People in Group quarters - Hospitals/wards, hospices, and schools for the handicapped (%)
People in Group quarters - Hospitals/wards and hospices for chronically ill (%)
People in Group quarters - Hospices or homes for chronically ill (%)
People in Group quarters - Military hospitals or wards for chronically ill (%)
People in Group quarters - Other hospitals or wards for chronically ill (%)
People in Group quarters - Hospitals or wards for drug/alcohol abuse (%)
People in Group quarters - Mental (Psychiatric) hospitals or wards (%)
People in Group quarters - Schools, hospitals, or wards for the mentally retarded (%)
People in Group quarters - Schools, hospitals, or wards for the physically handicapped (%)
People in Group quarters - Institutions for the deaf (%)
People in Group quarters - Institutions for the blind (%)
People in Group quarters - Orthopedic wards and institutions for the physically handicapped (%)
People in Group quarters - Wards in general hospitals for patients who have no usual home elsewhere (%)
People in Group quarters - Wards in military hospitals for patients who have no usual home elsewhere (%)
People in Group quarters - Juvenile institutions (%)
People in Group quarters - Long-term care (%)
People in Group quarters - Homes for abused, dependent, and neglected children (%)
People in Group quarters - Residential treatment centers for emotionally disturbed children (%)
People in Group quarters - Training schools for juvenile delinquents (%)
People in Group quarters - Short-term care, detention or diagnostic centers for delinquent children (%)
People in Group quarters - Type of juvenile institution unknown (%)
People in Group quarters - Noninstitutionalized population (%)
People in Group quarters - College dormitories (includes college quarters off campus) (%)
People in Group quarters - Military quarters (%)
People in Group quarters - On base (%)
People in Group quarters - Barracks, unaccompanied personnel housing (UPH), (Enlisted/Officer), ;and similar group living quarters for military personnel (%)
People in Group quarters - Transient quarters for temporary residents (%)
People in Group quarters - Military ships (%)
People in Group quarters - Group homes (%)
People in Group quarters - Homes or halfway houses for drug/alcohol abuse (%)
People in Group quarters - Homes for the mentally ill (%)
People in Group quarters - Homes for the mentally retarded (%)
People in Group quarters - Homes for the physically handicapped (%)
People in Group quarters - Other group homes (%)
People in Group quarters - Religious group quarters (%)
People in Group quarters - Dormitories (%)
People in Group quarters - Agriculture workers' dormitories on farms (%)
People in Group quarters - Job Corps and vocational training facilities (%)
People in Group quarters - Other workers' dormitories (%)
People in Group quarters - Crews of maritime vessels (%)
People in Group quarters - Other nonhousehold living situations (%)
People in Group quarters - Other noninstitutional group quarters (%)
Residents speaking English at home (%)
Residents speaking English at home - Born in the United States (%)
Residents speaking English at home - Native, born elsewhere (%)
Residents speaking English at home - Foreign born (%)
Residents speaking Spanish at home (%)
Residents speaking Spanish at home - Born in the United States (%)
Residents speaking Spanish at home - Native, born elsewhere (%)
Residents speaking Spanish at home - Foreign born (%)
Residents speaking other language at home (%)
Residents speaking other language at home - Born in the United States (%)
Residents speaking other language at home - Native, born elsewhere (%)
Residents speaking other language at home - Foreign born (%)
Class of Workers - Employee of private company (%)
Class of Workers - Self-employed in own incorporated business (%)
Class of Workers - Private not-for-profit wage and salary workers (%)
Class of Workers - Local government workers (%)
Class of Workers - State government workers (%)
Class of Workers - Federal government workers (%)
Class of Workers - Self-employed workers in own not incorporated business and Unpaid family workers (%)
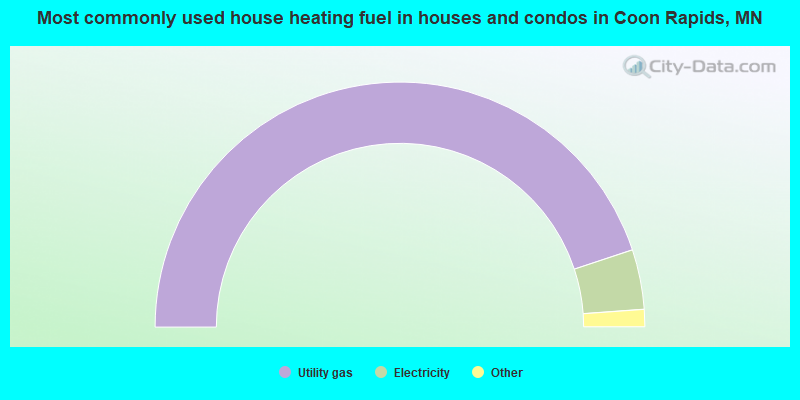
House heating fuel used in houses and condos - Utility gas (%)
House heating fuel used in houses and condos - Bottled, tank, or LP gas (%)
House heating fuel used in houses and condos - Electricity (%)
House heating fuel used in houses and condos - Fuel oil, kerosene, etc. (%)
House heating fuel used in houses and condos - Coal or coke (%)
House heating fuel used in houses and condos - Wood (%)
House heating fuel used in houses and condos - Solar energy (%)
House heating fuel used in houses and condos - Other fuel (%)
House heating fuel used in houses and condos - No fuel used (%)
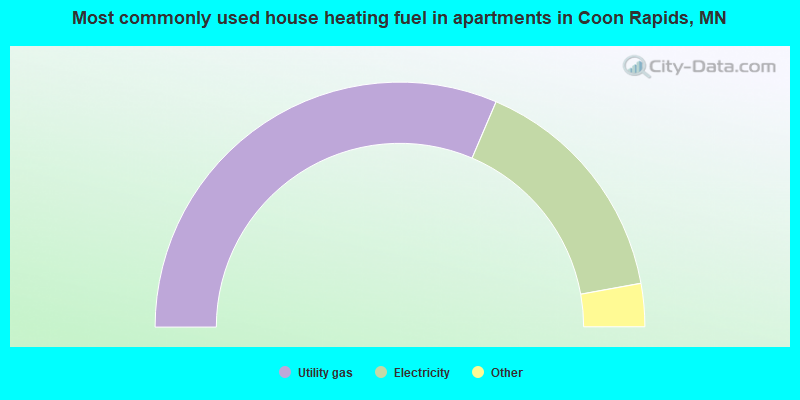
House heating fuel used in apartments - Utility gas (%)
House heating fuel used in apartments - Bottled, tank, or LP gas (%)
House heating fuel used in apartments - Electricity (%)
House heating fuel used in apartments - Fuel oil, kerosene, etc. (%)
House heating fuel used in apartments - Coal or coke (%)
House heating fuel used in apartments - Wood (%)
House heating fuel used in apartments - Solar energy (%)
House heating fuel used in apartments - Other fuel (%)
House heating fuel used in apartments - No fuel used (%)
Armed forces status - In Armed Forces (%)
Armed forces status - Civilian (%)
Armed forces status - Civilian - Veteran (%)
Armed forces status - Civilian - Nonveteran (%)
Fatal accidents locations in years 2005-2021
Fatal accidents locations in 2005
Fatal accidents locations in 2006
Fatal accidents locations in 2007
Fatal accidents locations in 2008
Fatal accidents locations in 2009
Fatal accidents locations in 2010
Fatal accidents locations in 2011
Fatal accidents locations in 2012
Fatal accidents locations in 2013
Fatal accidents locations in 2014
Fatal accidents locations in 2015
Fatal accidents locations in 2016
Fatal accidents locations in 2017
Fatal accidents locations in 2018
Fatal accidents locations in 2019
Fatal accidents locations in 2020
Fatal accidents locations in 2021
Alcohol use - People drinking some alcohol every month (%)
Alcohol use - People not drinking at all (%)
Alcohol use - Average days/month drinking alcohol
Alcohol use - Average drinks/week
Alcohol use - Average days/year people drink much
Audiometry - Average condition of hearing (%)
Audiometry - People that can hear a whisper from across a quiet room (%)
Audiometry - People that can hear normal voice from across a quiet room (%)
Audiometry - Ears ringing, roaring, buzzing (%)
Audiometry - Had a job exposure to loud noise (%)
Audiometry - Had off-work exposure to loud noise (%)
Blood Pressure & Cholesterol - Has high blood pressure (%)
Blood Pressure & Cholesterol - Checking blood pressure at home (%)
Blood Pressure & Cholesterol - Frequently checking blood cholesterol (%)
Blood Pressure & Cholesterol - Has high cholesterol level (%)
Consumer Behavior - Money monthly spent on food at supermarket/grocery store
Consumer Behavior - Money monthly spent on food at other stores
Consumer Behavior - Money monthly spent on eating out
Consumer Behavior - Money monthly spent on carryout/delivered foods
Consumer Behavior - Income spent on food at supermarket/grocery store (%)
Consumer Behavior - Income spent on food at other stores (%)
Consumer Behavior - Income spent on eating out (%)
Consumer Behavior - Income spent on carryout/delivered foods (%)
Current Health Status - General health condition (%)
Current Health Status - Blood donors (%)
Current Health Status - Has blood ever tested for HIV virus (%)
Current Health Status - Left-handed people (%)
Dermatology - People using sunscreen (%)
Diabetes - Diabetics (%)
Diabetes - Had a blood test for high blood sugar (%)
Diabetes - People taking insulin (%)
Diet Behavior & Nutrition - Diet health (%)
Diet Behavior & Nutrition - Milk product consumption (# of products/month)
Diet Behavior & Nutrition - Meals not home prepared (#/week)
Diet Behavior & Nutrition - Meals from fast food or pizza place (#/week)
Diet Behavior & Nutrition - Ready-to-eat foods (#/month)
Diet Behavior & Nutrition - Frozen meals/pizza (#/month)
Drug Use - People that ever used marijuana or hashish (%)
Drug Use - Ever used hard drugs (%)
Drug Use - Ever used any form of cocaine (%)
Drug Use - Ever used heroin (%)
Drug Use - Ever used methamphetamine (%)
Health Insurance - People covered by health insurance (%)
Kidney Conditions-Urology - Avg. # of times urinating at night
Medical Conditions - People with asthma (%)
Medical Conditions - People with anemia (%)
Medical Conditions - People with psoriasis (%)
Medical Conditions - People with overweight (%)
Medical Conditions - Elderly people having difficulties in thinking or remembering (%)
Medical Conditions - People who ever received blood transfusion (%)
Medical Conditions - People having trouble seeing even with glass/contacts (%)
Medical Conditions - People with arthritis (%)
Medical Conditions - People with gout (%)
Medical Conditions - People with congestive heart failure (%)
Medical Conditions - People with coronary heart disease (%)
Medical Conditions - People with angina pectoris (%)
Medical Conditions - People who ever had heart attack (%)
Medical Conditions - People who ever had stroke (%)
Medical Conditions - People with emphysema (%)
Medical Conditions - People with thyroid problem (%)
Medical Conditions - People with chronic bronchitis (%)
Medical Conditions - People with any liver condition (%)
Medical Conditions - People who ever had cancer or malignancy (%)
Mental Health - People who have little interest in doing things (%)
Mental Health - People feeling down, depressed, or hopeless (%)
Mental Health - People who have trouble sleeping or sleeping too much (%)
Mental Health - People feeling tired or having little energy (%)
Mental Health - People with poor appetite or overeating (%)
Mental Health - People feeling bad about themself (%)
Mental Health - People who have trouble concentrating on things (%)
Mental Health - People moving or speaking slowly or too fast (%)
Mental Health - People having thoughts they would be better off dead (%)
Oral Health - Average years since last visit a dentist
Oral Health - People embarrassed because of mouth (%)
Oral Health - People with gum disease (%)
Oral Health - General health of teeth and gums (%)
Oral Health - Average days a week using dental floss/device
Oral Health - Average days a week using mouthwash for dental problem
Oral Health - Average number of teeth
Pesticide Use - Households using pesticides to control insects (%)
Pesticide Use - Households using pesticides to kill weeds (%)
Physical Activity - People doing vigorous-intensity work activities (%)
Physical Activity - People doing moderate-intensity work activities (%)
Physical Activity - People walking or bicycling (%)
Physical Activity - People doing vigorous-intensity recreational activities (%)
Physical Activity - People doing moderate-intensity recreational activities (%)
Physical Activity - Average hours a day doing sedentary activities
Physical Activity - Average hours a day watching TV or videos
Physical Activity - Average hours a day using computer
Physical Functioning - People having limitations keeping them from working (%)
Physical Functioning - People limited in amount of work they can do (%)
Physical Functioning - People that need special equipment to walk (%)
Physical Functioning - People experiencing confusion/memory problems (%)
Physical Functioning - People requiring special healthcare equipment (%)
Prescription Medications - Average number of prescription medicines taking
Preventive Aspirin Use - Adults 40+ taking low-dose aspirin (%)
Reproductive Health - Vaginal deliveries (%)
Reproductive Health - Cesarean deliveries (%)
Reproductive Health - Deliveries resulted in a live birth (%)
Reproductive Health - Pregnancies resulted in a delivery (%)
Reproductive Health - Women breastfeeding newborns (%)
Reproductive Health - Women that had a hysterectomy (%)
Reproductive Health - Women that had both ovaries removed (%)
Reproductive Health - Women that have ever taken birth control pills (%)
Reproductive Health - Women taking birth control pills (%)
Reproductive Health - Women that have ever used Depo-Provera or injectables (%)
Reproductive Health - Women that have ever used female hormones (%)
Sexual Behavior - People 18+ that ever had sex (vaginal, anal, or oral) (%)
Sexual Behavior - Males 18+ that ever had vaginal sex with a woman (%)
Sexual Behavior - Males 18+ that ever performed oral sex on a woman (%)
Sexual Behavior - Males 18+ that ever had anal sex with a woman (%)
Sexual Behavior - Males 18+ that ever had any sex with a man (%)
Sexual Behavior - Females 18+ that ever had vaginal sex with a man (%)
Sexual Behavior - Females 18+ that ever performed oral sex on a man (%)
Sexual Behavior - Females 18+ that ever had anal sex with a man (%)
Sexual Behavior - Females 18+ that ever had any kind of sex with a woman (%)
Sexual Behavior - Average age people first had sex
Sexual Behavior - Average number of female sex partners in lifetime (males 18+)
Sexual Behavior - Average number of female vaginal sex partners in lifetime (males 18+)
Sexual Behavior - Average age people first performed oral sex on a woman (18+)
Sexual Behavior - Average number of woman performed oral sex on in lifetime (18+)
Sexual Behavior - Average number of male sex partners in lifetime (males 18+)
Sexual Behavior - Average number of male anal sex partners in lifetime (males 18+)
Sexual Behavior - Average age people first performed oral sex on a man (18+)
Sexual Behavior - Average number of male oral sex partners in lifetime (18+)
Sexual Behavior - People using protection when performing oral sex (%)
Sexual Behavior - Average number of times people have vaginal or anal sex a year
Sexual Behavior - People having sex without condom (%)
Sexual Behavior - Average number of male sex partners in lifetime (females 18+)
Sexual Behavior - Average number of male vaginal sex partners in lifetime (females 18+)
Sexual Behavior - Average number of female sex partners in lifetime (females 18+)
Sexual Behavior - Circumcised males 18+ (%)
Sleep Disorders - Average hours sleeping at night
Sleep Disorders - People that has trouble sleeping (%)
Smoking-Cigarette Use - People smoking cigarettes (%)
Taste & Smell - People 40+ having problems with smell (%)
Taste & Smell - People 40+ having problems with taste (%)
Taste & Smell - People 40+ that ever had wisdom teeth removed (%)
Taste & Smell - People 40+ that ever had tonsils teeth removed (%)
Taste & Smell - People 40+ that ever had a loss of consciousness because of a head injury (%)
Taste & Smell - People 40+ that ever had a broken nose or other serious injury to face or skull (%)
Taste & Smell - People 40+ that ever had two or more sinus infections (%)
Weight - Average height (inches)
Weight - Average weight (pounds)
Weight - Average BMI
Weight - People that are obese (%)
Weight - People that ever were obese (%)
Weight - People trying to lose weight (%)
According to our research of Minnesota and other state lists, there was 1 registered sex offender living in Coon Rapids, Minnesota as of April 27, 2024 . The ratio of all residents to sex offenders in Coon Rapids is 63,016 to 1.The ratio of registered sex offenders to all residents in this city is much lower than the state average.
The City-Data.com crime index weighs serious crimes and violent crimes more heavily. Higher means more crime, U.S. average is 246.1. It adjusts for the number of visitors and daily workers commuting into cities.
- means the value is smaller than the state average.
- means the value is about the same as the state average.
- means the value is bigger than the state average.
- means the value is much bigger than the state average.
Crime rate in Coon Rapids detailed stats: murders, rapes, robberies, assaults, burglaries, thefts, arson Officers per 1,000 residents here:
1.09Minnesota average:
1.76
Latest news from Coon Rapids, MN collected exclusively by city-data.com from local newspapers, TV, and radio stations
Coon Rapids, MN City Guides: Ancestries: German (18.8%), American (7.5%), Norwegian (7.5%), European (4.0%), Irish (3.5%), English (2.9%).
Current Local Time:
Land area: 22.7 square miles.
Population density: 2,770 people per square mile (average).
6,203 residents are foreign born (3.7% Africa , 2.9% Asia , 1.5% Europe , 1.2% Latin America ).
This city:
9.7%Minnesota:
8.5%
Median real estate property taxes paid for housing units with mortgages in 2022: $2,549 (0.9%)Median real estate property taxes paid for housing units with no mortgage in 2022: $2,627 (0.9%)
Nearest city with pop. 200,000+: Minneapolis, MN
Nearest city with pop. 1,000,000+: Chicago, IL
Nearest cities:
Latitude: 45.17 N, Longitude: 93.31 W
Daytime population change due to commuting: -6,033 (-9.4%)Workers who live and work in this city: 10,335 (30.5%)
Area code commonly used in this area: 763
Single-family new house construction building permits:
2022: 43 buildings , average cost: $278,7002021: 61 buildings , average cost: $251,4002020: 34 buildings , average cost: $247,3002019: 17 buildings , average cost: $274,4002018: 22 buildings , average cost: $262,6002017: 36 buildings , average cost: $318,3002016: 21 buildings , average cost: $266,3002015: 29 buildings , average cost: $259,4002014: 12 buildings , average cost: $284,6002013: 15 buildings , average cost: $260,9002012: 34 buildings , average cost: $199,1002011: 18 buildings , average cost: $246,8002010: 10 buildings , average cost: $285,2002009: 13 buildings , average cost: $240,4002008: 17 buildings , average cost: $201,0002007: 67 buildings , average cost: $183,0002006: 134 buildings , average cost: $161,7002005: 173 buildings , average cost: $166,1002004: 283 buildings , average cost: $177,4002003: 332 buildings , average cost: $172,3002002: 160 buildings , average cost: $167,9002001: 152 buildings , average cost: $121,2002000: 135 buildings , average cost: $127,0001999: 235 buildings , average cost: $104,4001998: 282 buildings , average cost: $88,7001997: 266 buildings , average cost: $80,900Unemployment in December 2023:
Population change in the 1990s: +8,262 (+15.5%).
Most common occupations in Coon Rapids, MN (%)
Both Males Females
Cooks and food preparation workers (5.0%)
Other management occupations, except farmers and farm managers (4.2%)
Material recording, scheduling, dispatching, and distributing workers (4.0%)
Building and grounds cleaning and maintenance occupations (3.0%)
Retail sales workers, except cashiers (2.9%)
Computer specialists (2.8%)
Other office and administrative support workers, including supervisors (2.7%)
Cooks and food preparation workers (5.3%)
Material recording, scheduling, dispatching, and distributing workers (4.8%)
Driver/sales workers and truck drivers (4.7%)
Other management occupations, except farmers and farm managers (4.4%)
Computer specialists (4.2%)
Building and grounds cleaning and maintenance occupations (3.9%)
Metal workers and plastic workers (3.8%)
Cooks and food preparation workers (4.7%)
Secretaries and administrative assistants (4.3%)
Registered nurses (4.0%)
Other management occupations, except farmers and farm managers (3.9%)
Customer service representatives (3.9%)
Information and record clerks, except customer service representatives (3.9%)
Cashiers (3.8%)
Tornado activity:
Coon Rapids-area historical tornado activity is slightly above Minnesota state average. It is 23% greater than the overall U.S. average.
On 7/3/1983, a category F4 (max. wind speeds 207-260 mph) tornado 3.4 miles away from the Coon Rapids city center injured 4 people and caused between $5000 and $50,000 in damages.
On 6/19/1951, a category F4 tornado 4.0 miles away from the city center killed one person and injured 20 people and caused between $500,000 and $5,000,000 in damages.
Earthquake activity:
Coon Rapids-area historical earthquake activity is significantly above Minnesota state average. It is 55% smaller than the overall U.S. average. On 7/9/1975 at 14:54:15, a magnitude 4.6 (4.6 MB, Class: Light, Intensity: IV - V) earthquake occurred 137.1 miles away from the city center On 6/5/1993 at 01:24:53, a magnitude 4.1 (4.1 LG, Depth: 6.2 mi) earthquake occurred 149.0 miles away from the city center On 3/4/1983 at 06:32:18, a magnitude 4.6 (4.4 MB, 4.6 LG, 4.4 ML) earthquake occurred 307.1 miles away from Coon Rapids center On 10/20/1995 at 15:57:18, a magnitude 3.7 (3.7 LG, Depth: 3.1 mi, Class: Light, Intensity: II - III) earthquake occurred 177.7 miles away from Coon Rapids center On 2/9/1994 at 08:45:35, a magnitude 3.1 (3.1 LG, Depth: 3.1 mi) earthquake occurred 83.5 miles away from Coon Rapids center On 11/3/2002 at 20:41:56, a magnitude 4.3 (4.3 MB, Depth: 3.1 mi) earthquake occurred 323.9 miles away from Coon Rapids center Magnitude types: regional Lg-wave magnitude (LG), body-wave magnitude (MB), local magnitude (ML) Natural disasters: The number of natural disasters in Anoka County (12) is smaller than the US average (15).Major Disasters (Presidential) Declared: 8Emergencies Declared: 2Floods: 6, Storms: 4, Tornadoes: 3, Drought: 1, Fire: 1, Hurricane: 1, Wind: 1, Other: 1 (Note: some incidents may be assigned to more than one category). Hospitals in Coon Rapids: CAMILIA ROSE GROUP HOME (11820 XEON BOULEVARD) COMMUNITY LIVING INC COTTAGE 6 (2493 109TH AVENUE NORTHWEST) MERCY HOSPITAL (Voluntary non-profit - Private, 4050 COON RAPIDS BLVD) REM MN COMM SRVS INC ANOKA (12011 KUMQUAT STREET NORTHWEST) Nursing Homes in Coon Rapids: CAMILIA ROSE CARE CENTER LLC (11800 XEON BOULEVARD) CAMILIA ROSE CONV CTR (11800 XEON BLVD NW) PARK RIVER ESTATES CARE CENTER (9899 AVOCET STREET NORTHWEST) Dialysis Facilities in Coon Rapids: COON RAPIDS DIALYSIS OF DAVITA (3960 COON RAPIDS BLVD, SUITE 309) FMC - COON RAPIDS (3465 NORTHDALE BLVD) FMC DIALYSIS - NORTH SUBURBAN (9144 SPRINGBROOK DR) Home Health Centers in Coon Rapids: COVENANT HOME HEALTH CARE LLC (199 COON RAPIDS BOULEVARD) MARY T HOME HEALTH (1555 118TH LANE NORTHWEST) Heliports located in Coon Rapids: Amtrak station near Coon Rapids: 16 miles: ST. PAUL/MINNEAPOLIS (ST. PAUL, 730 TRANSFER RD.) Services: ticket office, fully wheelchair accessible, enclosed waiting area, public restrooms, public payphones, vending machines, free short-term parking, free long-term parking, call for car rental service, taxi stand.
College/University in Coon Rapids: Anoka-Ramsey Community College Full-time enrollment: 5,918; Location: 11200 Mississippi Blvd. NW; Public; Website: www.anokaramsey.edu)
Other colleges/universities with over 2000 students near Coon Rapids:
North Hennepin Community College (about 6 miles; Brooklyn Park, MN ; Full-time enrollment: 4,943)
Hennepin Technical College (about 7 miles; Brooklyn Park, MN ; FT enrollment: 4,515)
Bethel University (about 11 miles; Saint Paul, MN ; FT enrollment: 4,061)
University of Northwestern-St Paul (about 12 miles; Saint Paul, MN ; FT enrollment: 2,680)
Walden University (about 14 miles; Minneapolis, MN ; FT enrollment: 62,473)
Capella University (about 14 miles; Minneapolis, MN ; FT enrollment: 21,718)
Minneapolis Community and Technical College (about 14 miles; Minneapolis, MN ; FT enrollment: 6,726)
Public high schools in Coon Rapids: NORTHWEST PASSAGE HIGH SCHOOL Location: 11345 ROBINSON DR NW, Grades: 9-12, Charter school )RIVER TRAIL LEARNING CTR @ LO JACOB Location: 1700 COON RAPIDS BLVD, Grades: KG-12)
PATHWAYS Location: 11238 CROOKED LK BLVD, Grades: 12)
CROSSROADS SUMMER PROGRAM Location: 1313 COON RAPIDS BLVD NW, Grades: 9-12)COON RAPIDS HIGH SCHOOL Location: 2340 NORTHDALE BLVD, Grades: 9-12)CROSSROADS ALTN HIGH SCHOOL Location: 1313 COON RAPIDS BLVD NW, Grades: 9-12)COMPASS-BELL CENTER Location: 1374 NORTHDALE BLVD, Grades: 6-12)CROSSROADS-NIGHT Location: 1313 COON RAPIDS BLVD NW, Grades: 9-12)COMPASS ON-LINE Location: 1374 NORTHDALE BLVD, Grades: KG-12)
Private high school in Coon Rapids:
Public elementary/middle schools in Coon Rapids:
Private elementary/middle schools in Coon Rapids: EPIPHANY SCHOOL Students: 517, Location: 11001 HANSON BLVD NW, Grades: KG-8)
CROSS OF CHRIST LUTHERAN SCHOOL Students: 77, Location: 9931 FOLEY BLVD NW, Grades: PK-8)See full list of schools located in Coon Rapids User-submitted facts and corrections:
AM 950 KTNF St Louis Park, MN, Owner: Air America Radio, which is mainly member supported, is a station that has become one of the fastest growing stations across the country. I and the rest of the listeners would appreciate your acknowledgement of the station on this site for cities throughout Minneapolis and St Paul. Thank you.
Notable locations in Coon Rapids: (A) , Coon Rapids Fire Department Station 2 (B) , Coon Rapids Fire Department Station 3 (C) , Coon Rapids Fire Department Station 1 (D) , Northdale Library (E) , Crooked Lake Library (F) . Display/hide their locations on the map
Shopping Centers: (1) , Coon Rapids Shopping Center (2) , Coon Rapids Square Shopping Center (3) , Coon Rapids Village Shopping Center (4) , Northdale Shopping Center (5) , Northtown Village Shopping Center (6) , Riverdale Crossing Shopping Center (7) , Round Lake Shoppes Shopping Center (8) , Springbrook Mall Shopping Center (9) . Display/hide their locations on the map
Churches in Coon Rapids include: (A) , Berean Church (B) , Unity North Church (C) , Salvation Army (D) , Presbyterian Church of the Master (E) , Olive Branch Lutheran Church (F) , East River Church (G) , Chapel Hill Church (H) , Believers Bible Chapel (I) . Display/hide their locations on the map
Cemeteries: (1) , Joyce Chapel Cemetery (2) , Morningside Memorial Gardens Cemetery (3) . Display/hide their locations on the map
Lakes: (A) , Cenaiko Lake (B) , Crooked Lake (C) . Display/hide their locations on the map
Creeks: (A) , Sand Creek (B) . Display/hide their locations on the map
Parks in Coon Rapids include: (1) , Mercy Park (2) , Moor Park (3) , Nelson Park (4) , Palm Olive Park (5) , Prospect Park (6) , Riverview Park (7) , Vineyard Park (8) , Woodcrest Park (9) . Display/hide their locations on the map
Tourist attraction: (1) . Display/hide its approximate location on the map
Hotels: (1) , Suburban Lodge Of Coon Rapids (420 Coon Rapids Blvd NW) (2) , Holiday Inn Express Hotel & Suites (9333 Springbrook Drive Northwest) (3) . Display/hide their approximate locations on the map
Birthplace of: Ben Nelson - 2005 NFL player (Minnesota Vikings, born : Aug 21, 1979), Dan Johnson - 2005 Major League Baseball player (Oakland Athletics, born : Aug 10, 1979), Dan Johnson (baseball) - Baseball player, Josh Langfeld - Ice hockey player, Leo Foley - Politician, Erik Johnson (ice hockey b. 1981) - Ice hockey player.
Anoka County has a predicted average indoor radon screening level between 2 and 4 pCi/L (pico curies per liter) - Moderate Potential Drinking water stations with addresses in Coon Rapids that have no violations reported:
COON RAPIDS (Address: 11155 Robinson Drive NW Population served: 63,000, Primary Water Source Type: Groundwater)
TROUT CREEK TAVERN (Serves WI, Population served: 40, Primary Water Source Type: Groundwater)
Average household size: This city:
2.6 peopleMinnesota:
2.5 people
Percentage of family households: This city:
69.4%Whole state:
64.6%
Percentage of households with unmarried partners: This city:
7.8%Whole state:
6.9%
Likely homosexual households (counted as self-reported same-sex unmarried-partner households)
Lesbian couples: 0.4% of all households Gay men: 0.2% of all households
People in group quarters in Coon Rapids in 2010:
201 people in nursing facilities/skilled-nursing facilities
145 people in group homes intended for adults
6 people in residential treatment centers for adults
4 people in group homes for juveniles (non-correctional)
3 people in other noninstitutional facilities
People in group quarters in Coon Rapids in 2000:
184 people in nursing homes
129 people in homes for the mentally retarded
37 people in other group homes
8 people in other noninstitutional group quarters
4 people in religious group quarters
Banks with branches in Coon Rapids (2011 data):
TCF National Bank: Mn Cub Foods- Coon Rapids South Bran, Coon Rapids Cub Branch, Coon Rapids Branch. Info updated 2009/11/23: Bank assets: $19,007.0 mil, Deposits: $12,377.0 mil, headquarters in Sioux Falls, SD, positive income , Commercial Lending Specialization, 441 total offices , Holding Company: Tcf Financial Corporation
Wells Fargo Bank, National Association: Robinson Drive Branch, Northtown Branch, Riverdale Facility. Info updated 2011/04/05: Bank assets: $1,161,490.0 mil, Deposits: $905,653.0 mil, headquarters in Sioux Falls, SD, positive income , 6395 total offices , Holding Company: Wells Fargo & Company
First Advantage Bank: at 9950 Foley Boulevard Nw, branch established on 2003/09/02. Info updated 2006/11/03: Bank assets: $62.9 mil, Deposits: $53.3 mil, local headquarters , positive income , Commercial Lending Specialization, 1 total offices , Holding Company: First Advantage Bancshares, Inc.
Northeast Bank: Coon Rapids Branch at 200 Coon Rapids Boulevard, branch established on 1990/02/05. Info updated 2006/11/03: Bank assets: $351.7 mil, Deposits: $271.3 mil, headquarters in Minneapolis, MN, positive income , Commercial Lending Specialization, 3 total offices , Holding Company: Northeast Securities Corporation
U.S. Bank National Association: Coon Rapids Branch at 3990 Main Street Northwest, branch established on 1982/01/18. Info updated 2012/01/30: Bank assets: $330,470.8 mil, Deposits: $236,091.5 mil, headquarters in Cincinnati, OH, positive income , 3121 total offices , Holding Company: U.S. Bancorp
KleinBank: Kleinbank - Coon Rapids at 3251 Northdale Blvd, Nw, branch established on 1993/07/20. Info updated 2010/11/22: Bank assets: $1,504.4 mil, Deposits: $1,255.9 mil, headquarters in Big Lake, MN, positive income , Commercial Lending Specialization, 22 total offices , Holding Company: Klein Financial, Inc.
Central Bank: Coon Rapids Branch at 3575 124th Avenue Northwest, branch established on 2002/12/04. Info updated 2011/10/11: Bank assets: $1,120.1 mil, Deposits: $949.3 mil, headquarters in Stillwater, MN, positive income , Commercial Lending Specialization, 20 total offices , Holding Company: Central Bancshares, Inc.
Sterling State Bank: Coon Rapids Branch at 3550 River Rapids Drive, N.W., branch established on 2002/10/16. Info updated 2006/11/03: Bank assets: $308.5 mil, Deposits: $267.4 mil, headquarters in Austin, MN, positive income , Commercial Lending Specialization, 12 total offices , Holding Company: Sterling Financial Group, Inc.
For population 15 years and over in Coon Rapids:
Never married: 35.2%Now married: 45.6%Separated: 2.1%Widowed: 5.9%Divorced: 11.2% For population 25 years and over in Coon Rapids:
High school or higher: 94.1%Bachelor's degree or higher: 24.7%Graduate or professional degree: 5.8%Unemployed: 3.8%Mean travel time to work (commute): 20.2 minutes
Education Gini index (Inequality in education) Here:
9.7Minnesota average:
10.9
Religion statistics for Coon Rapids, MN (based on Anoka County data)
Religion Adherents Congregations Catholic 75,535 12 Evangelical Protestant 49,709 109 Mainline Protestant 36,549 33 Other 2,179 12 Orthodox 195 3 None 166,677 -
Source: Clifford Grammich, Kirk Hadaway, Richard Houseal, Dale E.Jones, Alexei Krindatch, Richie Stanley and Richard H.Taylor. 2012. 2010 U.S.Religion Census: Religious Congregations & Membership Study. Association of Statisticians of American Religious Bodies. Jones, Dale E., et al. 2002. Congregations and Membership in the United States 2000. Nashville, TN: Glenmary Research Center. Graphs represent county-level data
Food Environment Statistics: Number of grocery stores : 32Here :
0.98 / 10,000 pop.Minnesota :
1.83 / 10,000 pop.
Number of supercenters and club stores : 3This county :
0.09 / 10,000 pop.State :
0.13 / 10,000 pop.
Number of convenience stores (no gas) : 14Anoka County :
0.43 / 10,000 pop.Minnesota :
0.49 / 10,000 pop.
Number of convenience stores (with gas) : 109Anoka County :
3.35 / 10,000 pop.Minnesota :
3.90 / 10,000 pop.
Number of full-service restaurants : 125This county :
3.84 / 10,000 pop.Minnesota :
6.98 / 10,000 pop.
Adult diabetes rate : This county :
6.8%Minnesota :
6.5%
Adult obesity rate : Anoka County :
27.7%Minnesota :
25.9%
Low-income preschool obesity rate : Health and Nutrition: Healthy diet rate : This city:
50.4%Minnesota:
50.6%
Average overall health of teeth and gums : This city:
48.8%Minnesota:
48.4%
Average BMI : Coon Rapids:
28.7State:
28.5
People feeling badly about themselves : Coon Rapids:
21.7%State:
21.0%
People not drinking alcohol at all : Average hours sleeping at night : Coon Rapids:
6.8Minnesota:
6.8
Overweight people : Here:
34.6%Minnesota:
33.5%
General health condition : Coon Rapids:
58.4%State:
57.7%
Average condition of hearing : Here:
80.2%Minnesota:
79.3%
More about Health and Nutrition of Coon Rapids, MN Residents
Local government employment and payroll (March 2022)
Function
Full-time employees
Monthly full-time payroll
Average yearly full-time wage
Part-time employees
Monthly part-time payroll
Police Protection - Officers
66 $591,748 $107,591 0 $0 Firefighters
34 $281,767 $99,447 8 $2,429 Parks and Recreation
29 $198,899 $82,303 33 $22,861 Other and Unallocable
28 $224,055 $96,024 20 $34,704 Streets and Highways
25 $155,062 $74,430 0 $0 Financial Administration
17 $149,137 $105,273 3 $14,209 Police - Other
11 $70,679 $77,104 7 $15,399 Judicial and Legal
8 $81,178 $121,767 0 $0 Water Supply
7 $44,346 $76,022 0 $0 Other Government Administration
7 $65,565 $112,397 8 $14,852 Sewerage
7 $44,129 $75,650 0 $0 Housing and Community Development (Local)
4 $43,059 $129,177 0 $0 Solid Waste Management
2 $13,005 $78,030 0 $0
Totals for Government
245 $1,962,629 $96,129 79 $104,454
Coon Rapids government finances - Expenditure in 2021 (per resident):
Construction - Regular Highways: $6,355,000 ($101.22)
Current Operations - Police Protection: $12,845,000 ($204.59)
Parks and Recreation: $10,641,000 ($169.48)Housing and Community Development: $7,797,000 ($124.19)Sewerage: $6,452,000 ($102.76)Water Utilities: $6,095,000 ($97.08)Regular Highways: $5,531,000 ($88.09)Local Fire Protection: $4,471,000 ($71.21)General - Other: $4,099,000 ($65.29)Financial Administration: $1,404,000 ($22.36)Health - Other: $975,000 ($15.53)Solid Waste Management: $354,000 ($5.64)Central Staff Services: $186,000 ($2.96)Natural Resources - Other: $134,000 ($2.13)General - Interest on Debt: $1,369,000 ($21.80)
Other Capital Outlay - Housing and Community Development: $6,830,000 ($108.78)
Water Utilities: $3,547,000 ($56.49)General - Other: $2,437,000 ($38.82)Regular Highways: $2,124,000 ($33.83)Parks and Recreation: $1,456,000 ($23.19)Local Fire Protection: $962,000 ($15.32)Police Protection: $240,000 ($3.82)Sewerage: $228,000 ($3.63)Solid Waste Management: $15,000 ($0.24)Water Utilities - Interest on Debt: $364,000 ($5.80)
Coon Rapids government finances - Revenue in 2021 (per resident):
Charges - Sewerage: $6,993,000 ($111.38)
Parks and Recreation: $4,777,000 ($76.09)Other: $2,161,000 ($34.42)Regular Highways: $2,023,000 ($32.22)Solid Waste Management: $161,000 ($2.56)Federal Intergovernmental - Health and Hospitals: $4,366,000 ($69.54)
Other: $570,000 ($9.08)Water Utilities: $13,000 ($0.21)Sewerage: $13,000 ($0.21)Local Intergovernmental - Other: $574,000 ($9.14)
Highways: $64,000 ($1.02)Sewerage: $11,000 ($0.18)Miscellaneous - Special Assessments: $2,359,000 ($37.57)
General Revenue - Other: $1,631,000 ($25.98)Interest Earnings: $1,394,000 ($22.20)Fines and Forfeits: $138,000 ($2.20)Revenue - Water Utilities: $6,863,000 ($109.31)
State Intergovernmental - Other: $5,453,000 ($86.85)
Highways: $3,035,000 ($48.34)General Local Government Support: $1,374,000 ($21.88)Water Utilities: $2,000 ($0.03)Tax - Property: $30,006,000 ($477.92)
Public Utilities Sales: $4,331,000 ($68.98)Other License: $1,995,000 ($31.78)Other Selective Sales: $172,000 ($2.74)
Coon Rapids government finances - Debt in 2021 (per resident):
Long Term Debt - Outstanding Unspecified Public Purpose: $63,510,000 ($1011.55)
Beginning Outstanding - Unspecified Public Purpose: $62,290,000 ($992.12)Beginning Outstanding - Public Debt for Private Purpose: $29,633,000 ($471.98)Outstanding Nonguaranteed - Industrial Revenue: $26,975,000 ($429.64)Issue, Unspecified Public Purpose: $6,890,000 ($109.74)Retired Unspecified Public Purpose: $5,670,000 ($90.31)Retired Nonguaranteed - Public Debt for Private Purpose: $2,658,000 ($42.33)
Coon Rapids government finances - Cash and Securities in 2021 (per resident):
Other Funds - Cash and Securities: $10,727,000 ($170.85)
Sinking Funds - Cash and Securities: $26,975,000 ($429.64)
Businesses in Coon Rapids, MN
Name Count Name Count
ALDI 1 Lowe's 1 AT&T 1 Marriott 1 Ace Hardware 1 MasterBrand Cabinets 1 Aeropostale 1 Maurices 1 AmericInn 1 McDonald's 4 American Eagle Outfitters 1 Men's Wearhouse 1 Arby's 2 Menards 1 AutoZone 1 Motherhood Maternity 1 Bakers Square 1 Nike 8 Bed Bath & Beyond 1 Nissan 1 Blockbuster 1 Office Depot 2 Budget Car Rental 1 OfficeMax 1 Buffalo Wild Wings 1 Old Country Buffet 1 Burger King 3 Old Navy 1 CVS 2 Olive Garden 1 Caribou Coffee 2 Outback 1 Chipotle 1 Outback Steakhouse 1 Cold Stone Creamery 1 Panera Bread 2 Costco 1 Papa John's Pizza 1 Curves 1 Payless 2 Dairy Queen 3 PetSmart 1 Deb 1 Pier 1 Imports 1 Dennys 1 Pizza Hut 1 Discount Tire 1 Plato's Closet 1 DressBarn 1 Quality 1 Dressbarn 1 Quiznos 1 Famous Footwear 1 RadioShack 1 Fashion Bug 1 Sears 3 FedEx 8 Sephora 1 Firestone Complete Auto Care 1 Sprint Nextel 2 Foot Locker 1 Starbucks 2 Ford 1 Subway 3 GNC 1 T-Mobile 5 GameStop 2 T.G.I. Driday's 1 H&R Block 2 Taco Bell 1 Holiday Inn 1 Target 2 Home Depot 1 Toyota 1 IHOP 2 U-Haul 1 InTown Suites 1 UPS 5 JCPenney 1 Vans 1 Jimmy John's 1 Verizon Wireless 2 Justice 1 Walgreens 3 KFC 2 Walmart 1 Kohl's 1 Wendy's 1 Lane Bryant 1 White Castle 1 Lane Furniture 1 YMCA 1 Little Caesars Pizza 1
Strongest AM radio stations in Coon Rapids:
WCCO (830 AM; 50 kW; MINNEAPOLIS, MN; Owner: INFINITY MEDIA CORPORATION)
KSTP (1500 AM; 50 kW; ST. PAUL, MN; Owner: KSTP-AM, LLC (DELAWARE))
KLBP (1470 AM; 5 kW; BROOKLYN PARK, MN; Owner: 1400, INC.)
KTIS (900 AM; 25 kW; MINNEAPOLIS, MN; Owner: NORTHWESTERN COLLEGE)
WCTS (1030 AM; 50 kW; MAPLEWOOD, MN; Owner: CNTL. BAPT. THEO/AL SEMI MINNEAPOLIS)
KUOM (770 AM; daytime; 5 kW; MINNEAPOLIS, MN)
KFAN (1130 AM; 50 kW; MINNEAPOLIS, MN; Owner: AMFM RADIO LICENSES, L.L.C.)
KDIZ (1440 AM; 5 kW; GOLDEN VALLEY, MN; Owner: KQRS, INC.)
WWTC (1280 AM; 5 kW; MINNEAPOLIS, MN; Owner: SCA LICENSE CORPORATION)
KYCR (1570 AM; 4 kW; GOLDEN VALLEY, MN; Owner: COMMON GROUND BROADCASTING COMPANY,)
WDGY (630 AM; 8 kW; HUDSON, WI; Owner: 630 RADIO, INCORPORATED)
WMNN (1330 AM; 10 kW; MINNEAPOLIS, MN; Owner: MINNESOTA PUBLIC RADIO.)
KSMM (1530 AM; 9 kW; SHAKOPEE, MN; Owner: STARBOARD BROADCASTING, INC.)
Strongest FM radio stations in Coon Rapids:
KQQL (107.9 FM; ANOKA, MN; Owner: AMFM RADIO LICENSES, L.L.C.)
KNOW-FM (91.1 FM; MINNEAPOLIS-ST. PAUL, MN; Owner: MINNESOTA PUBLIC RADIO)
WLTE (102.9 FM; MINNEAPOLIS, MN; Owner: INFINITY MEDIA CORPORATION)
KSTP-FM (94.5 FM; ST. PAUL, MN; Owner: KSTP-FM, LLC, A DELAWARE LLC)
KTCZ-FM (97.1 FM; MINNEAPOLIS, MN; Owner: AMFM RADIO LICENSES, L.L.C.)
KEEY-FM (102.1 FM; ST. PAUL, MN; Owner: AMFM RADIO LICENSES, L.L.C.)
KTIS-FM (98.5 FM; MINNEAPOLIS, MN; Owner: NORTHWESTERN COLLEGE)
KDWB-FM (101.3 FM; RICHFIELD, MN; Owner: AMFM RADIO LICENSES, L.L.C.)
KQRS-FM (92.5 FM; GOLDEN VALLEY, MN; Owner: KQRS, Inc.)
KSJN (99.5 FM; MINNEAPOLIS, MN; Owner: MINNESOTA PUBLIC RADIO)
KXXR (93.7 FM; MINNEAPOLIS, MN; Owner: KQRS, INC.)
KJZI (100.3 FM; MINNEAPOLIS, MN; Owner: AMFM RADIO LICENSES, L.L.C.)
WFMP (107.1 FM; COON RAPIDS, MN; Owner: WFMP-FM, LLC)
K214DF (90.7 FM; GOLDEN VALLEY, MN; Owner: EDUCATIONAL MEDIA FOUNDATION)
KBEM-FM (88.5 FM; MINNEAPOLIS, MN; Owner: BD. OF EDUCATION, S.S.D. NO. 1)
KFAI (90.3 FM; MINNEAPOLIS, MN; Owner: FRESH AIR, INC.)
WXPT (104.1 FM; ST. LOUIS PARK, MN; Owner: THE AUDIO HOUSE, INC.)
WLKX-FM (95.9 FM; FOREST LAKE, MN; Owner: LAKES BROADCASTING CO., INC.)
KNOF (95.3 FM; ST. PAUL, MN; Owner: SELBY GOSPEL BROADCASTING CORPORATION)
WCAL (89.3 FM; NORTHFIELD, MN; Owner: ST. OLAF COLLEGE)
TV broadcast stations around Coon Rapids:
KARE (Channel 11; MINNEAPOLIS, MN; Owner: MULTIMEDIA HOLDINGS CORPORATION)
KSTP-TV (Channel 5; ST. PAUL, MN; Owner: HUBBARD BROADCASTING, INC.)
KMSP-TV (Channel 9; MINNEAPOLIS, MN; Owner: FOX TELEVISION STATIONS, INC.)
KTCA-TV (Channel 2; ST. PAUL, MN; Owner: TWIN CITIES PUBLIC TELEVISION, INC.)
WCCO-TV (Channel 4; MINNEAPOLIS, MN; Owner: CBS BROADCASTING INC.)
KSTC-TV (Channel 45; MINNEAPOLIS, MN; Owner: HUBBARD BROADCASTING, INC.)
KTCI-TV (Channel 17; ST. PAUL, MN; Owner: TWIN CITIES PUBLIC TELEVISION, INC.)
KMWB (Channel 23; MINNEAPOLIS, MN; Owner: KLGT LICENSEE, LLC)
WFTC (Channel 29; MINNEAPOLIS, MN; Owner: FOX TELEVISION STATIONS, INC.)
K07UI (Channel 7; MINNEAPOLIS, ETC., MN; Owner: WORD OF GOD FELLOWSHIP, INC.)
K58BS (Channel 58; MINNEAPOLIS, MN; Owner: TRINITY BROADCASTING NETWORK)
K67HG (Channel 67; MINNEAPOLIS, MN; Owner: VENTANA TELEVISION, INC.)
K19ER (Channel 19; ST. PAUL, MN; Owner: CATHOLIC VIEWS BROADCASTS, INC.)
W62BD (Channel 62; MINNEAPOLIS, MN; Owner: WORD OF GOD FELLOWSHIP, INC.)
K14KH (Channel 14; MINNEAPOLIS, MN; Owner: THREE ANGELS BROADCASTING NETWORK)
KPXM (Channel 41; ST. CLOUD, MN; Owner: PAXSON MINNEAPOLIS LICENSE, INC.)
WBWX-CA (Channel 13; MINNEAPOLIS, MN; Owner: THE BOX WORLDWIDE LLC)
National Bridge Inventory (NBI) Statistics 70 Number of bridges794ft / 242m Total length $2,223,001,000 Total costs2,085,169 Total average daily traffic58,159 Total average daily truck traffic
New bridges - historical statistics
6 1960-1969 5 1970-1979 12 1980-1989 32 1990-1999 9 2000-2009 6 2010-2019
See full National Bridge Inventory statistics for Coon Rapids, MN
Home Mortgage Disclosure Act Aggregated Statistics For Year 2009(Based on 15 full tracts) A) FHA, FSA/RHS & VA B) Conventional C) Refinancings D) Home Improvement Loans E) Loans on Dwellings For 5+ Families F) Non-occupant Loans on G) Loans On Manufactured Number Average Value Number Average Value Number Average Value Number Average Value Number Average Value Number Average Value Number Average Value
LOANS ORIGINATED 516 $144,118 247 $114,372 1,234 $152,418 83 $70,386 1 $3,300,000 75 $94,680 1 $26,000 APPLICATIONS APPROVED, NOT ACCEPTED 23 $131,174 16 $82,375 125 $160,232 11 $47,636 0 $0 11 $112,091 4 $35,750 APPLICATIONS DENIED 60 $134,133 32 $91,781 472 $167,169 50 $43,040 0 $0 16 $89,875 9 $30,333 APPLICATIONS WITHDRAWN 37 $137,892 24 $117,083 324 $173,969 22 $70,636 0 $0 15 $124,067 0 $0 FILES CLOSED FOR INCOMPLETENESS 2 $132,000 4 $116,250 125 $139,672 5 $92,000 0 $0 2 $110,000 0 $0
Aggregated Statistics For Year 2008(Based on 15 full tracts) A) FHA, FSA/RHS & VA B) Conventional C) Refinancings D) Home Improvement Loans E) Loans on Dwellings For 5+ Families F) Non-occupant Loans on G) Loans On Manufactured Number Average Value Number Average Value Number Average Value Number Average Value Number Average Value Number Average Value Number Average Value
LOANS ORIGINATED 336 $160,857 313 $156,345 753 $153,347 123 $55,829 2 $1,212,500 77 $146,104 7 $36,571 APPLICATIONS APPROVED, NOT ACCEPTED 29 $172,517 40 $164,425 155 $161,168 28 $42,536 0 $0 14 $129,786 5 $39,000 APPLICATIONS DENIED 38 $176,711 69 $130,333 618 $174,015 82 $40,683 1 $4,000,000 27 $104,926 14 $36,357 APPLICATIONS WITHDRAWN 16 $160,750 27 $182,630 219 $180,982 24 $35,333 0 $0 14 $151,929 0 $0 FILES CLOSED FOR INCOMPLETENESS 2 $156,000 15 $186,133 85 $175,576 11 $102,636 0 $0 3 $143,333 1 $75,000
Aggregated Statistics For Year 2007(Based on 15 full tracts) A) FHA, FSA/RHS & VA B) Conventional C) Refinancings D) Home Improvement Loans E) Loans on Dwellings For 5+ Families F) Non-occupant Loans on G) Loans On Manufactured Number Average Value Number Average Value Number Average Value Number Average Value Number Average Value Number Average Value Number Average Value
LOANS ORIGINATED 65 $192,369 674 $157,056 1,244 $149,991 219 $52,352 7 $1,514,429 102 $149,304 8 $27,625 APPLICATIONS APPROVED, NOT ACCEPTED 0 $0 96 $142,896 293 $151,478 57 $50,351 0 $0 29 $120,655 6 $32,833 APPLICATIONS DENIED 10 $176,500 202 $147,851 1,005 $172,385 127 $61,291 1 $50,000 71 $156,901 39 $35,282 APPLICATIONS WITHDRAWN 3 $184,000 75 $154,387 426 $175,462 31 $76,290 0 $0 20 $170,600 3 $42,000 FILES CLOSED FOR INCOMPLETENESS 0 $0 30 $170,133 121 $186,975 7 $118,000 0 $0 11 $118,636 0 $0
Aggregated Statistics For Year 2006(Based on 15 full tracts) A) FHA, FSA/RHS & VA B) Conventional C) Refinancings D) Home Improvement Loans E) Loans on Dwellings For 5+ Families F) Non-occupant Loans on G) Loans On Manufactured Number Average Value Number Average Value Number Average Value Number Average Value Number Average Value Number Average Value Number Average Value
LOANS ORIGINATED 83 $185,229 1,281 $142,713 1,711 $138,823 281 $54,085 1 $2,269,000 191 $143,654 5 $39,400 APPLICATIONS APPROVED, NOT ACCEPTED 4 $205,250 183 $144,885 393 $139,137 42 $73,619 0 $0 30 $151,067 6 $36,833 APPLICATIONS DENIED 7 $190,857 318 $130,258 1,018 $156,845 148 $69,061 0 $0 61 $160,377 41 $32,976 APPLICATIONS WITHDRAWN 5 $207,600 145 $143,752 633 $168,088 43 $56,884 0 $0 43 $155,419 1 $75,000 FILES CLOSED FOR INCOMPLETENESS 1 $187,000 34 $180,853 190 $172,558 7 $49,857 0 $0 4 $165,000 0 $0
Aggregated Statistics For Year 2005(Based on 15 full tracts) A) FHA, FSA/RHS & VA B) Conventional C) Refinancings D) Home Improvement Loans E) Loans on Dwellings For 5+ Families F) Non-occupant Loans on G) Loans On Manufactured Number Average Value Number Average Value Number Average Value Number Average Value Number Average Value Number Average Value Number Average Value
LOANS ORIGINATED 133 $184,827 1,786 $138,197 2,212 $147,620 256 $49,195 18 $1,616,667 248 $151,391 8 $58,375 APPLICATIONS APPROVED, NOT ACCEPTED 6 $175,167 235 $125,740 337 $137,157 36 $53,194 0 $0 29 $135,724 9 $38,444 APPLICATIONS DENIED 5 $183,200 382 $118,537 1,055 $159,880 140 $63,200 0 $0 52 $133,923 70 $34,986 APPLICATIONS WITHDRAWN 3 $192,667 210 $164,105 776 $165,385 71 $84,099 0 $0 44 $139,250 1 $37,000 FILES CLOSED FOR INCOMPLETENESS 0 $0 89 $134,348 351 $166,182 12 $59,667 0 $0 10 $116,600 0 $0
Aggregated Statistics For Year 2004(Based on 15 full tracts) A) FHA, FSA/RHS & VA B) Conventional C) Refinancings D) Home Improvement Loans E) Loans on Dwellings For 5+ Families F) Non-occupant Loans on G) Loans On Manufactured Number Average Value Number Average Value Number Average Value Number Average Value Number Average Value Number Average Value Number Average Value
LOANS ORIGINATED 194 $175,928 1,566 $148,612 2,502 $142,233 268 $53,504 5 $3,757,000 179 $154,497 20 $36,000 APPLICATIONS APPROVED, NOT ACCEPTED 2 $180,000 187 $139,262 342 $142,164 39 $86,513 1 $560,000 26 $148,885 15 $39,800 APPLICATIONS DENIED 11 $153,636 325 $132,720 973 $147,268 161 $42,093 0 $0 67 $137,657 58 $35,862 APPLICATIONS WITHDRAWN 6 $172,667 149 $133,396 651 $152,851 49 $71,633 0 $0 22 $160,955 2 $128,500 FILES CLOSED FOR INCOMPLETENESS 1 $187,000 35 $166,714 332 $164,678 14 $44,500 0 $0 5 $151,600 0 $0
Aggregated Statistics For Year 2003(Based on 15 full tracts) A) FHA, FSA/RHS & VA B) Conventional C) Refinancings D) Home Improvement Loans E) Loans on Dwellings For 5+ Families F) Non-occupant Loans on Number Average Value Number Average Value Number Average Value Number Average Value Number Average Value Number Average Value
LOANS ORIGINATED 292 $165,527 1,401 $150,009 5,292 $129,539 292 $34,949 4 $292,500 156 $133,590 APPLICATIONS APPROVED, NOT ACCEPTED 13 $148,692 172 $127,855 542 $130,710 35 $39,943 0 $0 36 $113,167 APPLICATIONS DENIED 23 $168,130 216 $112,319 1,372 $132,860 121 $30,050 0 $0 51 $127,196 APPLICATIONS WITHDRAWN 17 $173,235 152 $149,467 928 $133,130 23 $43,130 0 $0 31 $112,129 FILES CLOSED FOR INCOMPLETENESS 9 $173,333 25 $153,800 211 $138,569 14 $29,214 0 $0 4 $162,000
Aggregated Statistics For Year 2002(Based on 9 full tracts) A) FHA, FSA/RHS & VA B) Conventional C) Refinancings D) Home Improvement Loans E) Loans on Dwellings For 5+ Families F) Non-occupant Loans on Number Average Value Number Average Value Number Average Value Number Average Value Number Average Value Number Average Value
LOANS ORIGINATED 214 $151,692 600 $130,525 2,181 $120,768 155 $27,948 2 $907,500 80 $117,038 APPLICATIONS APPROVED, NOT ACCEPTED 11 $143,091 53 $156,962 268 $112,000 33 $31,758 0 $0 5 $149,200 APPLICATIONS DENIED 14 $152,143 79 $92,329 540 $109,787 74 $20,095 0 $0 6 $113,333 APPLICATIONS WITHDRAWN 7 $171,857 53 $139,679 406 $127,037 20 $27,400 0 $0 5 $113,600 FILES CLOSED FOR INCOMPLETENESS 2 $159,000 12 $138,500 135 $119,659 6 $23,333 0 $0 3 $109,667
Aggregated Statistics For Year 2001(Based on 9 full tracts) A) FHA, FSA/RHS & VA B) Conventional C) Refinancings D) Home Improvement Loans E) Loans on Dwellings For 5+ Families F) Non-occupant Loans on Number Average Value Number Average Value Number Average Value Number Average Value Number Average Value Number Average Value
LOANS ORIGINATED 257 $138,533 507 $115,714 1,897 $104,628 167 $23,263 5 $729,000 66 $112,288 APPLICATIONS APPROVED, NOT ACCEPTED 5 $139,600 41 $91,585 175 $95,926 23 $32,870 0 $0 3 $97,000 APPLICATIONS DENIED 12 $122,833 109 $79,541 504 $86,746 107 $22,720 0 $0 11 $102,727 APPLICATIONS WITHDRAWN 7 $122,571 28 $125,000 364 $107,099 25 $22,040 0 $0 2 $154,000 FILES CLOSED FOR INCOMPLETENESS 2 $150,500 17 $54,824 108 $106,333 8 $39,250 0 $0 0 $0
Aggregated Statistics For Year 2000(Based on 9 full tracts) A) FHA, FSA/RHS & VA B) Conventional C) Refinancings D) Home Improvement Loans E) Loans on Dwellings For 5+ Families F) Non-occupant Loans on Number Average Value Number Average Value Number Average Value Number Average Value Number Average Value Number Average Value
LOANS ORIGINATED 253 $123,980 493 $99,079 550 $76,776 217 $22,230 1 $800,000 17 $77,647 APPLICATIONS APPROVED, NOT ACCEPTED 7 $111,143 60 $62,733 103 $71,835 39 $19,821 0 $0 0 $0 APPLICATIONS DENIED 6 $119,000 151 $57,205 298 $70,084 107 $22,579 0 $0 5 $81,800 APPLICATIONS WITHDRAWN 7 $116,000 36 $106,778 179 $84,000 25 $39,080 0 $0 5 $61,000 FILES CLOSED FOR INCOMPLETENESS 2 $95,000 4 $87,750 113 $97,655 2 $23,500 0 $0 1 $15,000
Aggregated Statistics For Year 1999(Based on 12 full tracts) A) FHA, FSA/RHS & VA B) Conventional C) Refinancings D) Home Improvement Loans E) Loans on Dwellings For 5+ Families F) Non-occupant Loans on Number Average Value Number Average Value Number Average Value Number Average Value Number Average Value Number Average Value
LOANS ORIGINATED 641 $110,417 1,030 $98,918 1,497 $82,844 308 $17,968 4 $1,475,618 30 $77,390 APPLICATIONS APPROVED, NOT ACCEPTED 13 $110,316 102 $68,812 258 $80,140 61 $17,456 0 $0 7 $53,614 APPLICATIONS DENIED 25 $101,707 285 $52,099 628 $74,028 143 $22,659 0 $0 18 $53,963 APPLICATIONS WITHDRAWN 27 $98,464 78 $104,643 373 $87,206 61 $43,995 0 $0 7 $66,566 FILES CLOSED FOR INCOMPLETENESS 2 $103,960 16 $93,246 179 $92,752 1 $18,000 0 $0 2 $98,595
Detailed mortgage data for all 15 tracts in Coon Rapids, MN
Private Mortgage Insurance Companies Aggregated Statistics For Year 2009(Based on 15 full tracts) A) Conventional B) Refinancings Number Average Value Number Average Value
LOANS ORIGINATED 46 $150,152 27 $175,000 APPLICATIONS APPROVED, NOT ACCEPTED 9 $156,667 6 $222,500 APPLICATIONS DENIED 2 $167,000 8 $170,875 APPLICATIONS WITHDRAWN 0 $0 6 $171,333 FILES CLOSED FOR INCOMPLETENESS 4 $141,750 1 $97,000
Aggregated Statistics For Year 2008(Based on 15 full tracts) A) Conventional B) Refinancings C) Non-occupant Loans on Number Average Value Number Average Value Number Average Value
LOANS ORIGINATED 134 $173,746 69 $194,449 10 $136,700 APPLICATIONS APPROVED, NOT ACCEPTED 41 $177,927 48 $210,396 7 $178,571 APPLICATIONS DENIED 15 $176,200 12 $186,083 3 $211,000 APPLICATIONS WITHDRAWN 19 $180,842 3 $184,333 2 $159,500 FILES CLOSED FOR INCOMPLETENESS 4 $183,250 3 $214,667 2 $220,500
Aggregated Statistics For Year 2007(Based on 15 full tracts) A) Conventional B) Refinancings C) Non-occupant Loans on Number Average Value Number Average Value Number Average Value
LOANS ORIGINATED 347 $186,648 147 $208,762 9 $185,667 APPLICATIONS APPROVED, NOT ACCEPTED 37 $189,514 40 $211,825 5 $197,400 APPLICATIONS DENIED 3 $419,000 1 $405,000 0 $0 APPLICATIONS WITHDRAWN 10 $179,300 7 $199,143 1 $238,000 FILES CLOSED FOR INCOMPLETENESS 2 $161,500 0 $0 0 $0
Aggregated Statistics For Year 2006(Based on 15 full tracts) A) Conventional B) Refinancings C) Non-occupant Loans on Number Average Value Number Average Value Number Average Value
LOANS ORIGINATED 177 $196,288 70 $201,214 8 $139,375 APPLICATIONS APPROVED, NOT ACCEPTED 13 $206,538 20 $187,650 0 $0 APPLICATIONS DENIED 5 $158,200 3 $235,000 2 $197,500 APPLICATIONS WITHDRAWN 12 $220,833 12 $211,417 0 $0 FILES CLOSED FOR INCOMPLETENESS 0 $0 1 $162,000 0 $0
Aggregated Statistics For Year 2005(Based on 15 full tracts) A) Conventional B) Refinancings C) Non-occupant Loans on Number Average Value Number Average Value Number Average Value
LOANS ORIGINATED 142 $204,690 132 $182,811 11 $168,000 APPLICATIONS APPROVED, NOT ACCEPTED 23 $199,130 34 $171,529 3 $159,667 APPLICATIONS DENIED 3 $152,667 1 $221,000 0 $0 APPLICATIONS WITHDRAWN 10 $189,900 13 $189,923 1 $202,000 FILES CLOSED FOR INCOMPLETENESS 1 $198,000 2 $191,500 0 $0
Aggregated Statistics For Year 2004(Based on 15 full tracts) A) Conventional B) Refinancings C) Non-occupant Loans on Number Average Value Number Average Value Number Average Value
LOANS ORIGINATED 289 $183,017 163 $179,613 22 $160,000 APPLICATIONS APPROVED, NOT ACCEPTED 37 $183,541 44 $173,114 5 $148,600 APPLICATIONS DENIED 3 $184,667 3 $192,667 2 $178,000 APPLICATIONS WITHDRAWN 24 $185,250 21 $168,667 10 $182,100 FILES CLOSED FOR INCOMPLETENESS 1 $134,000 8 $166,625 1 $134,000
Aggregated Statistics For Year 2003(Based on 15 full tracts) A) Conventional B) Refinancings C) Non-occupant Loans on Number Average Value Number Average Value Number Average Value
LOANS ORIGINATED 446 $169,085 449 $156,412 29 $144,241 APPLICATIONS APPROVED, NOT ACCEPTED 44 $157,364 136 $159,272 5 $143,000 APPLICATIONS DENIED 7 $169,143 8 $175,875 3 $176,667 APPLICATIONS WITHDRAWN 19 $197,211 39 $162,692 3 $172,333 FILES CLOSED FOR INCOMPLETENESS 1 $117,000 3 $150,333 1 $150,000
Aggregated Statistics For Year 2002(Based on 9 full tracts) A) Conventional B) Refinancings C) Non-occupant Loans on Number Average Value Number Average Value Number Average Value
LOANS ORIGINATED 202 $156,431 203 $152,887 9 $125,556 APPLICATIONS APPROVED, NOT ACCEPTED 15 $144,333 32 $138,500 2 $115,000 APPLICATIONS DENIED 3 $164,000 2 $156,000 0 $0 APPLICATIONS WITHDRAWN 4 $147,750 17 $149,000 2 $162,000 FILES CLOSED FOR INCOMPLETENESS 1 $123,000 0 $0 0 $0
Aggregated Statistics For Year 2001(Based on 9 full tracts) A) Conventional B) Refinancings C) Non-occupant Loans on Number Average Value Number Average Value Number Average Value
LOANS ORIGINATED 189 $138,360 209 $140,249 15 $119,867 APPLICATIONS APPROVED, NOT ACCEPTED 17 $119,235 30 $128,133 5 $111,000 APPLICATIONS DENIED 3 $133,333 2 $117,000 4 $130,500 APPLICATIONS WITHDRAWN 2 $123,500 10 $151,100 2 $127,000 FILES CLOSED FOR INCOMPLETENESS 4 $149,000 0 $0 1 $132,000
Aggregated Statistics For Year 2000(Based on 9 full tracts) A) Conventional B) Refinancings C) Non-occupant Loans on Number Average Value Number Average Value Number Average Value
LOANS ORIGINATED 168 $121,750 54 $117,500 1 $74,000 APPLICATIONS APPROVED, NOT ACCEPTED 20 $133,000 12 $115,833 0 $0 APPLICATIONS DENIED 6 $176,167 2 $101,000 0 $0 APPLICATIONS WITHDRAWN 2 $199,000 2 $103,500 0 $0 FILES CLOSED FOR INCOMPLETENESS 2 $166,000 1 $113,000 0 $0
Aggregated Statistics For Year 1999(Based on 12 full tracts) A) Conventional B) Refinancings C) Non-occupant Loans on Number Average Value Number Average Value Number Average Value
LOANS ORIGINATED 354 $117,428 197 $107,981 5 $99,004 APPLICATIONS APPROVED, NOT ACCEPTED 20 $116,977 26 $108,190 0 $0 APPLICATIONS DENIED 14 $120,316 6 $138,120 0 $0 APPLICATIONS WITHDRAWN 3 $122,360 5 $98,672 0 $0 FILES CLOSED FOR INCOMPLETENESS 1 $93,000 2 $84,440 0 $0
Fire-safe hotels and motels in Coon Rapids, Minnesota:
Country Suites By Carlson Coon Rapids, 155 Coon Rapids Blvd, Coon Rapids, Minnesota 55433 Phone: (763) 780-3797, Fax: (763) 780-8958
Holiday Inn Express & Suites Coon Rapids-Blaine Area, 9333 Springbrook Dr, Coon Rapids, Minnesota 55433 Phone: (763) 792-9292, Fax: (763) 792-9188
All 2 fire-safe hotels and motels in Coon Rapids, Minnesota Coon Rapids compared to Minnesota state average:
Unemployed percentage significantly below state average. Median age below state average. Length of stay since moving in significantly above state average. Coon Rapids on our top lists :
#6 on the list of "Top 101 cities with the coldest winters (population 50,000+)"
#8 on the list of "Top 101 cities with the lowest daily low temperatures (population 50,000+)"
#12 on the list of "Top 101 cities with the lowest average temperatures (population 50,000+)"
#15 on the list of "Top 101 cities with the largest temperature differences during a year (population 50,000+)"
#26 on the list of "Top 101 cities with the smallest household incomes disparities (population 50,000+)"
#42 on the list of "Top 101 cities with the smallest house values disparities (population 50,000+)"
#48 on the list of "Top 101 cities with the least people below 50% of the poverty level (population 50,000+)"
#54 on the list of "Top 101 cities with the smallest percentage of high school students in private schools (3,000+ students)"
#61 on the list of "Top 101 cities with largest percentage of females in industries: manufacturing (population 50,000+)"
#68 on the list of "Top 101 cities with the largest city-data.com crime index increase from 2002 to 2012 (population 50,000+)"
#73 on the list of "Top 101 cities with the lowest number of police officers per 1000 residents (population 50,000+)"
#78 on the list of "Top 101 cities with largest percentage of males in industries: manufacturing (population 50,000+)"
#79 on the list of "Top 101 cities with the lowest number of robberies per 100,000 residents (population 50,000+)"
#81 on the list of "Top 101 cities with the largest city-data.com crime index per police officer (population 50,000+)"
#88 on the list of "Top 101 cities with the lowest number of burglaries per 100,000 residents (population 50,000+)"
#93 on the list of "Top 101 cities with the lowest number of assaults per 100,000 residents (population 50,000+)"
#96 on the list of "Top 101 cities with the most people born in the same U.S. state as the city (population 50,000+)"
#97 on the list of "Top 101 cities with largest percentage of females in occupations: production occupations (population 50,000+)"
#99 on the list of "Top 100 low-educated but high-earning cities (pop. 50,000+)"
#100 on the list of "Top 100 cities with biggest houses (pop. 50,000+)"
#22 on the list of "Top 101 counties with the lowest number of infant deaths per 1000 residents 2007-2013 (pop. 50,000+)"
#24 on the list of "Top 101 counties with the highest percentage of residents that exercised in the past month"
#31 on the list of "Top 101 counties with the highest carbon monoxide air pollution readings in 2012 (ppm)"
#33 on the list of "Top 101 counties with the largest increase in the number of deaths per 1000 residents 2000-2006 to 2007-2013 (pop. 50,000+)"
#37 on the list of "Top 101 counties with the lowest number of deaths per 1000 residents 2007-2013 (pop. 50,000+)"
Top Patent Applicants
Jeffrey M. Gillberg (54)
David L. Perschbacher (49)
Wade M. Demmer (47)
John E. Burnes (37)
Allen Gaynor (37)
John L. Sommer (35)
Jonathan P. Roberts (18)
Robert M. Skime (17)
Johann J. Neisz (16)
Martin A. Rossing (16)
Total of 1032 patent applications in 2008-2024.


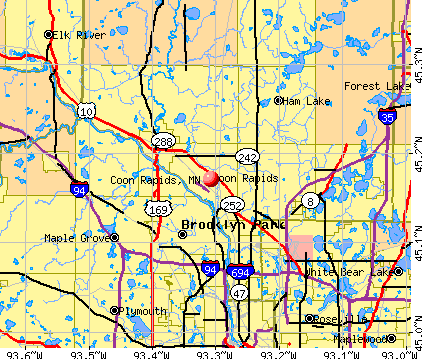


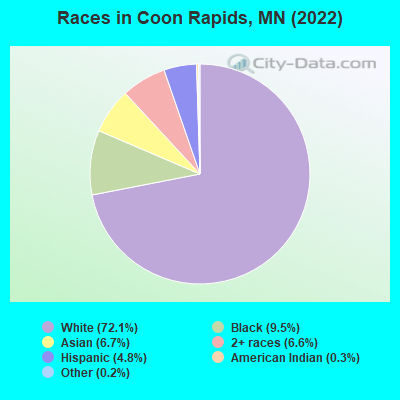
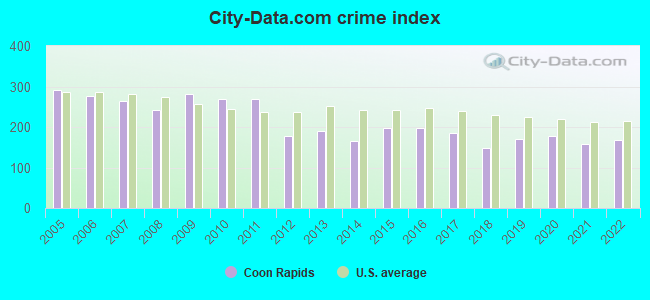
 Recent articles from our blog. Our writers, many of them Ph.D. graduates or candidates, create easy-to-read articles on a wide variety of topics.

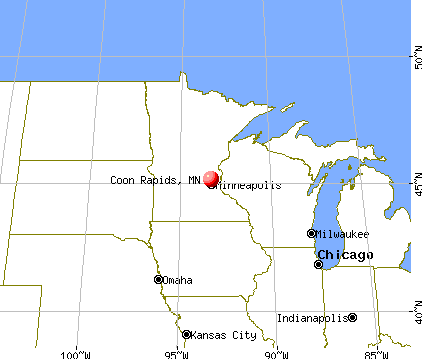
 (14.4 miles
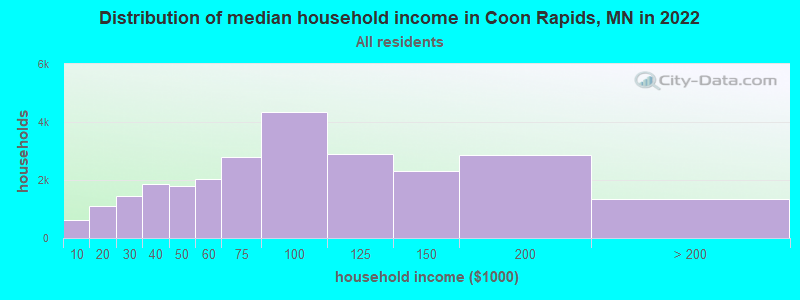
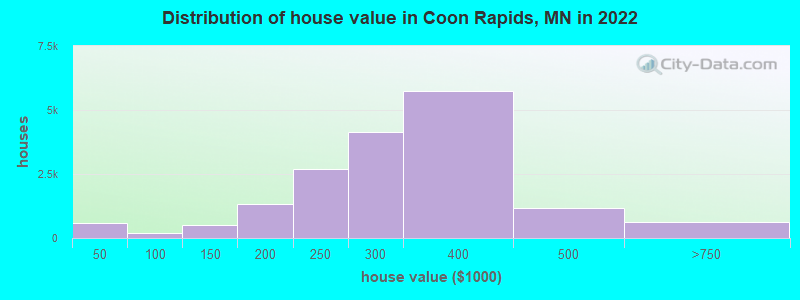
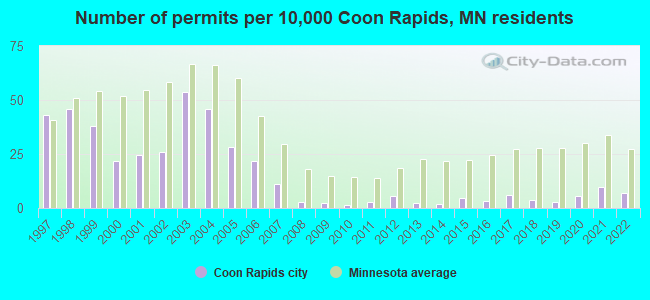
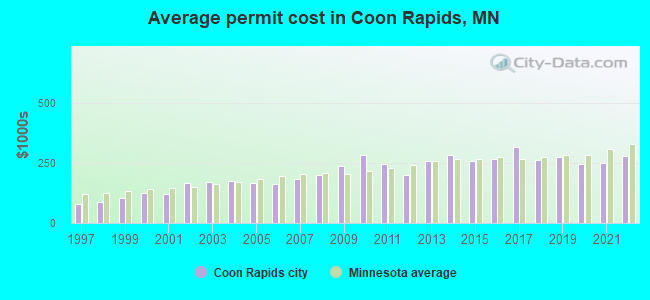
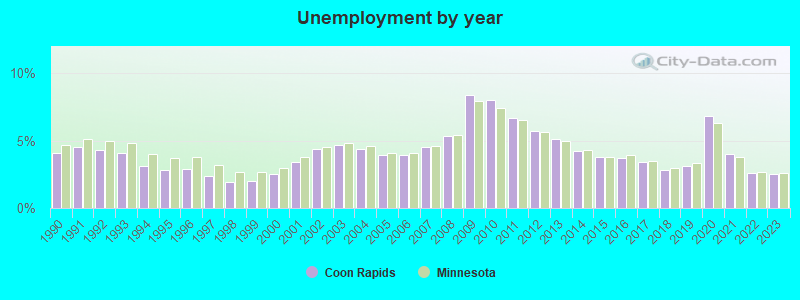
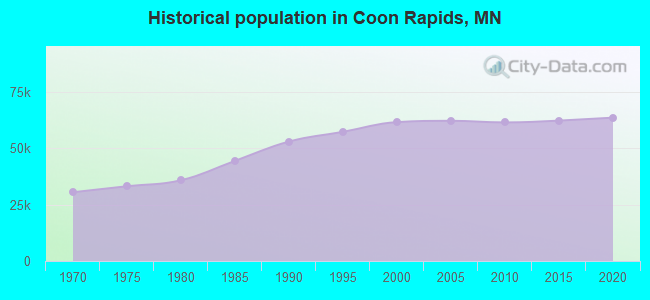
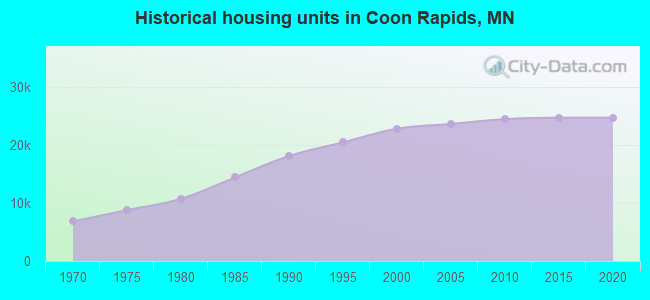
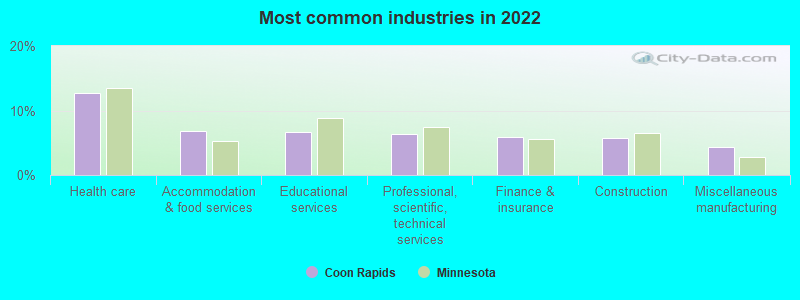
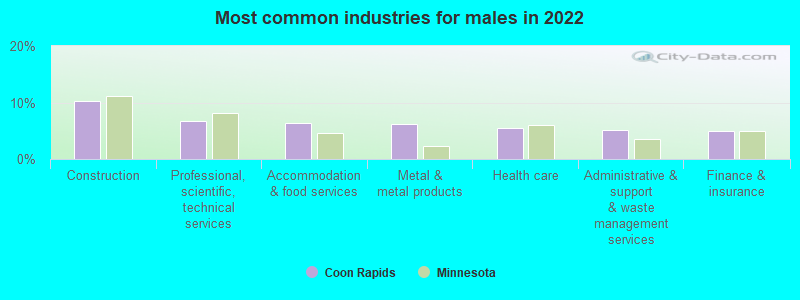
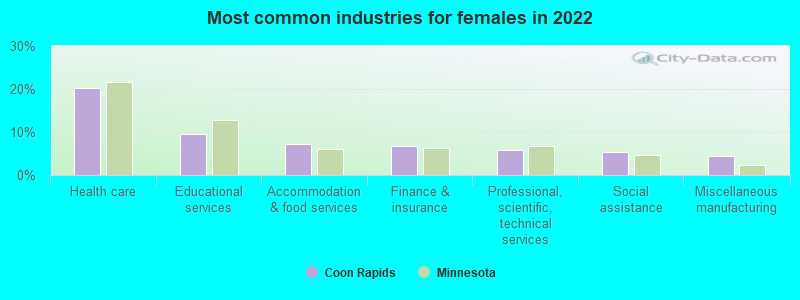
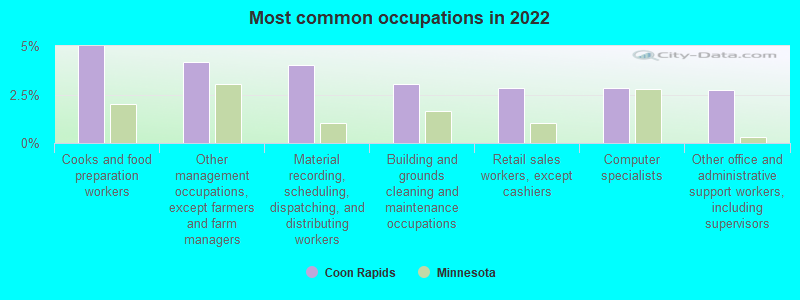
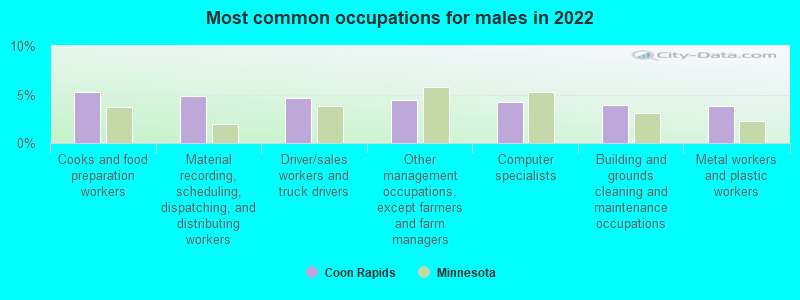
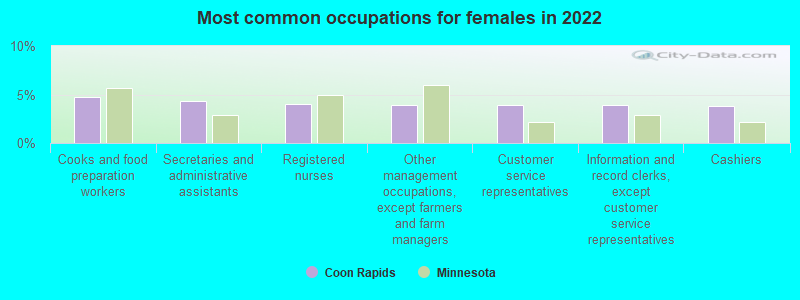
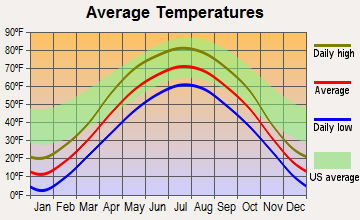
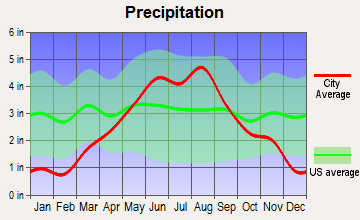
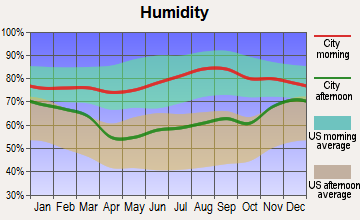
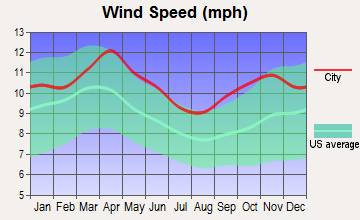
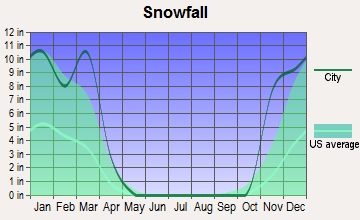
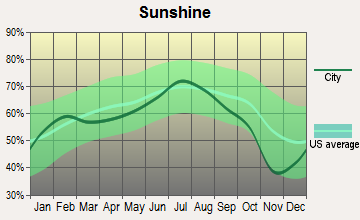
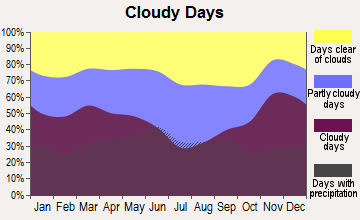
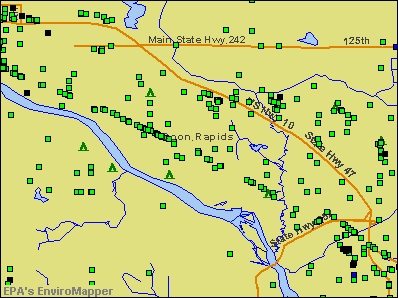

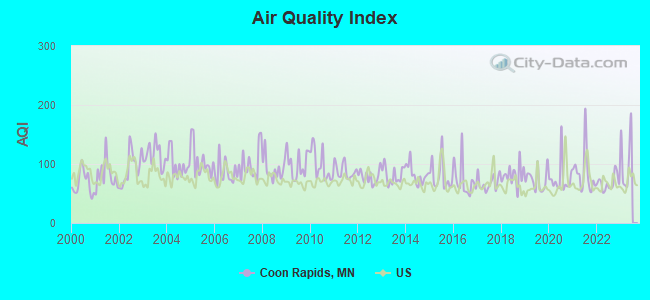
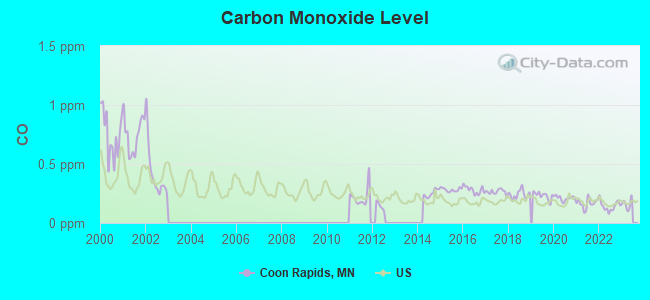
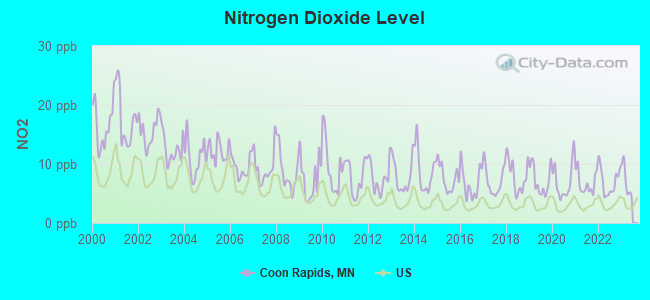
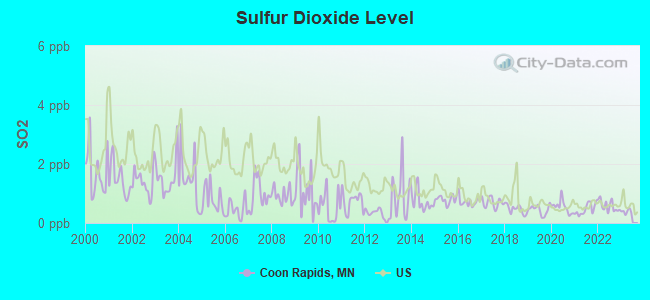
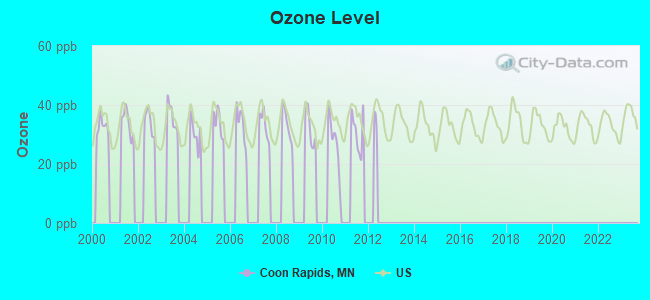
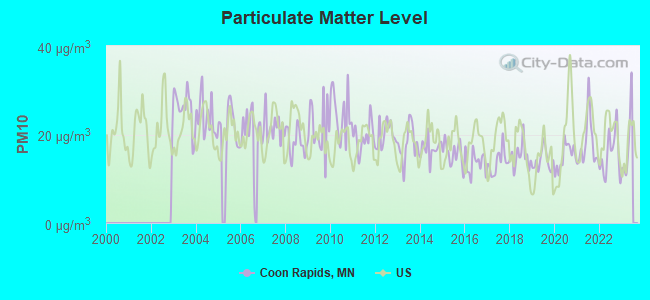
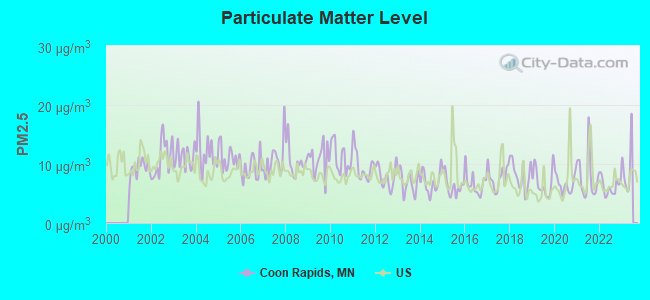
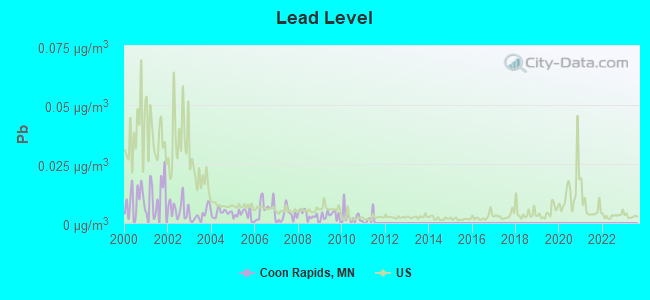
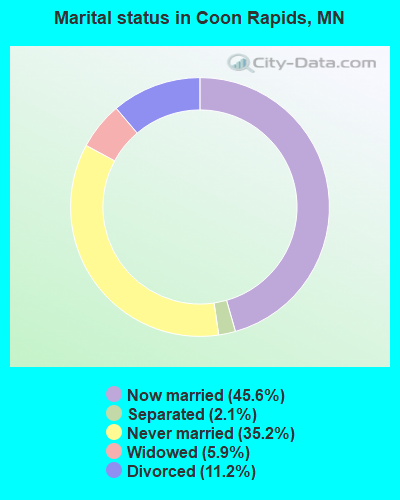
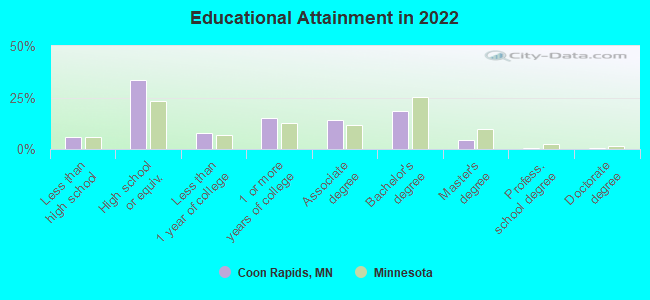
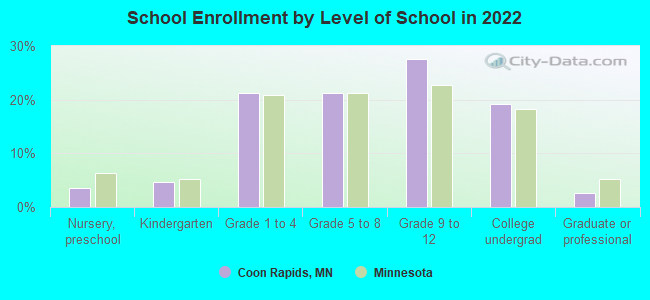
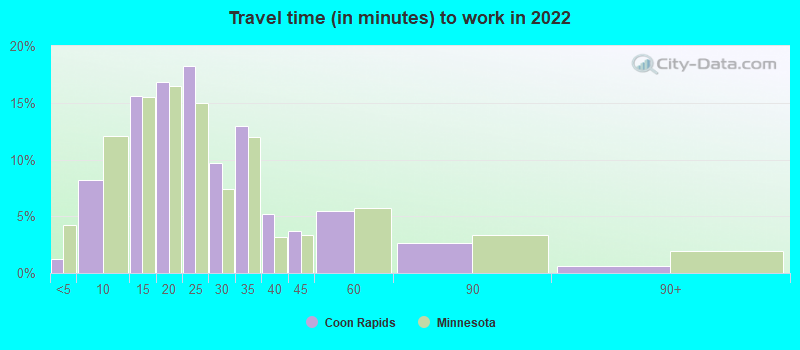
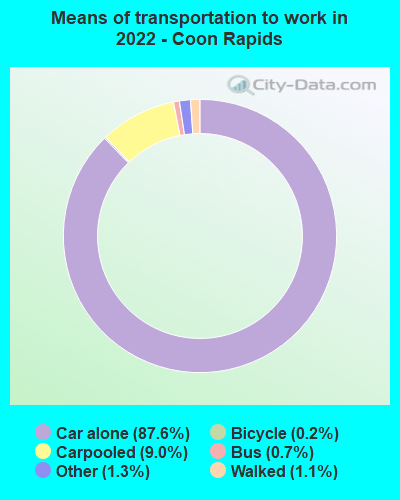
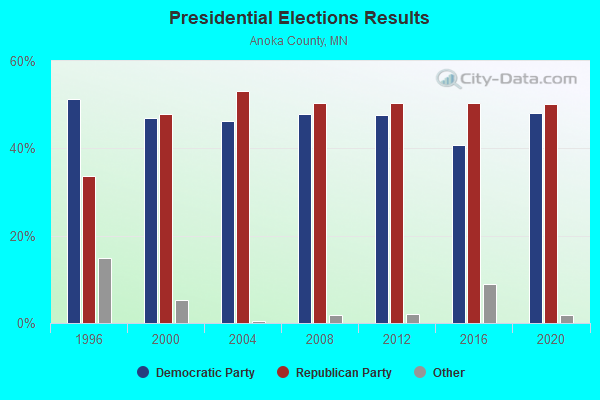
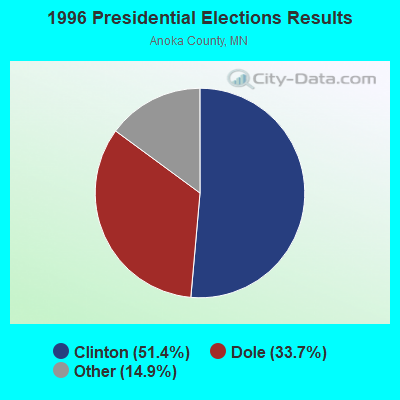
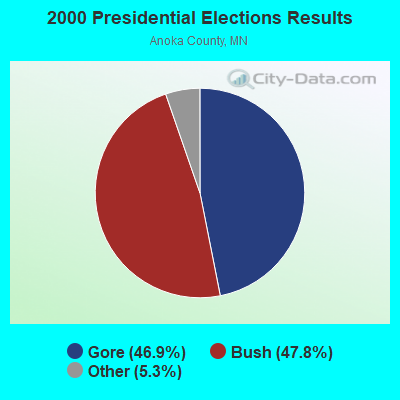
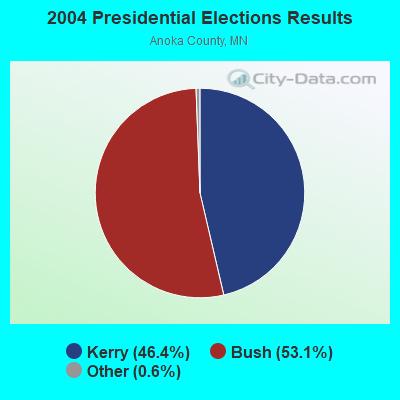
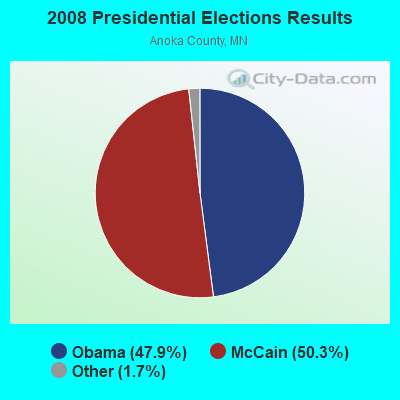

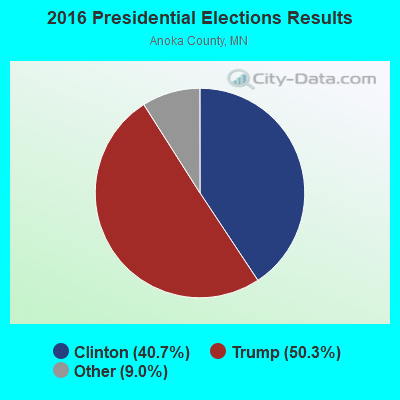
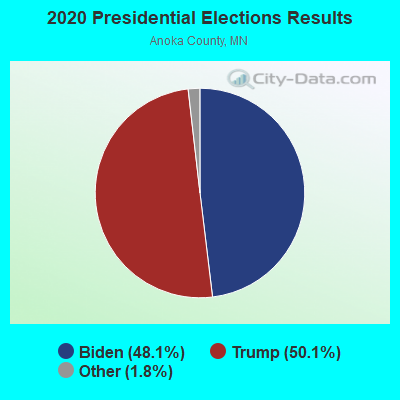
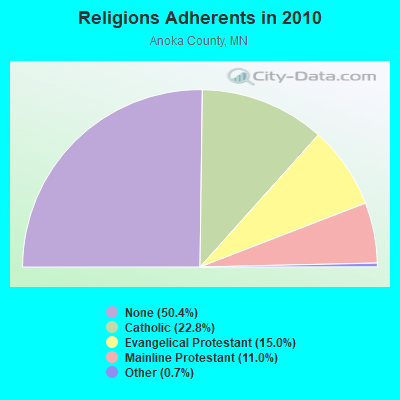
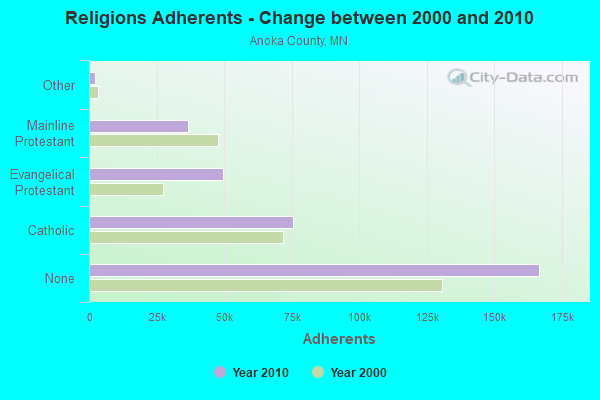
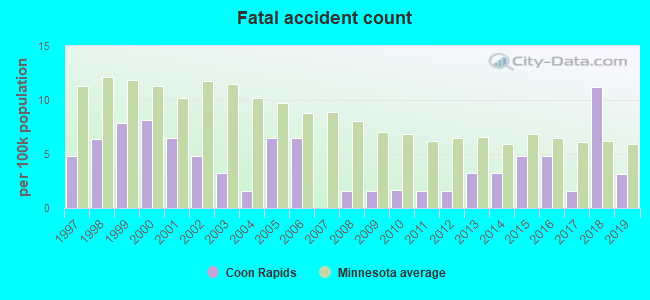
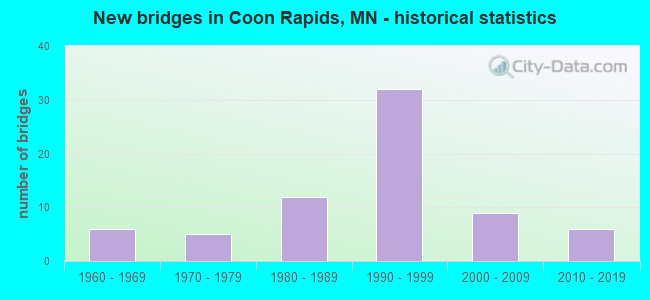
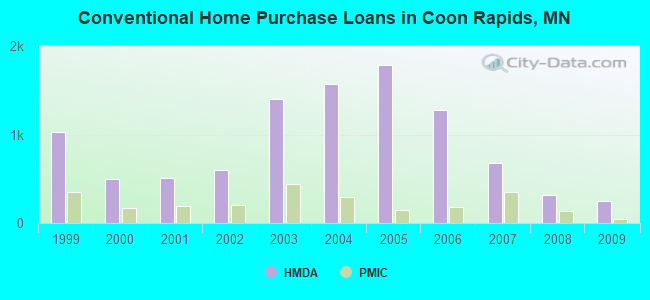
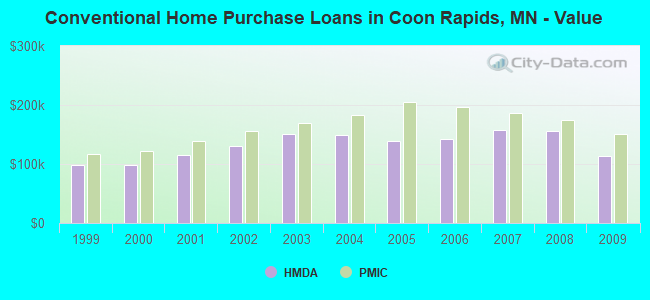
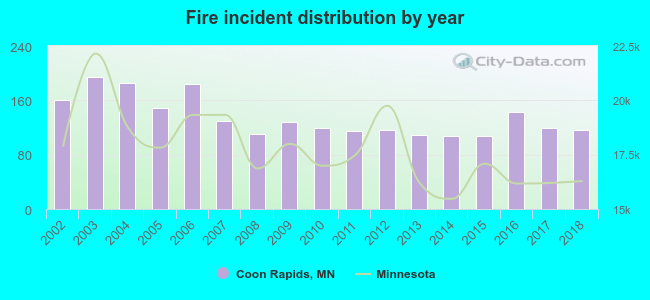 According to the data from the years 2002 - 2018 the average number of fire incidents per year is 135. The highest number of fire incidents - 194 took place in 2003, and the least - 107 in 2014. The data has a dropping trend.
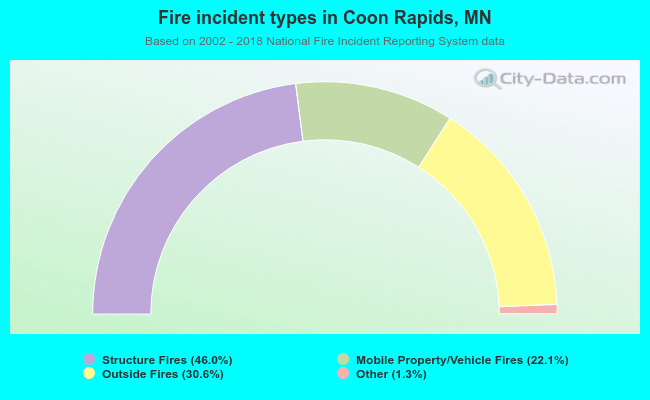 When looking into fire subcategories, the most reports belonged to: Structure Fires (46.0%), and Outside Fires (30.6%).