Andover, Minnesota Submit your own pictures of this city and show them to the world
OSM Map
General Map
Google Map
MSN Map
OSM Map
General Map
Google Map
MSN Map
OSM Map
General Map
Google Map
MSN Map
OSM Map
General Map
Google Map
MSN Map
Please wait while loading the map...
Population in 2022: 32,928 (90% urban, 10% rural). Population change since 2000: +23.8%Males: 16,417 Females: 16,511
March 2022 cost of living index in Andover: 114.6 (more than average, U.S. average is 100) Percentage of residents living in poverty in 2022: 3.3%for White Non-Hispanic residents , 9.0% for Black residents , 6.3% for other race residents , 0.6% for two or more races residents )
Profiles of local businesses
Business Search - 14 Million verified businesses
Data:
Median household income ($)
Median household income (% change since 2000)
Household income diversity
Ratio of average income to average house value (%)
Ratio of average income to average rent
Median household income ($) - White
Median household income ($) - Black or African American
Median household income ($) - Asian
Median household income ($) - Hispanic or Latino
Median household income ($) - American Indian and Alaska Native
Median household income ($) - Multirace
Median household income ($) - Other Race
Median household income for houses/condos with a mortgage ($)
Median household income for apartments without a mortgage ($)
Races - White alone (%)
Races - White alone (% change since 2000)
Races - Black alone (%)
Races - Black alone (% change since 2000)
Races - American Indian alone (%)
Races - American Indian alone (% change since 2000)
Races - Asian alone (%)
Races - Asian alone (% change since 2000)
Races - Hispanic (%)
Races - Hispanic (% change since 2000)
Races - Native Hawaiian and Other Pacific Islander alone (%)
Races - Native Hawaiian and Other Pacific Islander alone (% change since 2000)
Races - Two or more races (%)
Races - Two or more races (% change since 2000)
Races - Other race alone (%)
Races - Other race alone (% change since 2000)
Racial diversity
Unemployment (%)
Unemployment (% change since 2000)
Unemployment (%) - White
Unemployment (%) - Black or African American
Unemployment (%) - Asian
Unemployment (%) - Hispanic or Latino
Unemployment (%) - American Indian and Alaska Native
Unemployment (%) - Multirace
Unemployment (%) - Other Race
Population density (people per square mile)
Population - Males (%)
Population - Females (%)
Population - Males (%) - White
Population - Males (%) - Black or African American
Population - Males (%) - Asian
Population - Males (%) - Hispanic or Latino
Population - Males (%) - American Indian and Alaska Native
Population - Males (%) - Multirace
Population - Males (%) - Other Race
Population - Females (%) - White
Population - Females (%) - Black or African American
Population - Females (%) - Asian
Population - Females (%) - Hispanic or Latino
Population - Females (%) - American Indian and Alaska Native
Population - Females (%) - Multirace
Population - Females (%) - Other Race
Coronavirus confirmed cases (Apr 27, 2024)
Deaths caused by coronavirus (Apr 27, 2024)
Coronavirus confirmed cases (per 100k population) (Apr 27, 2024)
Deaths caused by coronavirus (per 100k population) (Apr 27, 2024)
Daily increase in number of cases (Apr 27, 2024)
Weekly increase in number of cases (Apr 27, 2024)
Cases doubled (in days) (Apr 27, 2024)
Hospitalized patients (Apr 18, 2022)
Negative test results (Apr 18, 2022)
Total test results (Apr 18, 2022)
COVID Vaccine doses distributed (per 100k population) (Sep 19, 2023)
COVID Vaccine doses administered (per 100k population) (Sep 19, 2023)
COVID Vaccine doses distributed (Sep 19, 2023)
COVID Vaccine doses administered (Sep 19, 2023)
Likely homosexual households (%)
Likely homosexual households (% change since 2000)
Likely homosexual households - Lesbian couples (%)
Likely homosexual households - Lesbian couples (% change since 2000)
Likely homosexual households - Gay men (%)
Likely homosexual households - Gay men (% change since 2000)
Cost of living index
Median gross rent ($)
Median contract rent ($)
Median monthly housing costs ($)
Median house or condo value ($)
Median house or condo value ($ change since 2000)
Mean house or condo value by units in structure - 1, detached ($)
Mean house or condo value by units in structure - 1, attached ($)
Mean house or condo value by units in structure - 2 ($)
Mean house or condo value by units in structure by units in structure - 3 or 4 ($)
Mean house or condo value by units in structure - 5 or more ($)
Mean house or condo value by units in structure - Boat, RV, van, etc. ($)
Mean house or condo value by units in structure - Mobile home ($)
Median house or condo value ($) - White
Median house or condo value ($) - Black or African American
Median house or condo value ($) - Asian
Median house or condo value ($) - Hispanic or Latino
Median house or condo value ($) - American Indian and Alaska Native
Median house or condo value ($) - Multirace
Median house or condo value ($) - Other Race
Median resident age
Resident age diversity
Median resident age - Males
Median resident age - Females
Median resident age - White
Median resident age - Black or African American
Median resident age - Asian
Median resident age - Hispanic or Latino
Median resident age - American Indian and Alaska Native
Median resident age - Multirace
Median resident age - Other Race
Median resident age - Males - White
Median resident age - Males - Black or African American
Median resident age - Males - Asian
Median resident age - Males - Hispanic or Latino
Median resident age - Males - American Indian and Alaska Native
Median resident age - Males - Multirace
Median resident age - Males - Other Race
Median resident age - Females - White
Median resident age - Females - Black or African American
Median resident age - Females - Asian
Median resident age - Females - Hispanic or Latino
Median resident age - Females - American Indian and Alaska Native
Median resident age - Females - Multirace
Median resident age - Females - Other Race
Commute - mean travel time to work (minutes)
Travel time to work - Less than 5 minutes (%)
Travel time to work - Less than 5 minutes (% change since 2000)
Travel time to work - 5 to 9 minutes (%)
Travel time to work - 5 to 9 minutes (% change since 2000)
Travel time to work - 10 to 19 minutes (%)
Travel time to work - 10 to 19 minutes (% change since 2000)
Travel time to work - 20 to 29 minutes (%)
Travel time to work - 20 to 29 minutes (% change since 2000)
Travel time to work - 30 to 39 minutes (%)
Travel time to work - 30 to 39 minutes (% change since 2000)
Travel time to work - 40 to 59 minutes (%)
Travel time to work - 40 to 59 minutes (% change since 2000)
Travel time to work - 60 to 89 minutes (%)
Travel time to work - 60 to 89 minutes (% change since 2000)
Travel time to work - 90 or more minutes (%)
Travel time to work - 90 or more minutes (% change since 2000)
Marital status - Never married (%)
Marital status - Now married (%)
Marital status - Separated (%)
Marital status - Widowed (%)
Marital status - Divorced (%)
Median family income ($)
Median family income (% change since 2000)
Median non-family income ($)
Median non-family income (% change since 2000)
Median per capita income ($)
Median per capita income (% change since 2000)
Median family income ($) - White
Median family income ($) - Black or African American
Median family income ($) - Asian
Median family income ($) - Hispanic or Latino
Median family income ($) - American Indian and Alaska Native
Median family income ($) - Multirace
Median family income ($) - Other Race
Median year house/condo built
Median year apartment built
Year house built - Built 2005 or later (%)
Year house built - Built 2000 to 2004 (%)
Year house built - Built 1990 to 1999 (%)
Year house built - Built 1980 to 1989 (%)
Year house built - Built 1970 to 1979 (%)
Year house built - Built 1960 to 1969 (%)
Year house built - Built 1950 to 1959 (%)
Year house built - Built 1940 to 1949 (%)
Year house built - Built 1939 or earlier (%)
Average household size
Household density (households per square mile)
Average household size - White
Average household size - Black or African American
Average household size - Asian
Average household size - Hispanic or Latino
Average household size - American Indian and Alaska Native
Average household size - Multirace
Average household size - Other Race
Occupied housing units (%)
Vacant housing units (%)
Owner occupied housing units (%)
Renter occupied housing units (%)
Vacancy status - For rent (%)
Vacancy status - For sale only (%)
Vacancy status - Rented or sold, not occupied (%)
Vacancy status - For seasonal, recreational, or occasional use (%)
Vacancy status - For migrant workers (%)
Vacancy status - Other vacant (%)
Residents with income below the poverty level (%)
Residents with income below 50% of the poverty level (%)
Children below poverty level (%)
Poor families by family type - Married-couple family (%)
Poor families by family type - Male, no wife present (%)
Poor families by family type - Female, no husband present (%)
Poverty status for native-born residents (%)
Poverty status for foreign-born residents (%)
Poverty among high school graduates not in families (%)
Poverty among people who did not graduate high school not in families (%)
Residents with income below the poverty level (%) - White
Residents with income below the poverty level (%) - Black or African American
Residents with income below the poverty level (%) - Asian
Residents with income below the poverty level (%) - Hispanic or Latino
Residents with income below the poverty level (%) - American Indian and Alaska Native
Residents with income below the poverty level (%) - Multirace
Residents with income below the poverty level (%) - Other Race
Air pollution - Air Quality Index (AQI)
Air pollution - CO
Air pollution - NO2
Air pollution - SO2
Air pollution - Ozone
Air pollution - PM10
Air pollution - PM25
Air pollution - Pb
Crime - Murders per 100,000 population
Crime - Rapes per 100,000 population
Crime - Robberies per 100,000 population
Crime - Assaults per 100,000 population
Crime - Burglaries per 100,000 population
Crime - Thefts per 100,000 population
Crime - Auto thefts per 100,000 population
Crime - Arson per 100,000 population
Crime - City-data.com crime index
Crime - Violent crime index
Crime - Property crime index
Crime - Murders per 100,000 population (5 year average)
Crime - Rapes per 100,000 population (5 year average)
Crime - Robberies per 100,000 population (5 year average)
Crime - Assaults per 100,000 population (5 year average)
Crime - Burglaries per 100,000 population (5 year average)
Crime - Thefts per 100,000 population (5 year average)
Crime - Auto thefts per 100,000 population (5 year average)
Crime - Arson per 100,000 population (5 year average)
Crime - City-data.com crime index (5 year average)
Crime - Violent crime index (5 year average)
Crime - Property crime index (5 year average)
1996 Presidential Elections Results (%) - Democratic Party (Clinton)
1996 Presidential Elections Results (%) - Republican Party (Dole)
1996 Presidential Elections Results (%) - Other
2000 Presidential Elections Results (%) - Democratic Party (Gore)
2000 Presidential Elections Results (%) - Republican Party (Bush)
2000 Presidential Elections Results (%) - Other
2004 Presidential Elections Results (%) - Democratic Party (Kerry)
2004 Presidential Elections Results (%) - Republican Party (Bush)
2004 Presidential Elections Results (%) - Other
2008 Presidential Elections Results (%) - Democratic Party (Obama)
2008 Presidential Elections Results (%) - Republican Party (McCain)
2008 Presidential Elections Results (%) - Other
2012 Presidential Elections Results (%) - Democratic Party (Obama)
2012 Presidential Elections Results (%) - Republican Party (Romney)
2012 Presidential Elections Results (%) - Other
2016 Presidential Elections Results (%) - Democratic Party (Clinton)
2016 Presidential Elections Results (%) - Republican Party (Trump)
2016 Presidential Elections Results (%) - Other
2020 Presidential Elections Results (%) - Democratic Party (Biden)
2020 Presidential Elections Results (%) - Republican Party (Trump)
2020 Presidential Elections Results (%) - Other
Ancestries Reported - Arab (%)
Ancestries Reported - Czech (%)
Ancestries Reported - Danish (%)
Ancestries Reported - Dutch (%)
Ancestries Reported - English (%)
Ancestries Reported - French (%)
Ancestries Reported - French Canadian (%)
Ancestries Reported - German (%)
Ancestries Reported - Greek (%)
Ancestries Reported - Hungarian (%)
Ancestries Reported - Irish (%)
Ancestries Reported - Italian (%)
Ancestries Reported - Lithuanian (%)
Ancestries Reported - Norwegian (%)
Ancestries Reported - Polish (%)
Ancestries Reported - Portuguese (%)
Ancestries Reported - Russian (%)
Ancestries Reported - Scotch-Irish (%)
Ancestries Reported - Scottish (%)
Ancestries Reported - Slovak (%)
Ancestries Reported - Subsaharan African (%)
Ancestries Reported - Swedish (%)
Ancestries Reported - Swiss (%)
Ancestries Reported - Ukrainian (%)
Ancestries Reported - United States (%)
Ancestries Reported - Welsh (%)
Ancestries Reported - West Indian (%)
Ancestries Reported - Other (%)
Educational Attainment - No schooling completed (%)
Educational Attainment - Less than high school (%)
Educational Attainment - High school or equivalent (%)
Educational Attainment - Less than 1 year of college (%)
Educational Attainment - 1 or more years of college (%)
Educational Attainment - Associate degree (%)
Educational Attainment - Bachelor's degree (%)
Educational Attainment - Master's degree (%)
Educational Attainment - Professional school degree (%)
Educational Attainment - Doctorate degree (%)
School Enrollment - Nursery, preschool (%)
School Enrollment - Kindergarten (%)
School Enrollment - Grade 1 to 4 (%)
School Enrollment - Grade 5 to 8 (%)
School Enrollment - Grade 9 to 12 (%)
School Enrollment - College undergrad (%)
School Enrollment - Graduate or professional (%)
School Enrollment - Not enrolled in school (%)
School enrollment - Public schools (%)
School enrollment - Private schools (%)
School enrollment - Not enrolled (%)
Median number of rooms in houses and condos
Median number of rooms in apartments
Housing units lacking complete plumbing facilities (%)
Housing units lacking complete kitchen facilities (%)
Density of houses
Urban houses (%)
Rural houses (%)
Households with people 60 years and over (%)
Households with people 65 years and over (%)
Households with people 75 years and over (%)
Households with one or more nonrelatives (%)
Households with no nonrelatives (%)
Population in households (%)
Family households (%)
Nonfamily households (%)
Population in families (%)
Family households with own children (%)
Median number of bedrooms in owner occupied houses
Mean number of bedrooms in owner occupied houses
Median number of bedrooms in renter occupied houses
Mean number of bedrooms in renter occupied houses
Median number of vehichles in owner occupied houses
Mean number of vehichles in owner occupied houses
Median number of vehichles in renter occupied houses
Mean number of vehichles in renter occupied houses
Mortgage status - with mortgage (%)
Mortgage status - with second mortgage (%)
Mortgage status - with home equity loan (%)
Mortgage status - with both second mortgage and home equity loan (%)
Mortgage status - without a mortgage (%)
Average family size
Average family size - White
Average family size - Black or African American
Average family size - Asian
Average family size - Hispanic or Latino
Average family size - American Indian and Alaska Native
Average family size - Multirace
Average family size - Other Race
Geographical mobility - Same house 1 year ago (%)
Geographical mobility - Moved within same county (%)
Geographical mobility - Moved from different county within same state (%)
Geographical mobility - Moved from different state (%)
Geographical mobility - Moved from abroad (%)
Place of birth - Born in state of residence (%)
Place of birth - Born in other state (%)
Place of birth - Native, outside of US (%)
Place of birth - Foreign born (%)
Housing units in structures - 1, detached (%)
Housing units in structures - 1, attached (%)
Housing units in structures - 2 (%)
Housing units in structures - 3 or 4 (%)
Housing units in structures - 5 to 9 (%)
Housing units in structures - 10 to 19 (%)
Housing units in structures - 20 to 49 (%)
Housing units in structures - 50 or more (%)
Housing units in structures - Mobile home (%)
Housing units in structures - Boat, RV, van, etc. (%)
House/condo owner moved in on average (years ago)
Renter moved in on average (years ago)
Year householder moved into unit - Moved in 1999 to March 2000 (%)
Year householder moved into unit - Moved in 1995 to 1998 (%)
Year householder moved into unit - Moved in 1990 to 1994 (%)
Year householder moved into unit - Moved in 1980 to 1989 (%)
Year householder moved into unit - Moved in 1970 to 1979 (%)
Year householder moved into unit - Moved in 1969 or earlier (%)
Means of transportation to work - Drove car alone (%)
Means of transportation to work - Carpooled (%)
Means of transportation to work - Public transportation (%)
Means of transportation to work - Bus or trolley bus (%)
Means of transportation to work - Streetcar or trolley car (%)
Means of transportation to work - Subway or elevated (%)
Means of transportation to work - Railroad (%)
Means of transportation to work - Ferryboat (%)
Means of transportation to work - Taxicab (%)
Means of transportation to work - Motorcycle (%)
Means of transportation to work - Bicycle (%)
Means of transportation to work - Walked (%)
Means of transportation to work - Other means (%)
Working at home (%)
Industry diversity
Most Common Industries - Agriculture, forestry, fishing and hunting, and mining (%)
Most Common Industries - Agriculture, forestry, fishing and hunting (%)
Most Common Industries - Mining, quarrying, and oil and gas extraction (%)
Most Common Industries - Construction (%)
Most Common Industries - Manufacturing (%)
Most Common Industries - Wholesale trade (%)
Most Common Industries - Retail trade (%)
Most Common Industries - Transportation and warehousing, and utilities (%)
Most Common Industries - Transportation and warehousing (%)
Most Common Industries - Utilities (%)
Most Common Industries - Information (%)
Most Common Industries - Finance and insurance, and real estate and rental and leasing (%)
Most Common Industries - Finance and insurance (%)
Most Common Industries - Real estate and rental and leasing (%)
Most Common Industries - Professional, scientific, and management, and administrative and waste management services (%)
Most Common Industries - Professional, scientific, and technical services (%)
Most Common Industries - Management of companies and enterprises (%)
Most Common Industries - Administrative and support and waste management services (%)
Most Common Industries - Educational services, and health care and social assistance (%)
Most Common Industries - Educational services (%)
Most Common Industries - Health care and social assistance (%)
Most Common Industries - Arts, entertainment, and recreation, and accommodation and food services (%)
Most Common Industries - Arts, entertainment, and recreation (%)
Most Common Industries - Accommodation and food services (%)
Most Common Industries - Other services, except public administration (%)
Most Common Industries - Public administration (%)
Occupation diversity
Most Common Occupations - Management, business, science, and arts occupations (%)
Most Common Occupations - Management, business, and financial occupations (%)
Most Common Occupations - Management occupations (%)
Most Common Occupations - Business and financial operations occupations (%)
Most Common Occupations - Computer, engineering, and science occupations (%)
Most Common Occupations - Computer and mathematical occupations (%)
Most Common Occupations - Architecture and engineering occupations (%)
Most Common Occupations - Life, physical, and social science occupations (%)
Most Common Occupations - Education, legal, community service, arts, and media occupations (%)
Most Common Occupations - Community and social service occupations (%)
Most Common Occupations - Legal occupations (%)
Most Common Occupations - Education, training, and library occupations (%)
Most Common Occupations - Arts, design, entertainment, sports, and media occupations (%)
Most Common Occupations - Healthcare practitioners and technical occupations (%)
Most Common Occupations - Health diagnosing and treating practitioners and other technical occupations (%)
Most Common Occupations - Health technologists and technicians (%)
Most Common Occupations - Service occupations (%)
Most Common Occupations - Healthcare support occupations (%)
Most Common Occupations - Protective service occupations (%)
Most Common Occupations - Fire fighting and prevention, and other protective service workers including supervisors (%)
Most Common Occupations - Law enforcement workers including supervisors (%)
Most Common Occupations - Food preparation and serving related occupations (%)
Most Common Occupations - Building and grounds cleaning and maintenance occupations (%)
Most Common Occupations - Personal care and service occupations (%)
Most Common Occupations - Sales and office occupations (%)
Most Common Occupations - Sales and related occupations (%)
Most Common Occupations - Office and administrative support occupations (%)
Most Common Occupations - Natural resources, construction, and maintenance occupations (%)
Most Common Occupations - Farming, fishing, and forestry occupations (%)
Most Common Occupations - Construction and extraction occupations (%)
Most Common Occupations - Installation, maintenance, and repair occupations (%)
Most Common Occupations - Production, transportation, and material moving occupations (%)
Most Common Occupations - Production occupations (%)
Most Common Occupations - Transportation occupations (%)
Most Common Occupations - Material moving occupations (%)
People in Group quarters - Institutionalized population (%)
People in Group quarters - Correctional institutions (%)
People in Group quarters - Federal prisons and detention centers (%)
People in Group quarters - Halfway houses (%)
People in Group quarters - Local jails and other confinement facilities (including police lockups) (%)
People in Group quarters - Military disciplinary barracks (%)
People in Group quarters - State prisons (%)
People in Group quarters - Other types of correctional institutions (%)
People in Group quarters - Nursing homes (%)
People in Group quarters - Hospitals/wards, hospices, and schools for the handicapped (%)
People in Group quarters - Hospitals/wards and hospices for chronically ill (%)
People in Group quarters - Hospices or homes for chronically ill (%)
People in Group quarters - Military hospitals or wards for chronically ill (%)
People in Group quarters - Other hospitals or wards for chronically ill (%)
People in Group quarters - Hospitals or wards for drug/alcohol abuse (%)
People in Group quarters - Mental (Psychiatric) hospitals or wards (%)
People in Group quarters - Schools, hospitals, or wards for the mentally retarded (%)
People in Group quarters - Schools, hospitals, or wards for the physically handicapped (%)
People in Group quarters - Institutions for the deaf (%)
People in Group quarters - Institutions for the blind (%)
People in Group quarters - Orthopedic wards and institutions for the physically handicapped (%)
People in Group quarters - Wards in general hospitals for patients who have no usual home elsewhere (%)
People in Group quarters - Wards in military hospitals for patients who have no usual home elsewhere (%)
People in Group quarters - Juvenile institutions (%)
People in Group quarters - Long-term care (%)
People in Group quarters - Homes for abused, dependent, and neglected children (%)
People in Group quarters - Residential treatment centers for emotionally disturbed children (%)
People in Group quarters - Training schools for juvenile delinquents (%)
People in Group quarters - Short-term care, detention or diagnostic centers for delinquent children (%)
People in Group quarters - Type of juvenile institution unknown (%)
People in Group quarters - Noninstitutionalized population (%)
People in Group quarters - College dormitories (includes college quarters off campus) (%)
People in Group quarters - Military quarters (%)
People in Group quarters - On base (%)
People in Group quarters - Barracks, unaccompanied personnel housing (UPH), (Enlisted/Officer), ;and similar group living quarters for military personnel (%)
People in Group quarters - Transient quarters for temporary residents (%)
People in Group quarters - Military ships (%)
People in Group quarters - Group homes (%)
People in Group quarters - Homes or halfway houses for drug/alcohol abuse (%)
People in Group quarters - Homes for the mentally ill (%)
People in Group quarters - Homes for the mentally retarded (%)
People in Group quarters - Homes for the physically handicapped (%)
People in Group quarters - Other group homes (%)
People in Group quarters - Religious group quarters (%)
People in Group quarters - Dormitories (%)
People in Group quarters - Agriculture workers' dormitories on farms (%)
People in Group quarters - Job Corps and vocational training facilities (%)
People in Group quarters - Other workers' dormitories (%)
People in Group quarters - Crews of maritime vessels (%)
People in Group quarters - Other nonhousehold living situations (%)
People in Group quarters - Other noninstitutional group quarters (%)
Residents speaking English at home (%)
Residents speaking English at home - Born in the United States (%)
Residents speaking English at home - Native, born elsewhere (%)
Residents speaking English at home - Foreign born (%)
Residents speaking Spanish at home (%)
Residents speaking Spanish at home - Born in the United States (%)
Residents speaking Spanish at home - Native, born elsewhere (%)
Residents speaking Spanish at home - Foreign born (%)
Residents speaking other language at home (%)
Residents speaking other language at home - Born in the United States (%)
Residents speaking other language at home - Native, born elsewhere (%)
Residents speaking other language at home - Foreign born (%)
Class of Workers - Employee of private company (%)
Class of Workers - Self-employed in own incorporated business (%)
Class of Workers - Private not-for-profit wage and salary workers (%)
Class of Workers - Local government workers (%)
Class of Workers - State government workers (%)
Class of Workers - Federal government workers (%)
Class of Workers - Self-employed workers in own not incorporated business and Unpaid family workers (%)
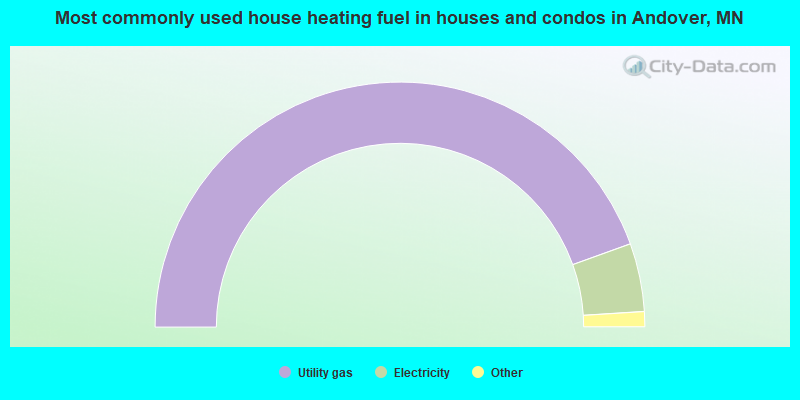
House heating fuel used in houses and condos - Utility gas (%)
House heating fuel used in houses and condos - Bottled, tank, or LP gas (%)
House heating fuel used in houses and condos - Electricity (%)
House heating fuel used in houses and condos - Fuel oil, kerosene, etc. (%)
House heating fuel used in houses and condos - Coal or coke (%)
House heating fuel used in houses and condos - Wood (%)
House heating fuel used in houses and condos - Solar energy (%)
House heating fuel used in houses and condos - Other fuel (%)
House heating fuel used in houses and condos - No fuel used (%)
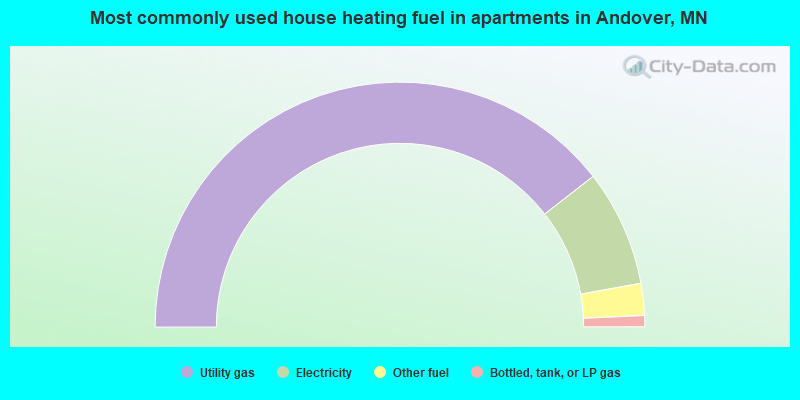
House heating fuel used in apartments - Utility gas (%)
House heating fuel used in apartments - Bottled, tank, or LP gas (%)
House heating fuel used in apartments - Electricity (%)
House heating fuel used in apartments - Fuel oil, kerosene, etc. (%)
House heating fuel used in apartments - Coal or coke (%)
House heating fuel used in apartments - Wood (%)
House heating fuel used in apartments - Solar energy (%)
House heating fuel used in apartments - Other fuel (%)
House heating fuel used in apartments - No fuel used (%)
Armed forces status - In Armed Forces (%)
Armed forces status - Civilian (%)
Armed forces status - Civilian - Veteran (%)
Armed forces status - Civilian - Nonveteran (%)
Fatal accidents locations in years 2005-2021
Fatal accidents locations in 2005
Fatal accidents locations in 2006
Fatal accidents locations in 2007
Fatal accidents locations in 2008
Fatal accidents locations in 2009
Fatal accidents locations in 2010
Fatal accidents locations in 2011
Fatal accidents locations in 2012
Fatal accidents locations in 2013
Fatal accidents locations in 2014
Fatal accidents locations in 2015
Fatal accidents locations in 2016
Fatal accidents locations in 2017
Fatal accidents locations in 2018
Fatal accidents locations in 2019
Fatal accidents locations in 2020
Fatal accidents locations in 2021
Alcohol use - People drinking some alcohol every month (%)
Alcohol use - People not drinking at all (%)
Alcohol use - Average days/month drinking alcohol
Alcohol use - Average drinks/week
Alcohol use - Average days/year people drink much
Audiometry - Average condition of hearing (%)
Audiometry - People that can hear a whisper from across a quiet room (%)
Audiometry - People that can hear normal voice from across a quiet room (%)
Audiometry - Ears ringing, roaring, buzzing (%)
Audiometry - Had a job exposure to loud noise (%)
Audiometry - Had off-work exposure to loud noise (%)
Blood Pressure & Cholesterol - Has high blood pressure (%)
Blood Pressure & Cholesterol - Checking blood pressure at home (%)
Blood Pressure & Cholesterol - Frequently checking blood cholesterol (%)
Blood Pressure & Cholesterol - Has high cholesterol level (%)
Consumer Behavior - Money monthly spent on food at supermarket/grocery store
Consumer Behavior - Money monthly spent on food at other stores
Consumer Behavior - Money monthly spent on eating out
Consumer Behavior - Money monthly spent on carryout/delivered foods
Consumer Behavior - Income spent on food at supermarket/grocery store (%)
Consumer Behavior - Income spent on food at other stores (%)
Consumer Behavior - Income spent on eating out (%)
Consumer Behavior - Income spent on carryout/delivered foods (%)
Current Health Status - General health condition (%)
Current Health Status - Blood donors (%)
Current Health Status - Has blood ever tested for HIV virus (%)
Current Health Status - Left-handed people (%)
Dermatology - People using sunscreen (%)
Diabetes - Diabetics (%)
Diabetes - Had a blood test for high blood sugar (%)
Diabetes - People taking insulin (%)
Diet Behavior & Nutrition - Diet health (%)
Diet Behavior & Nutrition - Milk product consumption (# of products/month)
Diet Behavior & Nutrition - Meals not home prepared (#/week)
Diet Behavior & Nutrition - Meals from fast food or pizza place (#/week)
Diet Behavior & Nutrition - Ready-to-eat foods (#/month)
Diet Behavior & Nutrition - Frozen meals/pizza (#/month)
Drug Use - People that ever used marijuana or hashish (%)
Drug Use - Ever used hard drugs (%)
Drug Use - Ever used any form of cocaine (%)
Drug Use - Ever used heroin (%)
Drug Use - Ever used methamphetamine (%)
Health Insurance - People covered by health insurance (%)
Kidney Conditions-Urology - Avg. # of times urinating at night
Medical Conditions - People with asthma (%)
Medical Conditions - People with anemia (%)
Medical Conditions - People with psoriasis (%)
Medical Conditions - People with overweight (%)
Medical Conditions - Elderly people having difficulties in thinking or remembering (%)
Medical Conditions - People who ever received blood transfusion (%)
Medical Conditions - People having trouble seeing even with glass/contacts (%)
Medical Conditions - People with arthritis (%)
Medical Conditions - People with gout (%)
Medical Conditions - People with congestive heart failure (%)
Medical Conditions - People with coronary heart disease (%)
Medical Conditions - People with angina pectoris (%)
Medical Conditions - People who ever had heart attack (%)
Medical Conditions - People who ever had stroke (%)
Medical Conditions - People with emphysema (%)
Medical Conditions - People with thyroid problem (%)
Medical Conditions - People with chronic bronchitis (%)
Medical Conditions - People with any liver condition (%)
Medical Conditions - People who ever had cancer or malignancy (%)
Mental Health - People who have little interest in doing things (%)
Mental Health - People feeling down, depressed, or hopeless (%)
Mental Health - People who have trouble sleeping or sleeping too much (%)
Mental Health - People feeling tired or having little energy (%)
Mental Health - People with poor appetite or overeating (%)
Mental Health - People feeling bad about themself (%)
Mental Health - People who have trouble concentrating on things (%)
Mental Health - People moving or speaking slowly or too fast (%)
Mental Health - People having thoughts they would be better off dead (%)
Oral Health - Average years since last visit a dentist
Oral Health - People embarrassed because of mouth (%)
Oral Health - People with gum disease (%)
Oral Health - General health of teeth and gums (%)
Oral Health - Average days a week using dental floss/device
Oral Health - Average days a week using mouthwash for dental problem
Oral Health - Average number of teeth
Pesticide Use - Households using pesticides to control insects (%)
Pesticide Use - Households using pesticides to kill weeds (%)
Physical Activity - People doing vigorous-intensity work activities (%)
Physical Activity - People doing moderate-intensity work activities (%)
Physical Activity - People walking or bicycling (%)
Physical Activity - People doing vigorous-intensity recreational activities (%)
Physical Activity - People doing moderate-intensity recreational activities (%)
Physical Activity - Average hours a day doing sedentary activities
Physical Activity - Average hours a day watching TV or videos
Physical Activity - Average hours a day using computer
Physical Functioning - People having limitations keeping them from working (%)
Physical Functioning - People limited in amount of work they can do (%)
Physical Functioning - People that need special equipment to walk (%)
Physical Functioning - People experiencing confusion/memory problems (%)
Physical Functioning - People requiring special healthcare equipment (%)
Prescription Medications - Average number of prescription medicines taking
Preventive Aspirin Use - Adults 40+ taking low-dose aspirin (%)
Reproductive Health - Vaginal deliveries (%)
Reproductive Health - Cesarean deliveries (%)
Reproductive Health - Deliveries resulted in a live birth (%)
Reproductive Health - Pregnancies resulted in a delivery (%)
Reproductive Health - Women breastfeeding newborns (%)
Reproductive Health - Women that had a hysterectomy (%)
Reproductive Health - Women that had both ovaries removed (%)
Reproductive Health - Women that have ever taken birth control pills (%)
Reproductive Health - Women taking birth control pills (%)
Reproductive Health - Women that have ever used Depo-Provera or injectables (%)
Reproductive Health - Women that have ever used female hormones (%)
Sexual Behavior - People 18+ that ever had sex (vaginal, anal, or oral) (%)
Sexual Behavior - Males 18+ that ever had vaginal sex with a woman (%)
Sexual Behavior - Males 18+ that ever performed oral sex on a woman (%)
Sexual Behavior - Males 18+ that ever had anal sex with a woman (%)
Sexual Behavior - Males 18+ that ever had any sex with a man (%)
Sexual Behavior - Females 18+ that ever had vaginal sex with a man (%)
Sexual Behavior - Females 18+ that ever performed oral sex on a man (%)
Sexual Behavior - Females 18+ that ever had anal sex with a man (%)
Sexual Behavior - Females 18+ that ever had any kind of sex with a woman (%)
Sexual Behavior - Average age people first had sex
Sexual Behavior - Average number of female sex partners in lifetime (males 18+)
Sexual Behavior - Average number of female vaginal sex partners in lifetime (males 18+)
Sexual Behavior - Average age people first performed oral sex on a woman (18+)
Sexual Behavior - Average number of woman performed oral sex on in lifetime (18+)
Sexual Behavior - Average number of male sex partners in lifetime (males 18+)
Sexual Behavior - Average number of male anal sex partners in lifetime (males 18+)
Sexual Behavior - Average age people first performed oral sex on a man (18+)
Sexual Behavior - Average number of male oral sex partners in lifetime (18+)
Sexual Behavior - People using protection when performing oral sex (%)
Sexual Behavior - Average number of times people have vaginal or anal sex a year
Sexual Behavior - People having sex without condom (%)
Sexual Behavior - Average number of male sex partners in lifetime (females 18+)
Sexual Behavior - Average number of male vaginal sex partners in lifetime (females 18+)
Sexual Behavior - Average number of female sex partners in lifetime (females 18+)
Sexual Behavior - Circumcised males 18+ (%)
Sleep Disorders - Average hours sleeping at night
Sleep Disorders - People that has trouble sleeping (%)
Smoking-Cigarette Use - People smoking cigarettes (%)
Taste & Smell - People 40+ having problems with smell (%)
Taste & Smell - People 40+ having problems with taste (%)
Taste & Smell - People 40+ that ever had wisdom teeth removed (%)
Taste & Smell - People 40+ that ever had tonsils teeth removed (%)
Taste & Smell - People 40+ that ever had a loss of consciousness because of a head injury (%)
Taste & Smell - People 40+ that ever had a broken nose or other serious injury to face or skull (%)
Taste & Smell - People 40+ that ever had two or more sinus infections (%)
Weight - Average height (inches)
Weight - Average weight (pounds)
Weight - Average BMI
Weight - People that are obese (%)
Weight - People that ever were obese (%)
Weight - People trying to lose weight (%)
According to our research of Minnesota and other state lists, there was 1 registered sex offender living in Andover, Minnesota as of April 27, 2024 . The ratio of all residents to sex offenders in Andover is 32,346 to 1.The ratio of registered sex offenders to all residents in this city is much lower than the state average.
Latest news from Andover, MN collected exclusively by city-data.com from local newspapers, TV, and radio stations
Ancestries: German (20.3%), American (16.0%), Norwegian (11.3%), European (4.9%), Irish (4.6%), Polish (4.2%).
Current Local Time:
Land area: 34.1 square miles.
Population density: 965 people per square mile (low).
1,854 residents are foreign born (2.2% Asia , 2.0% Africa , 0.7% Latin America ).
This city:
5.6%Minnesota:
8.5%
Median real estate property taxes paid for housing units with mortgages in 2022: $3,457 (0.8%)Median real estate property taxes paid for housing units with no mortgage in 2022: $3,294 (0.9%)
Nearest city with pop. 50,000+: Coon Rapids, MN
Nearest city with pop. 200,000+: Minneapolis, MN
Nearest city with pop. 1,000,000+: Chicago, IL
Nearest cities:
Latitude: 45.26 N, Longitude: 93.33 W
Daytime population change due to commuting: -9,874 (-29.9%)Workers who live and work in this city: 4,993 (28.5%)
Single-family new house construction building permits:
2022: 103 buildings , average cost: $333,3002021: 140 buildings , average cost: $313,9002020: 138 buildings , average cost: $324,3002019: 116 buildings , average cost: $321,2002018: 60 buildings , average cost: $328,4002017: 94 buildings , average cost: $296,3002016: 103 buildings , average cost: $271,4002015: 74 buildings , average cost: $291,6002014: 52 buildings , average cost: $284,9002013: 98 buildings , average cost: $214,6002012: 80 buildings , average cost: $188,4002011: 58 buildings , average cost: $203,5002010: 71 buildings , average cost: $207,1002009: 47 buildings , average cost: $196,7002008: 129 buildings , average cost: $86,2002007: 91 buildings , average cost: $201,6002006: 151 buildings , average cost: $164,5002005: 226 buildings , average cost: $151,2002004: 251 buildings , average cost: $144,3002003: 179 buildings , average cost: $161,9002002: 218 buildings , average cost: $146,1002001: 285 buildings , average cost: $152,2002000: 342 buildings , average cost: $135,2001999: 411 buildings , average cost: $115,2001998: 448 buildings , average cost: $119,9001997: 282 buildings , average cost: $109,400Unemployment in December 2023:
Population change in the 1990s: +11,305 (+74.0%).
Most common occupations in Andover, MN (%)
Both Males Females
Other management occupations, except farmers and farm managers (5.0%)
Other sales and related occupations, including supervisors (4.4%)
Other office and administrative support workers, including supervisors (3.4%)
Computer specialists (3.2%)
Metal workers and plastic workers (3.2%)
Sales representatives, services, wholesale and manufacturing (3.1%)
Retail sales workers, except cashiers (3.1%)
Other management occupations, except farmers and farm managers (6.1%)
Metal workers and plastic workers (5.4%)
Other sales and related occupations, including supervisors (5.2%)
Electrical equipment mechanics and other installation, maintenance, and repair workers, including supervisors (4.6%)
Sales representatives, services, wholesale and manufacturing (4.6%)
Other production occupations, including supervisors (3.9%)
Computer specialists (3.9%)
Information and record clerks, except customer service representatives (6.1%)
Other office and administrative support workers, including supervisors (5.7%)
Secretaries and administrative assistants (5.0%)
Registered nurses (4.0%)
Health technologists and technicians (4.0%)
Other management occupations, except farmers and farm managers (3.8%)
Customer service representatives (3.8%)
Tornado activity:
Andover-area historical tornado activity is slightly above Minnesota state average. It is 19% greater than the overall U.S. average.
On 7/3/1983, a category F4 (max. wind speeds 207-260 mph) tornado 2.7 miles away from the Andover city center injured 4 people and caused between $5000 and $50,000 in damages.
On 6/19/1951, a category F4 tornado 2.7 miles away from the city center killed one person and injured 20 people and caused between $500,000 and $5,000,000 in damages.
Earthquake activity:
Andover-area historical earthquake activity is significantly above Minnesota state average. It is 55% smaller than the overall U.S. average. On 7/9/1975 at 14:54:15, a magnitude 4.6 (4.6 MB, Class: Light, Intensity: IV - V) earthquake occurred 134.5 miles away from the city center On 6/5/1993 at 01:24:53, a magnitude 4.1 (4.1 LG, Depth: 6.2 mi) earthquake occurred 146.5 miles away from Andover center On 3/4/1983 at 06:32:18, a magnitude 4.6 (4.4 MB, 4.6 LG, 4.4 ML) earthquake occurred 307.1 miles away from the city center On 10/20/1995 at 15:57:18, a magnitude 3.7 (3.7 LG, Depth: 3.1 mi, Class: Light, Intensity: II - III) earthquake occurred 175.1 miles away from the city center On 2/9/1994 at 08:45:35, a magnitude 3.1 (3.1 LG, Depth: 3.1 mi) earthquake occurred 83.4 miles away from Andover center On 11/3/2002 at 20:41:56, a magnitude 4.3 (4.3 MB, Depth: 3.1 mi) earthquake occurred 325.9 miles away from the city center Magnitude types: regional Lg-wave magnitude (LG), body-wave magnitude (MB), local magnitude (ML) Natural disasters: The number of natural disasters in Anoka County (12) is smaller than the US average (15).Major Disasters (Presidential) Declared: 8Emergencies Declared: 2Floods: 6, Storms: 4, Tornadoes: 3, Drought: 1, Fire: 1, Hurricane: 1, Wind: 1, Other: 1 (Note: some incidents may be assigned to more than one category). Hospitals and medical centers near Andover: FMC - COON RAPIDS (Dialysis Facility, about 5 miles away; COON RAPIDS, MN)
ANOKA CARE CENTER (Nursing Home, about 5 miles away; ANOKA, MN)
ANOKA MAPLE MANOR CARE CTR (Nursing Home, about 5 miles away; ANOKA, MN)
GOLDEN LIVINGCENTER - TWIN RIVERS (Nursing Home, about 6 miles away; ANOKA, MN)
TWIN RIVERS CARE CENTER (Nursing Home, about 6 miles away; ANOKA, MN)
MARY T HOME HEALTH (Home Health Center, about 6 miles away; COON RAPIDS, MN)
CAMILIA ROSE GROUP HOME (Hospital, about 6 miles away; COON RAPIDS, MN)
Colleges/universities with over 2000 students nearest to Andover:
Anoka-Ramsey Community College (about 6 miles; Coon Rapids, MN ; Full-time enrollment: 5,918)
North Hennepin Community College (about 11 miles; Brooklyn Park, MN ; FT enrollment: 4,943)
Hennepin Technical College (about 12 miles; Brooklyn Park, MN ; FT enrollment: 4,515)
Bethel University (about 17 miles; Saint Paul, MN ; FT enrollment: 4,061)
University of Northwestern-St Paul (about 18 miles; Saint Paul, MN ; FT enrollment: 2,680)
Walden University (about 20 miles; Minneapolis, MN ; FT enrollment: 62,473)
Capella University (about 20 miles; Minneapolis, MN ; FT enrollment: 21,718)
Public high schools in Andover: BRIDGES Location: 13735 ROUND LAKE BLVD NW, Grades: 12)ANDOVER HIGH SCHOOL Location: 2115 ANDOVER BLVD NW, Grades: 9-12)
Private high school in Andover: LEGACY CHRISTIAN ACADEMY Students: 496, Location: 3037 BUNKER LAKE BLVD NW, Grades: PK-12)
Public elementary/middle schools in Andover:
See full list of schools located in Andover Birthplace of: Clarence Munn - Football player and coach.
Anoka County has a predicted average indoor radon screening level between 2 and 4 pCi/L (pico curies per liter) - Moderate Potential Drinking water stations with addresses in Andover and their reported violations in the past:
ANDOVER (Address: 1685 Crosstown Boulevard NW Population served: 19,903, Groundwater):
Past health violations:
MCL, Average - Between JUL-17-2006 and FEB-28-2008, Contaminant: Gross Alpha, Excl. Radon and U. Follow-up actions: St Public Notif requested (SEP-28-2006), St Compliance Meeting conducted (SEP-28-2006), St Formal NOV issued (SEP-28-2006), St Public Notif received (NOV-01-2006), St BCA signed (NOV-01-2006), St Compliance achieved (FEB-28-2008), St BCA signed (FEB-28-2008)
MCL, Average - Between JUL-17-2006 and FEB-28-2008, Contaminant: Combined Radium (-226 and -228). Follow-up actions: St Public Notif requested (SEP-28-2006), St Compliance Meeting conducted (SEP-28-2006), St Formal NOV issued (SEP-28-2006), St Public Notif received (NOV-01-2006), St BCA signed (NOV-01-2006), St Compliance achieved (FEB-28-2008), St BCA signed (FEB-28-2008)
Average household size: This city:
3.1 peopleMinnesota:
2.5 people
Percentage of family households: This city:
85.2%Whole state:
64.6%
Percentage of households with unmarried partners: This city:
5.0%Whole state:
6.9%
Likely homosexual households (counted as self-reported same-sex unmarried-partner households)
Lesbian couples: 0.3% of all households Gay men: 0.1% of all households
39 people in group homes intended for adults in 2010people in homes for the mentally retarded in 2000
Banks with branches in Andover (2011 data):
Wells Fargo Bank, National Association: Andover Branch at 1966 Bunker Lake Blvd Nw Ste, branch established on 2007/07/09. Info updated 2011/04/05: Bank assets: $1,161,490.0 mil, Deposits: $905,653.0 mil, headquarters in Sioux Falls, SD, positive income , 6395 total offices , Holding Company: Wells Fargo & Company
U.S. Bank National Association: Andover Branch at 3445 Bunker Lake Boulevard, branch established on 1987/01/05. Info updated 2012/01/30: Bank assets: $330,470.8 mil, Deposits: $236,091.5 mil, headquarters in Cincinnati, OH, positive income , 3121 total offices , Holding Company: U.S. Bancorp
1st Regents Bank: at 1777 Bunker Lake Boulevard Nw, branch established on 2001/05/22. Info updated 2010/12/14: Bank assets: $62.8 mil, Deposits: $57.8 mil, local headquarters , negative income in the last year , Commercial Lending Specialization, 1 total offices , Holding Company: Alliance Bank Shares Corporation
For population 15 years and over in Andover:
Never married: 26.4%Now married: 62.7%Separated: 0.6%Widowed: 3.4%Divorced: 6.9% For population 25 years and over in Andover:
High school or higher: 95.4%Bachelor's degree or higher: 36.5%Graduate or professional degree: 10.8%Unemployed: 2.1%Mean travel time to work (commute): 21.4 minutes
Education Gini index (Inequality in education) Here:
10.3Minnesota average:
10.9
Religion statistics for Andover, MN (based on Anoka County data)
Religion Adherents Congregations Catholic 75,535 12 Evangelical Protestant 49,709 109 Mainline Protestant 36,549 33 Other 2,179 12 Orthodox 195 3 None 166,677 -
Source: Clifford Grammich, Kirk Hadaway, Richard Houseal, Dale E.Jones, Alexei Krindatch, Richie Stanley and Richard H.Taylor. 2012. 2010 U.S.Religion Census: Religious Congregations & Membership Study. Association of Statisticians of American Religious Bodies. Jones, Dale E., et al. 2002. Congregations and Membership in the United States 2000. Nashville, TN: Glenmary Research Center. Graphs represent county-level data
Food Environment Statistics: Number of grocery stores : 32Anoka County :
0.98 / 10,000 pop.Minnesota :
1.83 / 10,000 pop.
Number of supercenters and club stores : 3This county :
0.09 / 10,000 pop.State :
0.13 / 10,000 pop.
Number of convenience stores (no gas) : 14Anoka County :
0.43 / 10,000 pop.Minnesota :
0.49 / 10,000 pop.
Number of convenience stores (with gas) : 109Anoka County :
3.35 / 10,000 pop.State :
3.90 / 10,000 pop.
Number of full-service restaurants : 125Here :
3.84 / 10,000 pop.State :
6.98 / 10,000 pop.
Adult diabetes rate : This county :
6.8%Minnesota :
6.5%
Adult obesity rate : Anoka County :
27.7%Minnesota :
25.9%
Low-income preschool obesity rate : This county :
12.6%State :
13.0%
Health and Nutrition:
Average overall health of teeth and gums : This city:
49.5%State:
48.4%
People feeling badly about themselves : Andover:
23.1%Minnesota:
21.0%
People not drinking alcohol at all : This city:
7.9%Minnesota:
9.8%
Average hours sleeping at night : This city:
6.8Minnesota:
6.8
Overweight people : Andover:
34.9%Minnesota:
33.5%
General health condition : This city:
59.1%Minnesota:
57.7%
Average condition of hearing : This city:
81.5%State:
79.3%
More about Health and Nutrition of Andover, MN Residents
Local government employment and payroll (March 2022)
Function
Full-time employees
Monthly full-time payroll
Average yearly full-time wage
Part-time employees
Monthly part-time payroll
Streets and Highways
15 $93,939 $75,151 0 $0 Parks and Recreation
13 $35,836 $33,079 22 $22,107 Other and Unallocable
8 $49,961 $74,942 0 $0 Other Government Administration
5 $21,326 $51,182 5 $4,429 Housing and Community Development (Local)
4 $23,509 $70,527 0 $0 Water Supply
4 $23,509 $70,527 0 $0 Financial Administration
4 $25,754 $77,262 0 $0 Firefighters
4 $28,241 $84,723 49 $37,997 Sewerage
3 $14,557 $58,228 0 $0 Natural Resources
1 $5,463 $65,556 0 $0 Solid Waste Management
1 $7,230 $86,760 1 $2,843
Totals for Government
62 $329,324 $63,740 77 $67,376
Andover government finances - Expenditure in 2021 (per resident):
Construction - Regular Highways: $2,794,000 ($84.85)
Sewerage: $20,000 ($0.61)Water Utilities: $17,000 ($0.52)Current Operations - Parks and Recreation: $2,515,000 ($76.38)
Housing and Community Development: $2,422,000 ($73.55)General - Other: $2,304,000 ($69.97)Regular Highways: $2,260,000 ($68.63)Water Utilities: $1,764,000 ($53.57)Local Fire Protection: $1,578,000 ($47.92)Central Staff Services: $1,033,000 ($31.37)Sewerage: $900,000 ($27.33)Financial Administration: $637,000 ($19.35)General Public Buildings: $591,000 ($17.95)Protective Inspection and Regulation - Other: $519,000 ($15.76)Solid Waste Management: $228,000 ($6.92)Judicial and Legal Services: $196,000 ($5.95)Natural Resources - Other: $46,000 ($1.40)Health - Other: $2,000 ($0.06)General - Interest on Debt: $1,296,000 ($39.36)
Intergovernmental to Local - Other - Police Protection: $3,115,000 ($94.60)
Other - Sewerage: $1,275,000 ($38.72)Other Capital Outlay - Parks and Recreation: $12,514,000 ($380.04)
General Public Building: $3,504,000 ($106.41)Regular Highways: $283,000 ($8.59)General - Other: $162,000 ($4.92)Local Fire Protection: $131,000 ($3.98)Housing and Community Development: $30,000 ($0.91)Protective Inspection and Regulation - Other: $26,000 ($0.79)Financial Administration: $22,000 ($0.67)Total Salaries and Wages: $5,383,000 ($163.48)
Water Utilities - Interest on Debt: $42,000 ($1.28)
Andover government finances - Revenue in 2021 (per resident):
Charges - Sewerage: $3,213,000 ($97.58)
Other: $1,110,000 ($33.71)Parks and Recreation: $1,020,000 ($30.98)Solid Waste Management: $49,000 ($1.49)Federal Intergovernmental - Other: $2,466,000 ($74.89)
Local Intergovernmental - Other: $263,000 ($7.99)
Miscellaneous - Interest Earnings: $1,087,000 ($33.01)
Rents: $873,000 ($26.51)Special Assessments: $632,000 ($19.19)Donations From Private Sources: $309,000 ($9.38)General Revenue - Other: $231,000 ($7.02)Fines and Forfeits: $48,000 ($1.46)Sale of Property: $3,000 ($0.09)Revenue - Water Utilities: $4,223,000 ($128.25)
State Intergovernmental - Highways: $3,057,000 ($92.84)
Other: $426,000 ($12.94)Tax - Property: $14,553,000 ($441.96)
Other License: $859,000 ($26.09)Occupation and Business License - Other: $23,000 ($0.70)Alcoholic Beverage License: $10,000 ($0.30)
Andover government finances - Debt in 2021 (per resident):
Long Term Debt - Beginning Outstanding - Unspecified Public Purpose: $43,730,000 ($1328.05)
Outstanding Unspecified Public Purpose: $42,670,000 ($1295.86)Retired Unspecified Public Purpose: $2,370,000 ($71.98)Issue, Unspecified Public Purpose: $1,310,000 ($39.78)
Andover government finances - Cash and Securities in 2021 (per resident):
Bond Funds - Cash and Securities: $2,483,000 ($75.41)
Other Funds - Cash and Securities: $49,386,000 ($1499.82)
Sinking Funds - Cash and Securities: $2,021,000 ($61.38)
Businesses in Andover, MN
Name Count Name Count
Ace Hardware 1 Starbucks 1 CVS 1 Subway 1 Caribou Coffee 1 T-Mobile 1 Circle K 1 Target 1 DHL 1 UPS 2 FedEx 1 Walgreens 1 H&R Block 1 YMCA 1 McDonald's 2
Strongest AM radio stations in Andover:
WCCO (830 AM; 50 kW; MINNEAPOLIS, MN; Owner: INFINITY MEDIA CORPORATION)
KSTP (1500 AM; 50 kW; ST. PAUL, MN; Owner: KSTP-AM, LLC (DELAWARE))
KTIS (900 AM; 25 kW; MINNEAPOLIS, MN; Owner: NORTHWESTERN COLLEGE)
WCTS (1030 AM; 50 kW; MAPLEWOOD, MN; Owner: CNTL. BAPT. THEO/AL SEMI MINNEAPOLIS)
KFAN (1130 AM; 50 kW; MINNEAPOLIS, MN; Owner: AMFM RADIO LICENSES, L.L.C.)
KLBP (1470 AM; 5 kW; BROOKLYN PARK, MN; Owner: 1400, INC.)
KUOM (770 AM; daytime; 5 kW; MINNEAPOLIS, MN)
KDIZ (1440 AM; 5 kW; GOLDEN VALLEY, MN; Owner: KQRS, INC.)
WWTC (1280 AM; 5 kW; MINNEAPOLIS, MN; Owner: SCA LICENSE CORPORATION)
WDGY (630 AM; 8 kW; HUDSON, WI; Owner: 630 RADIO, INCORPORATED)
WMNN (1330 AM; 10 kW; MINNEAPOLIS, MN; Owner: MINNESOTA PUBLIC RADIO.)
WBHR (660 AM; 10 kW; SAUK RAPIDS, MN; Owner: HERBERT M. HOPPE)
WEBC (560 AM; 50 kW; DULUTH, MN)
Strongest FM radio stations in Andover:
KQQL (107.9 FM; ANOKA, MN; Owner: AMFM RADIO LICENSES, L.L.C.)
KJZI (100.3 FM; MINNEAPOLIS, MN; Owner: AMFM RADIO LICENSES, L.L.C.)
KNOW-FM (91.1 FM; MINNEAPOLIS-ST. PAUL, MN; Owner: MINNESOTA PUBLIC RADIO)
WLTE (102.9 FM; MINNEAPOLIS, MN; Owner: INFINITY MEDIA CORPORATION)
KSTP-FM (94.5 FM; ST. PAUL, MN; Owner: KSTP-FM, LLC, A DELAWARE LLC)
KTCZ-FM (97.1 FM; MINNEAPOLIS, MN; Owner: AMFM RADIO LICENSES, L.L.C.)
KEEY-FM (102.1 FM; ST. PAUL, MN; Owner: AMFM RADIO LICENSES, L.L.C.)
KTIS-FM (98.5 FM; MINNEAPOLIS, MN; Owner: NORTHWESTERN COLLEGE)
KDWB-FM (101.3 FM; RICHFIELD, MN; Owner: AMFM RADIO LICENSES, L.L.C.)
KQRS-FM (92.5 FM; GOLDEN VALLEY, MN; Owner: KQRS, Inc.)
KSJN (99.5 FM; MINNEAPOLIS, MN; Owner: MINNESOTA PUBLIC RADIO)
KXXR (93.7 FM; MINNEAPOLIS, MN; Owner: KQRS, INC.)
WFMP (107.1 FM; COON RAPIDS, MN; Owner: WFMP-FM, LLC)
K214DF (90.7 FM; GOLDEN VALLEY, MN; Owner: EDUCATIONAL MEDIA FOUNDATION)
WXPT (104.1 FM; ST. LOUIS PARK, MN; Owner: THE AUDIO HOUSE, INC.)
WLKX-FM (95.9 FM; FOREST LAKE, MN; Owner: LAKES BROADCASTING CO., INC.)
KBEM-FM (88.5 FM; MINNEAPOLIS, MN; Owner: BD. OF EDUCATION, S.S.D. NO. 1)
KFAI (90.3 FM; MINNEAPOLIS, MN; Owner: FRESH AIR, INC.)
KLCI (106.1 FM; ELK RIVER, MN; Owner: MILESTONE RADIO LLC)
WGVY (105.3 FM; CAMBRIDGE, MN; Owner: KQRS, INC.)
TV broadcast stations around Andover:
KARE (Channel 11; MINNEAPOLIS, MN; Owner: MULTIMEDIA HOLDINGS CORPORATION)
KSTP-TV (Channel 5; ST. PAUL, MN; Owner: HUBBARD BROADCASTING, INC.)
KMSP-TV (Channel 9; MINNEAPOLIS, MN; Owner: FOX TELEVISION STATIONS, INC.)
KTCA-TV (Channel 2; ST. PAUL, MN; Owner: TWIN CITIES PUBLIC TELEVISION, INC.)
WCCO-TV (Channel 4; MINNEAPOLIS, MN; Owner: CBS BROADCASTING INC.)
KSTC-TV (Channel 45; MINNEAPOLIS, MN; Owner: HUBBARD BROADCASTING, INC.)
KTCI-TV (Channel 17; ST. PAUL, MN; Owner: TWIN CITIES PUBLIC TELEVISION, INC.)
KMWB (Channel 23; MINNEAPOLIS, MN; Owner: KLGT LICENSEE, LLC)
WFTC (Channel 29; MINNEAPOLIS, MN; Owner: FOX TELEVISION STATIONS, INC.)
KPXM (Channel 41; ST. CLOUD, MN; Owner: PAXSON MINNEAPOLIS LICENSE, INC.)
K07UI (Channel 7; MINNEAPOLIS, ETC., MN; Owner: WORD OF GOD FELLOWSHIP, INC.)
K58BS (Channel 58; MINNEAPOLIS, MN; Owner: TRINITY BROADCASTING NETWORK)
K67HG (Channel 67; MINNEAPOLIS, MN; Owner: VENTANA TELEVISION, INC.)
K19ER (Channel 19; ST. PAUL, MN; Owner: CATHOLIC VIEWS BROADCASTS, INC.)
K14KH (Channel 14; MINNEAPOLIS, MN; Owner: THREE ANGELS BROADCASTING NETWORK)
W62BD (Channel 62; MINNEAPOLIS, MN; Owner: WORD OF GOD FELLOWSHIP, INC.)
WBWX-CA (Channel 13; MINNEAPOLIS, MN; Owner: THE BOX WORLDWIDE LLC)
National Bridge Inventory (NBI) Statistics 7 Number of bridges62ft / 18.8m Total length74,065 Total average daily traffic5,547 Total average daily truck traffic78,865 Total future (year 2034) average daily traffic
FCC Registered Cell Phone Towers: 1 (
See the full list of FCC Registered Cell Phone Towers in Andover )
FCC Registered Antenna Towers: 19 (
See the full list of FCC Registered Antenna Towers )
FCC Registered Broadcast Land Mobile Towers: 13 (
See the full list of FCC Registered Broadcast Land Mobile Towers in Andover, MN )
FCC Registered Microwave Towers: 6
ANOKA RADIO, 13595 Hanson Blvd (Lat: 45.218028 Lon: -93.304389), Type: Gtower, Structure height: 91.4 m, Overall height: 94.4 m, Call Sign: WQFS254, Assigned Frequencies: 6665.62 MHz, 6635.62 MHz, 6595.00 MHz, 6685.00 MHz, 6595.00 MHz, 6685.00 MHz, 6595.00 MHz, 6685.00 MHz, 6595.00 MHz, 6685.00 MHz... (+4 more), Grant Date: 06/24/2016, Expiration Date: 09/20/2026, Certifier: Morrie R Mox, Registrant: Anoka County Emergency Communications, 2100 3rd Avenue, Anoka, MN 55303, Phone: (763) 324-4756, Fax: (763) 324-4764, Email:
MSPRLB, Ne Of Int Of Round Lake (Lat: 45.263611 Lon: -93.345000), Type: Tower, Structure height: 61 m, Call Sign: WQJT452, Assigned Frequencies: 11505.0 MHz, 11605.0 MHz, 11622.5 MHz, 11627.5 MHz, Grant Date: 12/23/2008, Expiration Date: 12/23/2018, Cancellation Date: 02/23/2019, Certifier: Kurt Maass, Registrant: Telecom Transport Management, Inc., 146 N. Canal Street, Suite 210, Seattle, WA 98103, Phone: (206) 816-6907, Fax: (206) 545-9585, Email:
MN-MSP0422D, 14055 Rose Street Nw (Lat: 45.226667 Lon: -93.352444), Type: Tank, Structure height: 42.7 m, Call Sign: WQLZ509, Assigned Frequencies: 17815.0 MHz, 23125.0 MHz, 23025.0 MHz, 17915.0 MHz, 23275.0 MHz, Grant Date: 07/21/2020, Expiration Date: 06/04/2030, Cancellation Date: 09/13/2021, Certifier: Nadja S Sodos-Wallace, Registrant: T-Mobile Usa, Inc., 12920 Se 38th Street, Bellevue, WA 98006, Phone: (425) 383-8402, Fax: (425) 383-4840, Email:
Soderville Tower, Co. Rd. 18, (Lat: 45.288944 Lon: -93.237806), Type: Gtower, Structure height: 86.3 m, Call Sign: WQWJ554, Assigned Frequencies: 950.000 MHz, Grant Date: 09/15/2015, Expiration Date: 04/01/2029, Certifier: Sylvia Strobel, Registrant: Minnesota Public Radio, 480 Cedar Street, St. Paul, MN 55101, Phone: (651) 290-1500, Fax: (651) 290-1243, Email:
A1O0059A, Veterans Memorial Blvd Nw And Tower Dr Nw (Lat: 45.247472 Lon: -93.311056), Type: Pole, Structure height: 22.9 m, Call Sign: WRQI294, Assigned Frequencies: 11305.0 MHz, 11345.0 MHz, 11305.0 MHz, 11345.0 MHz, 11305.0 MHz, 11345.0 MHz, 11305.0 MHz, 11345.0 MHz, 11305.0 MHz, 11345.0 MHz... (+6 more), Grant Date: 04/26/2022, Expiration Date: 04/26/2032, Certifier: Jenny Knopf, Registrant: T-Mobile Usa, Inc., 12920 Se 38th Street, Bellevue, WA 98006, Phone: (425) 383-8401, Fax: (425) 383-4040, Email:
A1O0670A, 16191 Round Lake Boulevard Nw (432610) (Lat: 45.263806 Lon: -93.345583), Type: Ltower, Structure height: 61 m, Call Sign: WRQI295, Assigned Frequencies: 10815.0 MHz, 10855.0 MHz, 10815.0 MHz, 10855.0 MHz, 10815.0 MHz, 10855.0 MHz, 10815.0 MHz, 10855.0 MHz, 10815.0 MHz, 10855.0 MHz... (+6 more), Grant Date: 04/26/2022, Expiration Date: 04/26/2032, Certifier: Jenny Knopf, Registrant: T-Mobile Usa, Inc., 12920 Se 38th Street, Bellevue, WA 98006, Phone: (425) 383-8401, Fax: (425) 383-4040, Email:
FCC Registered Amateur Radio Licenses: 115 (
See the full list of FCC Registered Amateur Radio Licenses in Andover )
FAA Registered Aircraft: 24 (
See the full list of FAA Registered Aircraft in Andover )
Home Mortgage Disclosure Act Aggregated Statistics For Year 2009(Based on 7 full tracts) A) FHA, FSA/RHS & VA B) Conventional C) Refinancings D) Home Improvement Loans F) Non-occupant Loans on Number Average Value Number Average Value Number Average Value Number Average Value Number Average Value
LOANS ORIGINATED 217 $193,134 170 $202,212 1,035 $202,157 49 $83,020 27 $144,000 APPLICATIONS APPROVED, NOT ACCEPTED 11 $189,818 7 $158,857 79 $205,924 4 $43,500 1 $161,000 APPLICATIONS DENIED 17 $219,118 14 $198,071 284 $229,954 34 $90,618 4 $105,000 APPLICATIONS WITHDRAWN 20 $197,700 12 $159,417 217 $215,447 7 $77,143 5 $158,600 FILES CLOSED FOR INCOMPLETENESS 4 $177,750 4 $182,250 71 $174,817 0 $0 0 $0
Aggregated Statistics For Year 2008(Based on 7 full tracts) A) FHA, FSA/RHS & VA B) Conventional C) Refinancings D) Home Improvement Loans F) Non-occupant Loans on G) Loans On Manufactured Number Average Value Number Average Value Number Average Value Number Average Value Number Average Value Number Average Value
LOANS ORIGINATED 106 $221,594 218 $212,073 433 $204,515 62 $58,484 39 $188,744 1 $28,000 APPLICATIONS APPROVED, NOT ACCEPTED 6 $209,833 20 $265,300 92 $218,641 12 $72,917 6 $164,500 0 $0 APPLICATIONS DENIED 18 $217,333 46 $246,804 297 $219,919 44 $52,523 21 $219,381 4 $63,250 APPLICATIONS WITHDRAWN 5 $256,400 31 $186,871 131 $236,763 15 $105,200 10 $187,400 0 $0 FILES CLOSED FOR INCOMPLETENESS 5 $272,600 9 $219,889 40 $214,900 4 $43,500 3 $278,000 0 $0
Aggregated Statistics For Year 2007(Based on 7 full tracts) A) FHA, FSA/RHS & VA B) Conventional C) Refinancings D) Home Improvement Loans F) Non-occupant Loans on G) Loans On Manufactured Number Average Value Number Average Value Number Average Value Number Average Value Number Average Value Number Average Value
LOANS ORIGINATED 12 $223,917 345 $214,777 624 $192,764 132 $64,326 39 $235,923 0 $0 APPLICATIONS APPROVED, NOT ACCEPTED 0 $0 36 $221,528 130 $198,300 18 $89,500 5 $119,400 0 $0 APPLICATIONS DENIED 4 $183,500 78 $255,654 397 $231,060 45 $58,422 22 $323,818 3 $28,000 APPLICATIONS WITHDRAWN 1 $142,000 27 $208,000 141 $234,887 22 $189,273 7 $254,000 0 $0 FILES CLOSED FOR INCOMPLETENESS 0 $0 11 $316,727 63 $217,905 5 $80,800 3 $193,667 0 $0
Aggregated Statistics For Year 2006(Based on 7 full tracts) A) FHA, FSA/RHS & VA B) Conventional C) Refinancings D) Home Improvement Loans F) Non-occupant Loans on G) Loans On Manufactured Number Average Value Number Average Value Number Average Value Number Average Value Number Average Value Number Average Value
LOANS ORIGINATED 15 $233,400 544 $196,928 880 $182,184 155 $73,948 78 $188,885 0 $0 APPLICATIONS APPROVED, NOT ACCEPTED 0 $0 88 $188,955 175 $183,074 32 $119,375 6 $127,167 0 $0 APPLICATIONS DENIED 2 $200,000 109 $176,954 418 $211,775 50 $71,560 21 $192,524 4 $27,750 APPLICATIONS WITHDRAWN 1 $200,000 53 $189,075 275 $226,564 29 $101,172 9 $191,111 0 $0 FILES CLOSED FOR INCOMPLETENESS 0 $0 16 $175,875 77 $226,351 11 $71,455 7 $182,714 0 $0
Aggregated Statistics For Year 2005(Based on 7 full tracts) A) FHA, FSA/RHS & VA B) Conventional C) Refinancings D) Home Improvement Loans F) Non-occupant Loans on G) Loans On Manufactured Number Average Value Number Average Value Number Average Value Number Average Value Number Average Value Number Average Value
LOANS ORIGINATED 11 $211,545 755 $192,458 1,021 $190,702 143 $74,664 59 $161,814 0 $0 APPLICATIONS APPROVED, NOT ACCEPTED 1 $288,000 103 $176,786 155 $181,477 13 $74,923 10 $143,400 2 $37,500 APPLICATIONS DENIED 1 $160,000 126 $178,325 381 $210,378 50 $53,840 23 $181,391 6 $48,667 APPLICATIONS WITHDRAWN 0 $0 88 $206,727 318 $217,022 37 $104,189 11 $180,727 1 $17,000 FILES CLOSED FOR INCOMPLETENESS 0 $0 26 $180,346 121 $208,438 7 $76,429 1 $184,000 0 $0
Aggregated Statistics For Year 2004(Based on 7 full tracts) A) FHA, FSA/RHS & VA B) Conventional C) Refinancings D) Home Improvement Loans F) Non-occupant Loans on G) Loans On Manufactured Number Average Value Number Average Value Number Average Value Number Average Value Number Average Value Number Average Value
LOANS ORIGINATED 22 $207,227 684 $199,670 1,304 $183,994 149 $55,691 45 $181,244 0 $0 APPLICATIONS APPROVED, NOT ACCEPTED 2 $202,000 61 $224,000 164 $192,805 21 $82,476 7 $165,143 1 $32,000 APPLICATIONS DENIED 2 $163,000 75 $183,933 350 $195,294 64 $51,906 12 $137,333 12 $33,417 APPLICATIONS WITHDRAWN 1 $171,000 50 $230,380 275 $194,516 22 $47,818 8 $155,625 1 $65,000 FILES CLOSED FOR INCOMPLETENESS 0 $0 25 $162,120 125 $218,992 6 $58,167 7 $93,857 0 $0
Aggregated Statistics For Year 2003(Based on 7 full tracts) A) FHA, FSA/RHS & VA B) Conventional C) Refinancings D) Home Improvement Loans F) Non-occupant Loans on Number Average Value Number Average Value Number Average Value Number Average Value Number Average Value
LOANS ORIGINATED 58 $192,310 683 $195,534 3,402 $165,887 120 $37,583 51 $164,863 APPLICATIONS APPROVED, NOT ACCEPTED 3 $157,333 67 $186,090 282 $169,862 14 $50,000 13 $201,308 APPLICATIONS DENIED 6 $195,167 75 $158,680 582 $164,263 48 $35,542 23 $167,000 APPLICATIONS WITHDRAWN 7 $197,000 56 $197,268 360 $162,114 9 $32,556 7 $191,143 FILES CLOSED FOR INCOMPLETENESS 1 $323,000 14 $172,143 105 $171,981 6 $17,167 2 $221,000
Aggregated Statistics For Year 2002(Based on 1 full tract) A) FHA, FSA/RHS & VA B) Conventional C) Refinancings D) Home Improvement Loans F) Non-occupant Loans on Number Average Value Number Average Value Number Average Value Number Average Value Number Average Value
LOANS ORIGINATED 16 $178,750 61 $154,475 211 $134,626 14 $41,500 3 $123,333 APPLICATIONS APPROVED, NOT ACCEPTED 0 $0 6 $166,333 31 $144,677 4 $32,250 0 $0 APPLICATIONS DENIED 2 $176,000 5 $163,000 29 $132,793 7 $22,571 0 $0 APPLICATIONS WITHDRAWN 0 $0 6 $187,833 39 $133,256 4 $19,000 1 $173,000 FILES CLOSED FOR INCOMPLETENESS 0 $0 0 $0 21 $135,286 0 $0 0 $0
Aggregated Statistics For Year 2001(Based on 1 full tract) A) FHA, FSA/RHS & VA B) Conventional C) Refinancings D) Home Improvement Loans F) Non-occupant Loans on Number Average Value Number Average Value Number Average Value Number Average Value Number Average Value
LOANS ORIGINATED 16 $156,062 47 $133,851 229 $125,790 26 $24,538 1 $112,000 APPLICATIONS APPROVED, NOT ACCEPTED 1 $147,000 3 $121,667 16 $102,938 4 $47,750 0 $0 APPLICATIONS DENIED 1 $113,000 2 $38,500 54 $94,352 4 $21,750 1 $125,000 APPLICATIONS WITHDRAWN 2 $166,500 2 $129,000 36 $123,944 2 $35,000 1 $25,000 FILES CLOSED FOR INCOMPLETENESS 1 $169,000 6 $168,333 11 $108,000 3 $16,333 0 $0
Aggregated Statistics For Year 2000(Based on 1 full tract) A) FHA, FSA/RHS & VA B) Conventional C) Refinancings D) Home Improvement Loans F) Non-occupant Loans on Number Average Value Number Average Value Number Average Value Number Average Value Number Average Value
LOANS ORIGINATED 20 $153,800 72 $119,847 73 $89,164 26 $24,038 0 $0 APPLICATIONS APPROVED, NOT ACCEPTED 0 $0 1 $26,000 11 $77,727 7 $19,000 0 $0 APPLICATIONS DENIED 0 $0 8 $152,000 41 $61,707 9 $25,333 1 $144,000 APPLICATIONS WITHDRAWN 0 $0 3 $110,333 17 $81,706 1 $15,000 0 $0 FILES CLOSED FOR INCOMPLETENESS 0 $0 3 $80,667 9 $125,444 0 $0 0 $0
Aggregated Statistics For Year 1999(Based on 3 full tracts) A) FHA, FSA/RHS & VA B) Conventional C) Refinancings D) Home Improvement Loans E) Loans on Dwellings For 5+ Families F) Non-occupant Loans on Number Average Value Number Average Value Number Average Value Number Average Value Number Average Value Number Average Value
LOANS ORIGINATED 134 $139,600 630 $143,877 795 $101,845 169 $22,221 2 $549,020 15 $84,439 APPLICATIONS APPROVED, NOT ACCEPTED 3 $156,533 50 $122,937 129 $90,806 27 $27,362 0 $0 2 $40,745 APPLICATIONS DENIED 6 $133,370 85 $91,574 234 $87,713 51 $24,637 0 $0 5 $91,256 APPLICATIONS WITHDRAWN 6 $121,833 31 $143,587 196 $107,262 35 $57,865 0 $0 1 $97,380 FILES CLOSED FOR INCOMPLETENESS 1 $126,200 17 $129,935 68 $110,704 3 $68,243 0 $0 0 $0
Detailed HMDA statistics for the following Tracts:
0502.08
, 0502.17 , 0502.18 , 0502.19 , 0502.20 , 0502.21 , 0502.22
Private Mortgage Insurance Companies Aggregated Statistics For Year 2009(Based on 7 full tracts) A) Conventional B) Refinancings C) Non-occupant Loans on Number Average Value Number Average Value Number Average Value
LOANS ORIGINATED 36 $217,389 29 $257,724 0 $0 APPLICATIONS APPROVED, NOT ACCEPTED 5 $207,400 8 $265,125 0 $0 APPLICATIONS DENIED 6 $235,500 6 $295,167 0 $0 APPLICATIONS WITHDRAWN 3 $186,000 6 $259,833 1 $200,000 FILES CLOSED FOR INCOMPLETENESS 2 $223,000 0 $0 0 $0
Aggregated Statistics For Year 2008(Based on 7 full tracts) A) Conventional B) Refinancings C) Non-occupant Loans on Number Average Value Number Average Value Number Average Value
LOANS ORIGINATED 74 $229,757 33 $239,000 3 $188,333 APPLICATIONS APPROVED, NOT ACCEPTED 12 $258,000 18 $241,722 1 $200,000 APPLICATIONS DENIED 2 $244,000 10 $282,400 3 $229,333 APPLICATIONS WITHDRAWN 2 $164,500 3 $433,333 0 $0 FILES CLOSED FOR INCOMPLETENESS 0 $0 2 $284,000 1 $314,000
Aggregated Statistics For Year 2007(Based on 7 full tracts) A) Conventional B) Refinancings C) Non-occupant Loans on Number Average Value Number Average Value Number Average Value
LOANS ORIGINATED 99 $244,606 57 $239,772 10 $293,000 APPLICATIONS APPROVED, NOT ACCEPTED 16 $233,500 7 $288,286 2 $243,000 APPLICATIONS DENIED 1 $217,000 0 $0 0 $0 APPLICATIONS WITHDRAWN 0 $0 3 $252,667 0 $0 FILES CLOSED FOR INCOMPLETENESS 0 $0 0 $0 0 $0
Aggregated Statistics For Year 2006(Based on 7 full tracts) A) Conventional B) Refinancings C) Non-occupant Loans on Number Average Value Number Average Value Number Average Value
LOANS ORIGINATED 47 $260,660 28 $259,893 1 $174,000 APPLICATIONS APPROVED, NOT ACCEPTED 4 $311,750 6 $240,833 0 $0 APPLICATIONS DENIED 0 $0 0 $0 0 $0 APPLICATIONS WITHDRAWN 2 $215,500 5 $250,600 0 $0 FILES CLOSED FOR INCOMPLETENESS 0 $0 0 $0 0 $0
Aggregated Statistics For Year 2005(Based on 7 full tracts) A) Conventional B) Refinancings C) Non-occupant Loans on Number Average Value Number Average Value Number Average Value
LOANS ORIGINATED 72 $250,417 55 $240,564 4 $217,250 APPLICATIONS APPROVED, NOT ACCEPTED 5 $188,600 18 $224,333 2 $160,500 APPLICATIONS DENIED 0 $0 1 $182,000 1 $182,000 APPLICATIONS WITHDRAWN 1 $270,000 6 $228,333 0 $0 FILES CLOSED FOR INCOMPLETENESS 0 $0 1 $284,000 0 $0
Aggregated Statistics For Year 2004(Based on 7 full tracts) A) Conventional B) Refinancings C) Non-occupant Loans on Number Average Value Number Average Value Number Average Value
LOANS ORIGINATED 82 $234,268 62 $229,081 5 $229,600 APPLICATIONS APPROVED, NOT ACCEPTED 10 $224,400 21 $217,143 1 $190,000 APPLICATIONS DENIED 2 $188,500 0 $0 0 $0 APPLICATIONS WITHDRAWN 6 $233,667 11 $235,455 6 $216,667 FILES CLOSED FOR INCOMPLETENESS 1 $264,000 2 $220,500 0 $0
Aggregated Statistics For Year 2003(Based on 7 full tracts) A) Conventional B) Refinancings C) Non-occupant Loans on Number Average Value Number Average Value Number Average Value
LOANS ORIGINATED 174 $221,161 161 $205,826 3 $224,333 APPLICATIONS APPROVED, NOT ACCEPTED 22 $224,864 62 $203,661 5 $210,400 APPLICATIONS DENIED 2 $229,500 4 $264,750 0 $0 APPLICATIONS WITHDRAWN 5 $233,200 16 $221,375 3 $195,667 FILES CLOSED FOR INCOMPLETENESS 0 $0 0 $0 0 $0
Aggregated Statistics For Year 2002(Based on 1 full tract) A) Conventional B) Refinancings C) Non-occupant Loans on Number Average Value Number Average Value Number Average Value
LOANS ORIGINATED 25 $190,440 28 $171,929 2 $197,500 APPLICATIONS APPROVED, NOT ACCEPTED 3 $152,667 5 $169,600 0 $0 APPLICATIONS DENIED 0 $0 0 $0 0 $0 APPLICATIONS WITHDRAWN 1 $132,000 2 $155,000 2 $143,500 FILES CLOSED FOR INCOMPLETENESS 0 $0 0 $0 0 $0
Aggregated Statistics For Year 2001(Based on 1 full tract) A) Conventional B) Refinancings C) Non-occupant Loans on Number Average Value Number Average Value Number Average Value
LOANS ORIGINATED 19 $159,158 19 $166,789 0 $0 APPLICATIONS APPROVED, NOT ACCEPTED 2 $163,500 2 $147,000 1 $168,000 APPLICATIONS DENIED 0 $0 0 $0 0 $0 APPLICATIONS WITHDRAWN 0 $0 0 $0 0 $0 FILES CLOSED FOR INCOMPLETENESS 0 $0 1 $157,000 0 $0
Aggregated Statistics For Year 2000(Based on 1 full tract) A) Conventional B) Refinancings C) Non-occupant Loans on Number Average Value Number Average Value Number Average Value
LOANS ORIGINATED 15 $148,467 11 $127,818 1 $134,000 APPLICATIONS APPROVED, NOT ACCEPTED 0 $0 1 $113,000 0 $0 APPLICATIONS DENIED 0 $0 0 $0 0 $0 APPLICATIONS WITHDRAWN 0 $0 0 $0 0 $0 FILES CLOSED FOR INCOMPLETENESS 0 $0 0 $0 0 $0
Aggregated Statistics For Year 1999(Based on 3 full tracts) A) Conventional B) Refinancings C) Non-occupant Loans on Number Average Value Number Average Value Number Average Value
LOANS ORIGINATED 231 $161,457 74 $141,284 4 $149,910 APPLICATIONS APPROVED, NOT ACCEPTED 9 $172,866 22 $111,357 0 $0 APPLICATIONS DENIED 4 $145,618 4 $148,418 0 $0 APPLICATIONS WITHDRAWN 2 $238,490 7 $137,717 0 $0 FILES CLOSED FOR INCOMPLETENESS 0 $0 1 $97,380 0 $0
Detailed PMIC statistics for the following Tracts:
0502.08
, 0502.17 , 0502.18 , 0502.19 , 0502.20 , 0502.21 , 0502.22 Andover compared to Minnesota state average:
Unemployed percentage significantly below state average. Hispanic race population percentage below state average. Median age below state average. Renting percentage significantly below state average. Length of stay since moving in significantly above state average. Number of rooms per house above state average. House age significantly below state average.
#99 on the list of "Top 101 cities with the smallest household incomes disparities (population 5,000+)"
#78 (55304) on the list of "Top 101 zip codes with the largest percentage of Swedish first ancestries (pop 5,000+)"
#22 on the list of "Top 101 counties with the lowest number of infant deaths per 1000 residents 2007-2013 (pop. 50,000+)"
#24 on the list of "Top 101 counties with the highest percentage of residents that exercised in the past month"
#31 on the list of "Top 101 counties with the highest carbon monoxide air pollution readings in 2012 (ppm)"
#33 on the list of "Top 101 counties with the largest increase in the number of deaths per 1000 residents 2000-2006 to 2007-2013 (pop. 50,000+)"
#37 on the list of "Top 101 counties with the lowest number of deaths per 1000 residents 2007-2013 (pop. 50,000+)"
Top Patent Applicants
Nathan A. Torgerson (57)
Douglas A. Hettrick (36)
William T. Donofrio (34)
D. Curtis Deno (33)
Bradley H. Hines (26)
Thomas J. Mullen (25)
Alan Cornett (25)
Wade Daniel Palashewski (22)
Clayton V. Mcneff (21)
David A. Weinzierl (20)
Total of 1129 patent applications in 2008-2024.
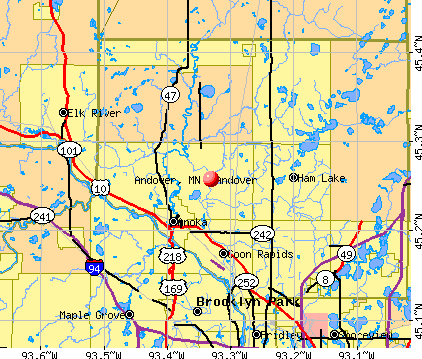


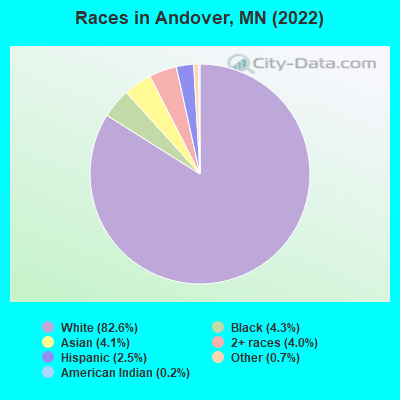
 Recent articles from our blog. Our writers, many of them Ph.D. graduates or candidates, create easy-to-read articles on a wide variety of topics.

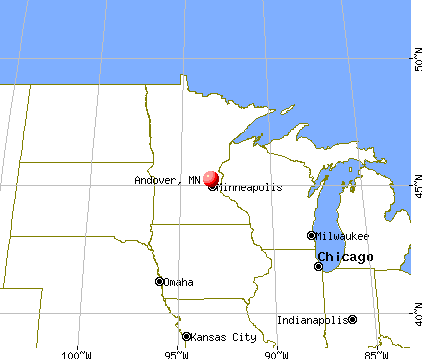
 (6.1 miles
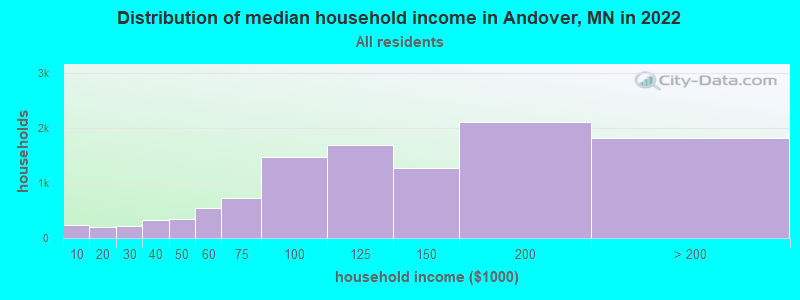
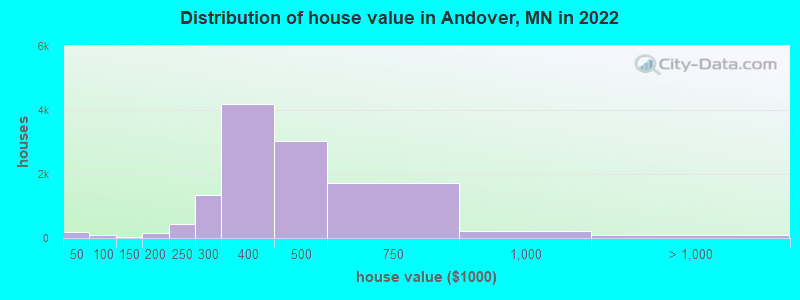
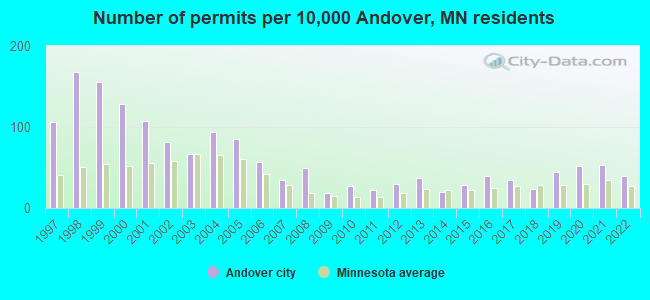
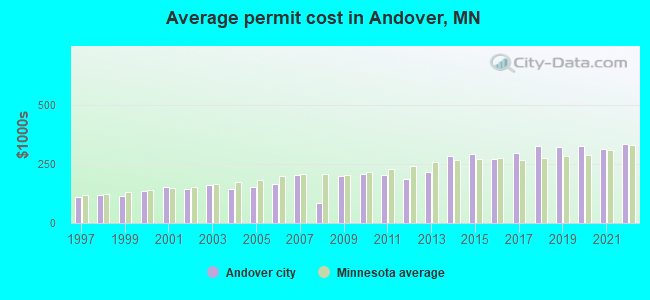
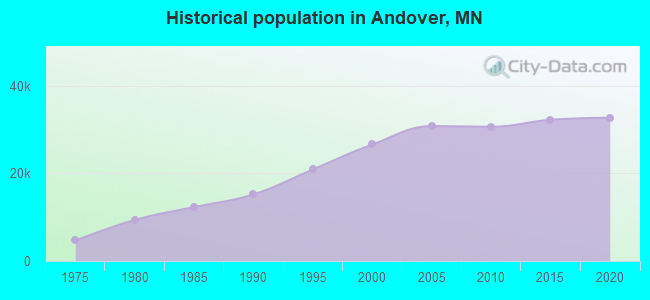
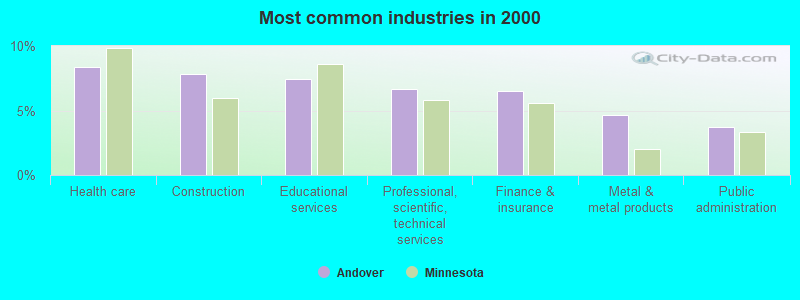
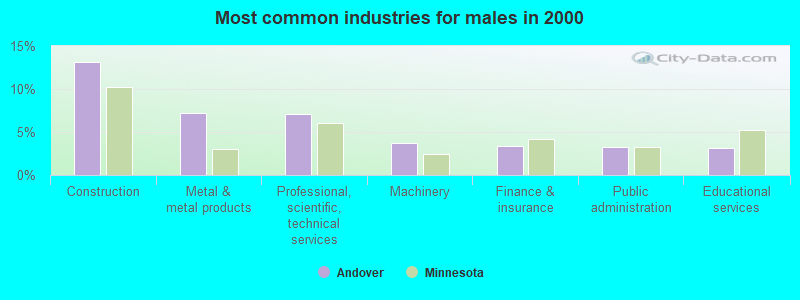
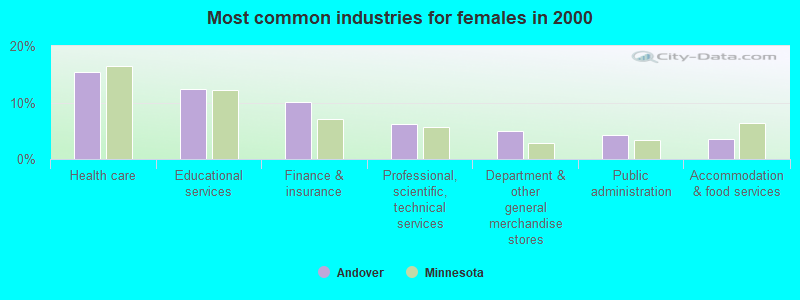
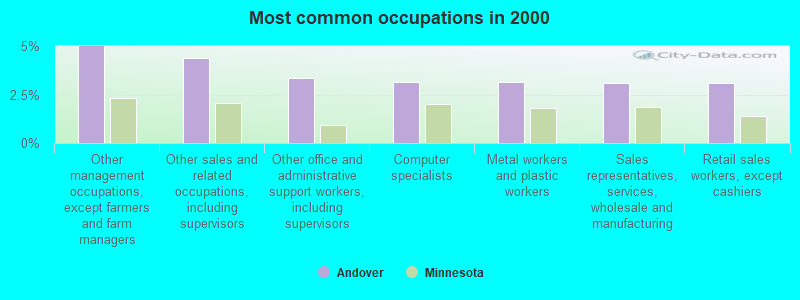
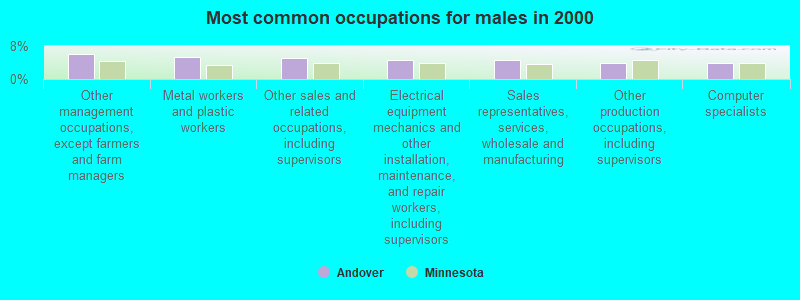
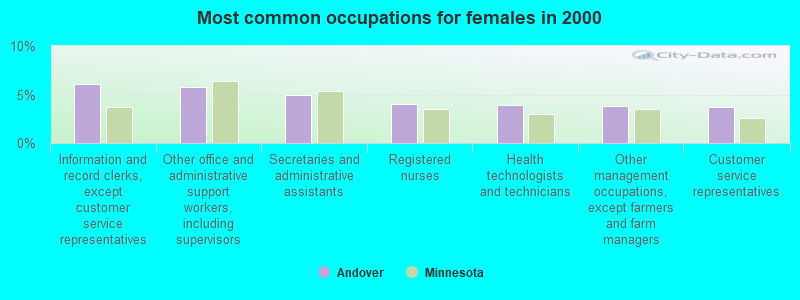
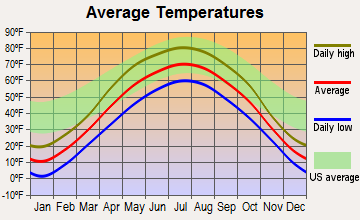

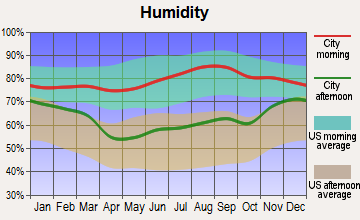
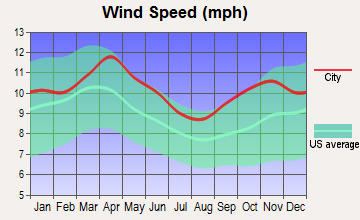
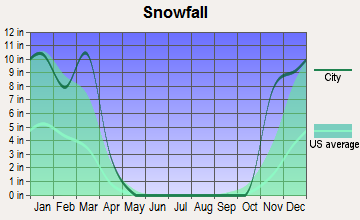
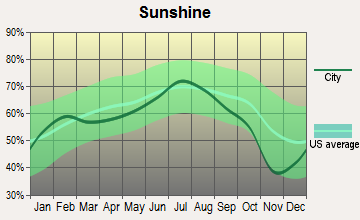
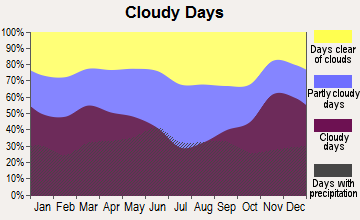
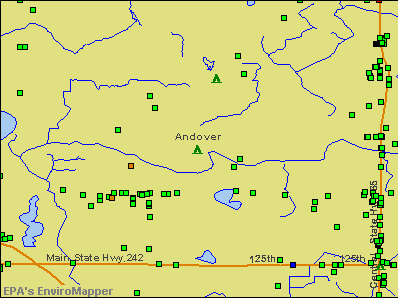

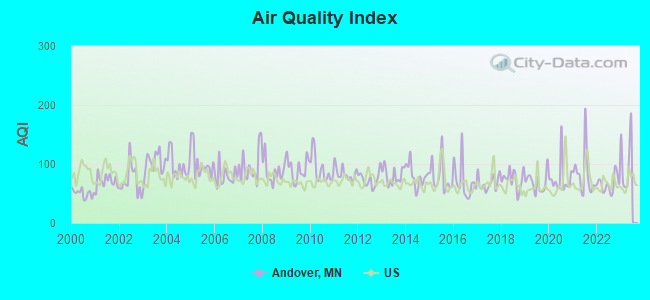
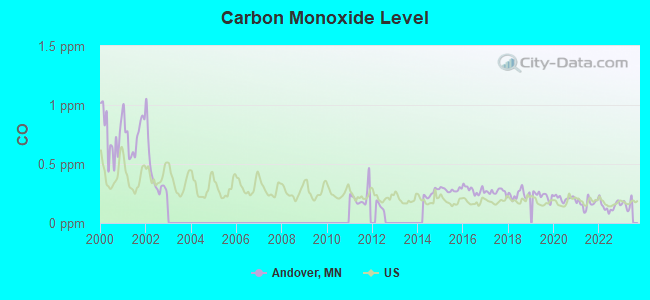
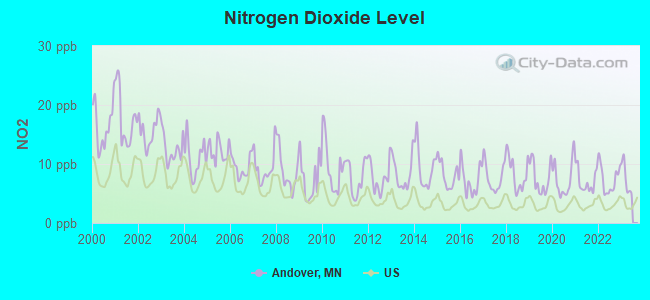
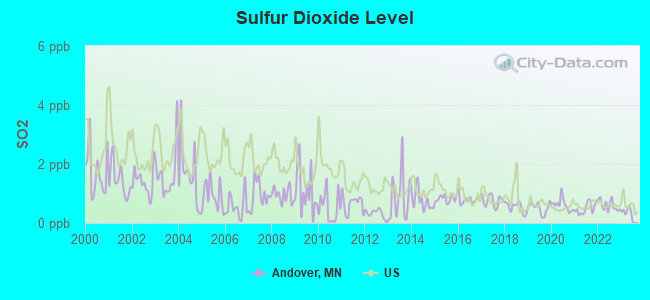
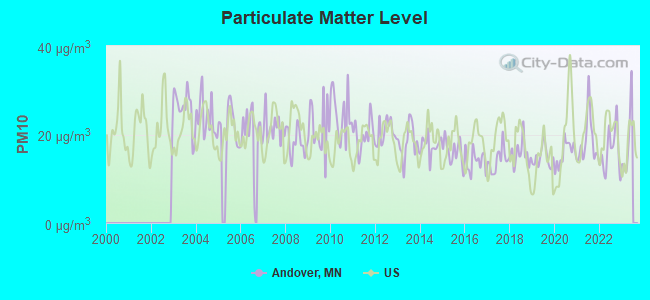
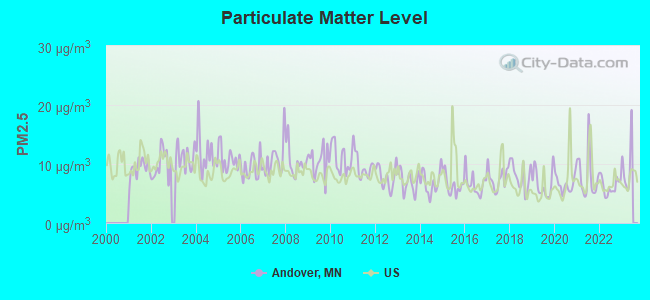
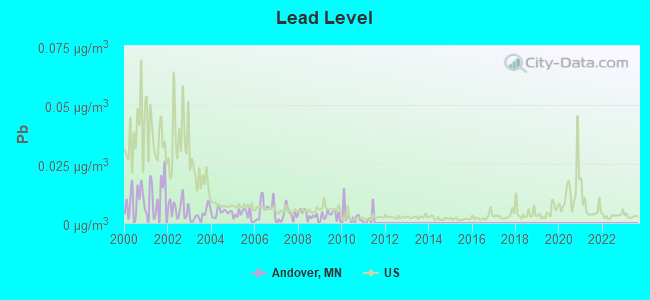
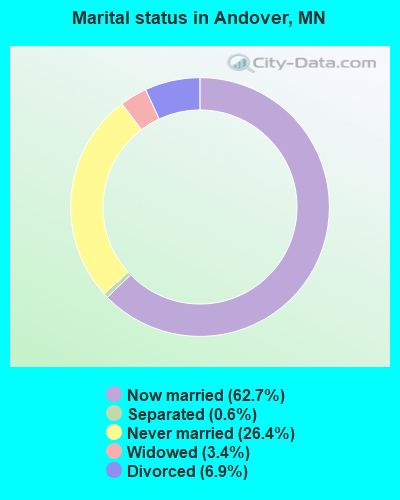
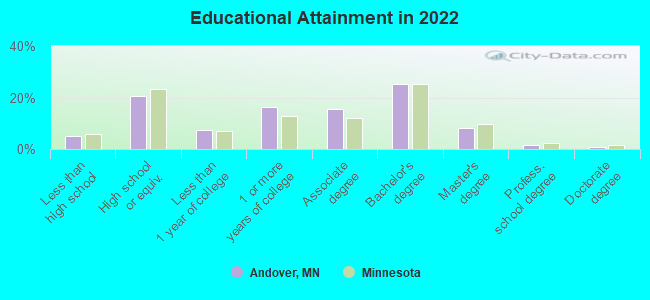
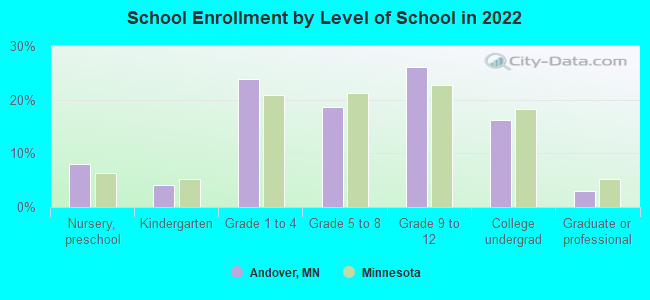
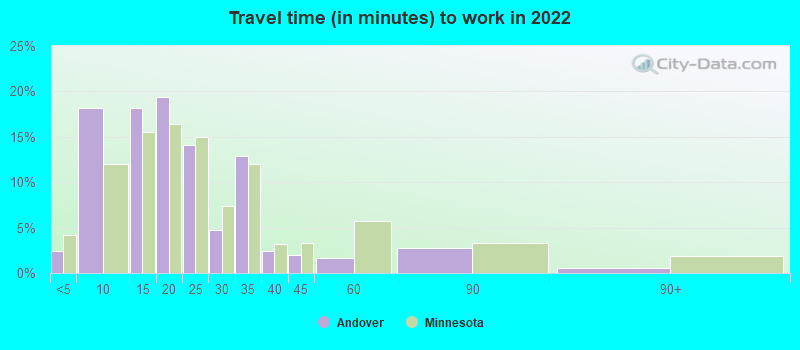
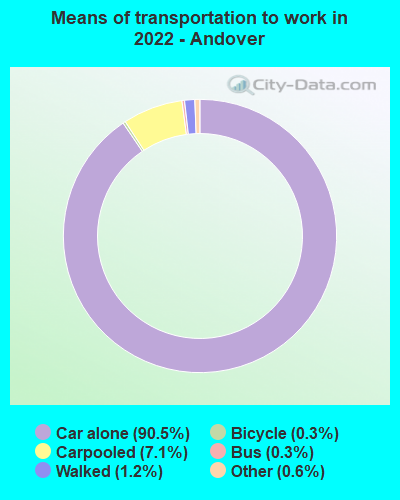
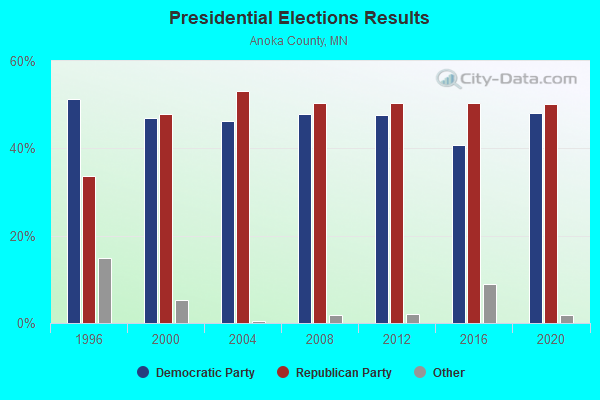
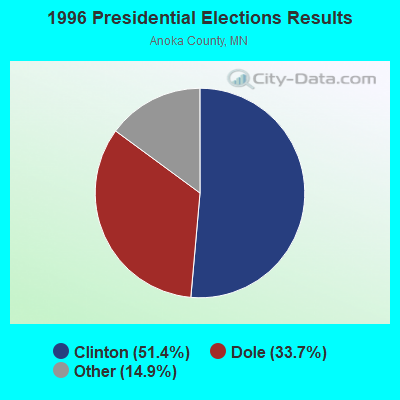
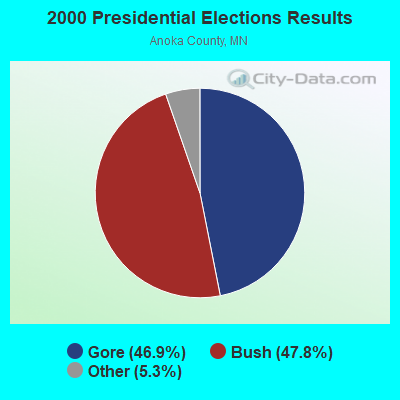
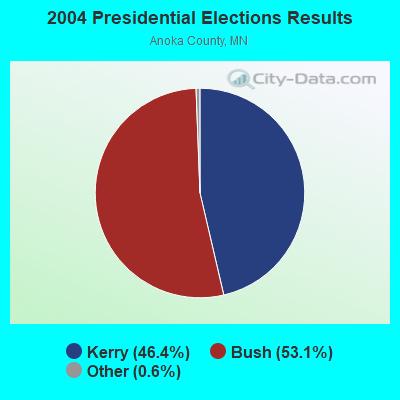
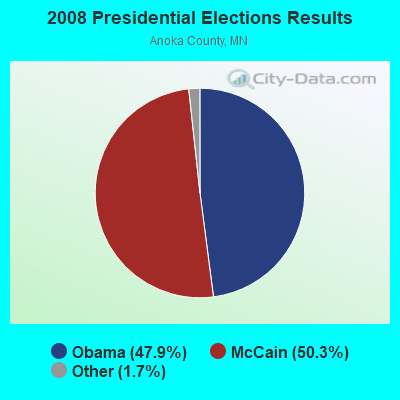

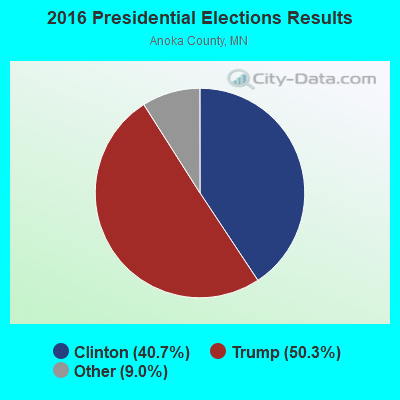
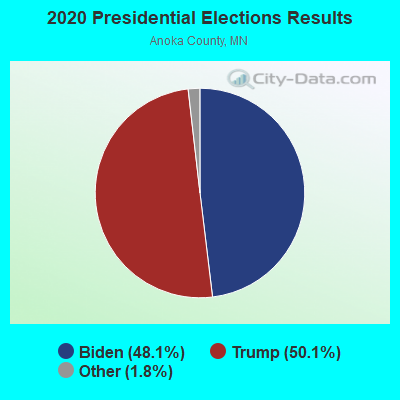
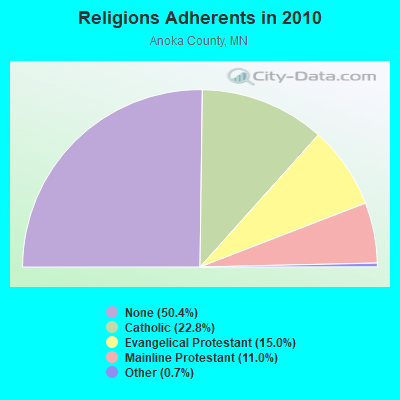
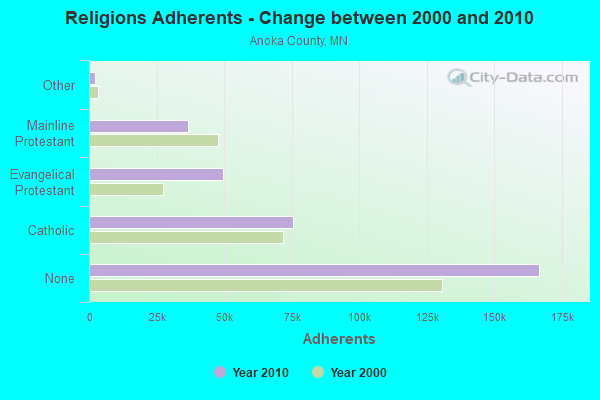
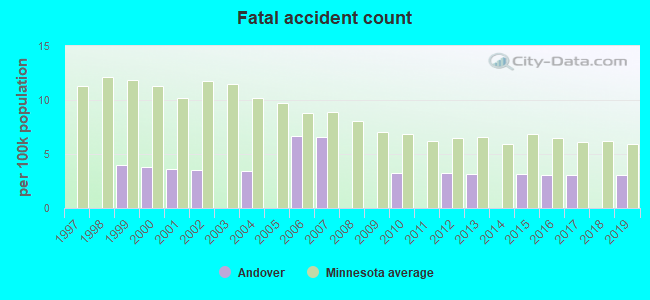
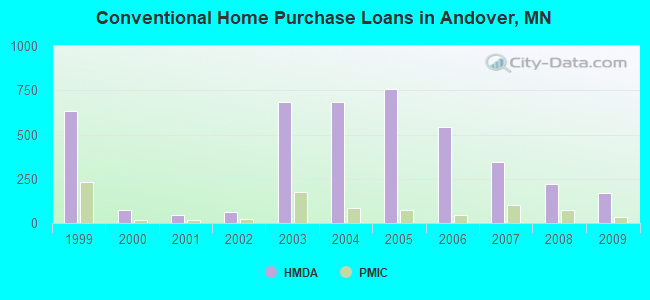
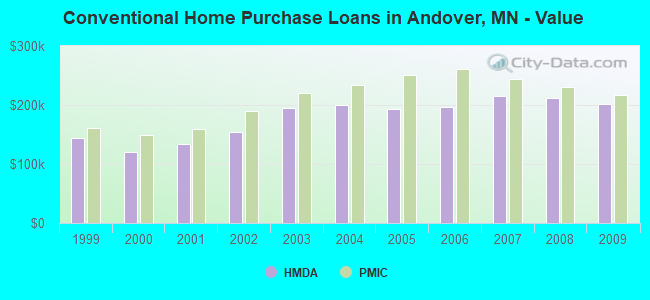
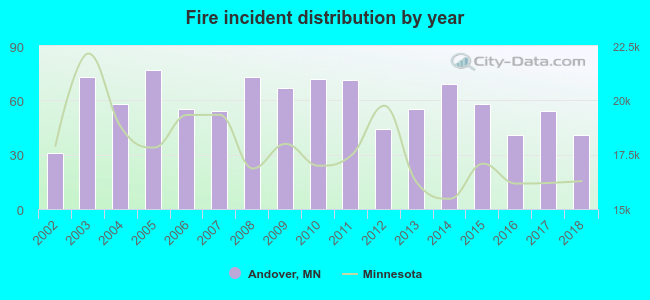 According to the data from the years 2002 - 2018 the average number of fire incidents per year is 58. The highest number of reported fires - 77 took place in 2005, and the least - 31 in 2002. The data has an increasing trend.
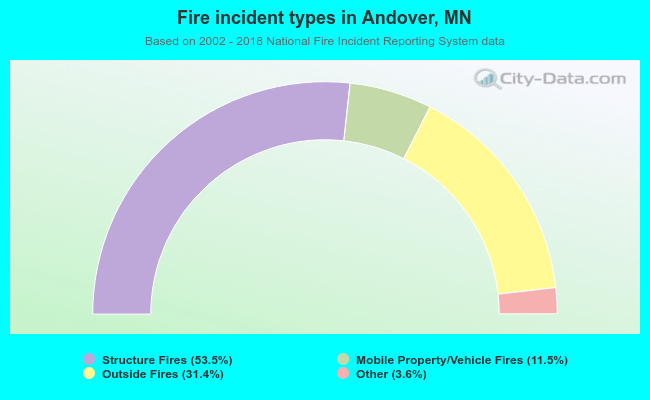 When looking into fire subcategories, the most incidents belonged to: Structure Fires (53.5%), and Outside Fires (31.4%).