Estimated zip code population in 2022: 36,689 Zip code population in 2010: 37,947 Zip code population in 2000: 37,461
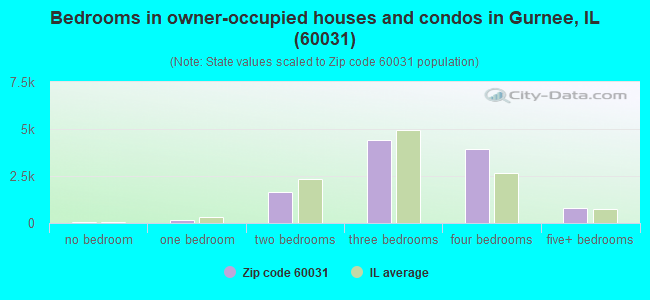
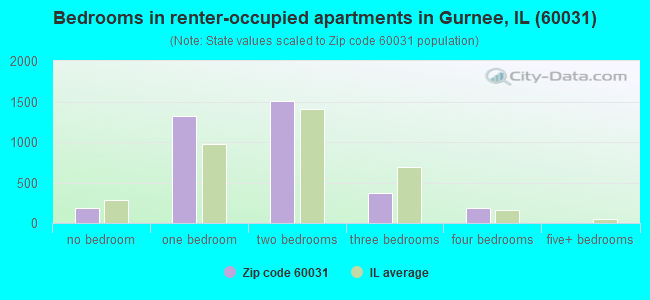
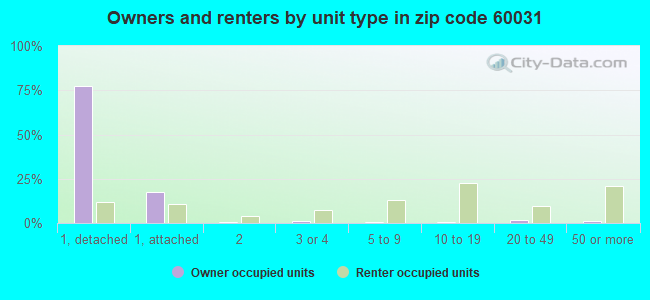
Houses and condos: 14,949 Renter-occupied apartments: 3,557
% of renters here:
24%
State:
33%
March 2022 cost of living index in zip code 60031: 97.7 (near average, U.S. average is 100)
Land area: 18.9 sq. mi. Water area: 0.3 sq. mi.
Population density: 1,945 people per square mile
(low).
OSM Map
General Map
Google Map
MSN Map
OSM Map
General Map
Google Map
MSN Map
OSM Map
General Map
Google Map
MSN Map
OSM Map
General Map
Google Map
MSN Map
Please wait while loading the map...
Real estate property taxes paid for housing units in 2022:
This zip code:
2.4% ($7,705)
Illinois:
2.0% ($4,912)
Median real estate property taxes paid for housing units with mortgages in 2022: $7,857 (2.4%) Median real estate property taxes paid for housing units with no mortgage in 2022: $7,229 (2.4%)
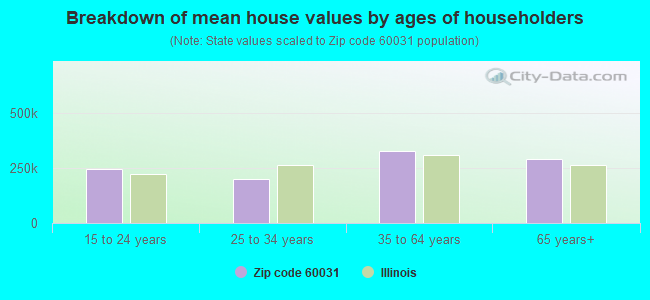
Estimated median house/condo value in 2022: $324,418
60031:
$324,418
Illinois:
$251,600
According to our research of Illinois and other state lists, there were 26 registered sex offenders living in 60031 zip code as of April 27, 2024. The ratio of all residents to sex offenders in zip code 60031 is 1,461 to 1. The ratio of registered sex offenders to all residents in this zip code is lower than the state average.
Median resident age:
This zip code:
40.8 years
Illinois median age:
39.1 years
Average household size:
This zip code:
2.5 people
Illinois:
2.4 people
Averages for the 2020 tax year for zip code 60031, filed in 2021:
Average Adjusted Gross Income (AGI) in 2020: $90,134 (Individual Income Tax Returns)
Here:
$90,134
State:
$82,626
Salary/wage: $80,835 (reported on 83.3% of returns)
Here:
$80,835
State:
$66,640
(% of AGI for various income ranges: 1113.5% for AGIs below $25k, 3530.2% for AGIs $25k-50k, 6219.3% for AGIs $50k-75k, 9277.2% for AGIs $75k-100k, 18182.0% for AGIs $100k-200k, 74415.6% for AGIs over 200k)
Taxable interest for individuals: $1,365 (reported on 36.8% of returns)
This zip code:
$1,365
Illinois:
$2,376
(% of AGI for various income ranges: 16.5% for AGIs below $25k, 30.6% for AGIs $25k-50k, 44.7% for AGIs $50k-75k, 54.0% for AGIs $75k-100k, 110.2% for AGIs $100k-200k, 619.2% for AGIs over 200k)
Ordinary dividends: $6,821 (reported on 29.2% of returns)
Here:
$6,821
State:
$9,061
(% of AGI for various income ranges: 29.8% for AGIs below $25k, 63.4% for AGIs $25k-50k, 122.7% for AGIs $50k-75k, 204.3% for AGIs $75k-100k, 448.3% for AGIs $100k-200k, 3087.7% for AGIs over 200k)
Net capital gain/loss in AGI: +$14,224 (reported on 24.6% of returns)
Here:
+$14,224
State:
+$31,684
(% of AGI for various income ranges: 21.1% for AGIs below $25k, 43.2% for AGIs $25k-50k, 102.9% for AGIs $50k-75k, 166.1% for AGIs $75k-100k, 391.9% for AGIs $100k-200k, 8113.3% for AGIs over 200k)
Profit/loss from business: +$12,201 (reported on 14.0% of returns)
Here:
+$12,201
State:
+$12,175
(% of AGI for various income ranges: 106.3% for AGIs below $25k, 146.9% for AGIs $25k-50k, 160.3% for AGIs $50k-75k, 163.2% for AGIs $75k-100k, 335.1% for AGIs $100k-200k, 1783.3% for AGIs over 200k)
Taxable individual retirement arrangement distribution: $26,630 (reported on 10.4% of returns)
60031:
$26,630
Illinois:
$21,613
(% of AGI for various income ranges: 58.7% for AGIs below $25k, 123.8% for AGIs $25k-50k, 242.6% for AGIs $50k-75k, 428.6% for AGIs $75k-100k, 835.4% for AGIs $100k-200k, 2701.2% for AGIs over 200k)
Self-employed (Keogh) retirement plans: $19,512 (reported on 0.4% of returns)
60031:
$19,512
Illinois:
$30,962
(% of AGI for various income ranges: 22.3% for AGIs $100k-200k, 163.1% for AGIs over 200k)
Total itemized deductions: $29,475 (reported on 12.1% of returns)
Here:
$29,475
State:
$34,948
(% of AGI for various income ranges: 99.1% for AGIs below $25k, 155.4% for AGIs $25k-50k, 412.4% for AGIs $50k-75k, 683.7% for AGIs $75k-100k, 939.2% for AGIs $100k-200k, 3231.7% for AGIs over 200k)
Charity contributions: $8,578 (reported on 9.6% of returns)
Here:
$8,578
State:
$13,122
(% of AGI for various income ranges: 3.1% for AGIs below $25k, 12.3% for AGIs $25k-50k, 52.2% for AGIs $50k-75k, 84.9% for AGIs $75k-100k, 212.7% for AGIs $100k-200k, 1286.2% for AGIs over 200k)
Taxes paid: $8,726 (reported on 12.0% of returns)
60031:
$8,726
State:
$8,563
(% of AGI for various income ranges: 19.0% for AGIs below $25k, 44.6% for AGIs $25k-50k, 140.1% for AGIs $50k-75k, 240.6% for AGIs $75k-100k, 309.3% for AGIs $100k-200k, 754.1% for AGIs over 200k)
Earned income credit: $2,099 (reported on 9.6% of returns)
Here:
$2,099
State:
$2,311
(% of AGI for various income ranges: 64.8% for AGIs below $25k, 52.9% for AGIs $25k-50k, 0.6% for AGIs $50k-75k)
Percentage of individuals using paid preparers for their 2020 taxes: 92.0%
Here:
92%
State:
93%
(% for various income ranges: 90.4% for AGIs below $25k, 91.8% for AGIs $25k-50k, 93.3% for AGIs $50k-75k, 91.9% for AGIs $75k-100k, 92.9% for AGIs $100k-200k, 93.0% for AGIs over 200k)
Averages for the 2012 tax year for zip code 60031, filed in 2013:
Average Adjusted Gross Income (AGI) in 2012: $80,883 (Individual Income Tax Returns)
Here:
$80,883
State:
$68,058
Salary/wage: $74,745 (reported on 87.0% of returns)
Here:
$74,745
State:
$55,396
(% of AGI for various income ranges: 76.1% for AGIs below $25k, 79.9% for AGIs $25k-50k, 78.5% for AGIs $50k-75k, 79.4% for AGIs $75k-100k, 84.2% for AGIs $100k-200k, 77.8% for AGIs over 200k)
Taxable interest for individuals: $973 (reported on 41.4% of returns)
This zip code:
$973
Illinois:
$1,969
(% of AGI for various income ranges: 1.2% for AGIs below $25k, 0.6% for AGIs $25k-50k, 0.6% for AGIs $50k-75k, 0.5% for AGIs $75k-100k, 0.4% for AGIs $100k-200k, 0.4% for AGIs over 200k)
Ordinary dividends: $4,072 (reported on 30.8% of returns)
Here:
$4,072
State:
$7,786
(% of AGI for various income ranges: 2.4% for AGIs below $25k, 1.2% for AGIs $25k-50k, 1.5% for AGIs $50k-75k, 1.4% for AGIs $75k-100k, 1.3% for AGIs $100k-200k, 1.9% for AGIs over 200k)
Net capital gain/loss in AGI: +$6,887 (reported on 23.3% of returns)
Here:
+$6,887
State:
+$22,183
(% of AGI for various income ranges: 0.3% for AGIs $25k-50k, 0.5% for AGIs $50k-75k, 0.7% for AGIs $75k-100k, 0.7% for AGIs $100k-200k, 5.0% for AGIs over 200k)
Profit/loss from business: +$13,862 (reported on 12.8% of returns)
Here:
+$13,862
State:
+$12,903
(% of AGI for various income ranges: 6.8% for AGIs below $25k, 3.1% for AGIs $25k-50k, 2.5% for AGIs $50k-75k, 1.6% for AGIs $75k-100k, 1.6% for AGIs $100k-200k, 2.1% for AGIs over 200k)
Taxable individual retirement arrangement distribution: $18,868 (reported on 10.8% of returns)
60031:
$18,868
Illinois:
$17,929
(% of AGI for various income ranges: 3.6% for AGIs below $25k, 3.0% for AGIs $25k-50k, 2.9% for AGIs $50k-75k, 3.2% for AGIs $75k-100k, 2.6% for AGIs $100k-200k, 1.8% for AGIs over 200k)
Self-employment retirement plans: $17,600 (reported on 0.6% of returns)
60031:
$17,600
Illinois:
$24,666
(% of AGI for various income ranges: 0.2% for AGIs $25k-50k, 0.1% for AGIs $100k-200k, 0.2% for AGIs over 200k)
Total itemized deductions: $25,255 (19% of AGI, reported on 49.7% of returns)
Here:
$25,255
State:
$26,433
Here:
19.2% of AGI
State:
19.2% of AGI
(% of AGI for various income ranges: 14.9% for AGIs below $25k, 13.7% for AGIs $25k-50k, 17.3% for AGIs $50k-75k, 18.4% for AGIs $75k-100k, 17.4% for AGIs $100k-200k, 12.4% for AGIs over 200k)
Charity contributions: $3,208 (reported on 42.6% of returns)
Here:
$3,208
State:
$4,525
(% of AGI for various income ranges: 0.8% for AGIs below $25k, 1.1% for AGIs $25k-50k, 1.6% for AGIs $50k-75k, 1.8% for AGIs $75k-100k, 1.9% for AGIs $100k-200k, 1.7% for AGIs over 200k)
Taxes paid: $12,504 (reported on 49.6% of returns)
60031:
$12,504
State:
$11,968
(% of AGI for various income ranges: 5.6% for AGIs below $25k, 5.1% for AGIs $25k-50k, 7.2% for AGIs $50k-75k, 8.2% for AGIs $75k-100k, 8.8% for AGIs $100k-200k, 7.3% for AGIs over 200k)
Earned income credit: $2,081 (reported on 10.1% of returns)
Here:
$2,081
State:
$2,349
(% of AGI for various income ranges: 4.8% for AGIs below $25k, 0.9% for AGIs $25k-50k)
Percentage of individuals using paid preparers for their 2012 taxes: 51.0%
Here:
51%
State:
57%
(% for various income ranges: 44.9% for AGIs below $25k, 51.0% for AGIs $25k-50k, 53.7% for AGIs $50k-75k, 53.1% for AGIs $75k-100k, 53.5% for AGIs $100k-200k, 62.3% for AGIs over 200k)
Averages for the 2004 tax year for zip code 60031, filed in 2005:
Average Adjusted Gross Income (AGI) in 2004: $68,827 (Individual Income Tax Returns)
Here:
$68,827
State:
$54,625
Salary/wage: $65,281 (reported on 88.3% of returns)
Here:
$65,281
State:
$46,811
(% of AGI for various income ranges: 162.6% for AGIs below $10k, 72.7% for AGIs $10k-25k, 83.8% for AGIs $25k-50k, 84.6% for AGIs $50k-75k, 86.1% for AGIs $75k-100k, 82.7% for AGIs over 100k)
Taxable interest for individuals: $1,197 (reported on 59.5% of returns)
This zip code:
$1,197
Illinois:
$2,101
(% of AGI for various income ranges: 9.7% for AGIs below $10k, 2.5% for AGIs $10k-25k, 1.2% for AGIs $25k-50k, 1.0% for AGIs $50k-75k, 0.8% for AGIs $75k-100k, 0.9% for AGIs over 100k)
Taxable dividends: $2,212 (reported on 37.4% of returns)
Here:
$2,212
State:
$4,306
(% of AGI for various income ranges: 7.4% for AGIs below $10k, 2.6% for AGIs $10k-25k, 1.2% for AGIs $25k-50k, 1.0% for AGIs $50k-75k, 1.1% for AGIs $75k-100k, 1.1% for AGIs over 100k)
Net capital gain/loss: +$6,203 (reported on 29.0% of returns)
Here:
+$6,203
State:
+$17,321
(% of AGI for various income ranges: -3.8% for AGIs below $10k, 0.5% for AGIs $10k-25k, 0.5% for AGIs $25k-50k, 0.7% for AGIs $50k-75k, 1.1% for AGIs $75k-100k, 4.1% for AGIs over 100k)
Profit/loss from business: +$12,335 (reported on 13.3% of returns)
Here:
+$12,335
State:
+$11,771
(% of AGI for various income ranges: 6.5% for AGIs below $10k, 5.8% for AGIs $10k-25k, 3.3% for AGIs $25k-50k, 2.5% for AGIs $50k-75k, 1.8% for AGIs $75k-100k, 2.1% for AGIs over 100k)
IRA payment deduction: $3,204 (reported on 3.0% of returns)
60031:
$3,204
Illinois:
$3,087
(% of AGI for various income ranges: 0.5% for AGIs below $10k, 0.2% for AGIs $10k-25k, 0.3% for AGIs $25k-50k, 0.2% for AGIs $50k-75k, 0.1% for AGIs $75k-100k, 0.1% for AGIs over 100k)
Self-employed pension: $12,184 (reported on 1.0% of returns)
Here:
$12,184
Illinois:
$16,965
(% of AGI for various income ranges: 0.1% for AGIs $25k-50k, 0.1% for AGIs $50k-75k, 0.1% for AGIs $75k-100k, 0.3% for AGIs over 100k)
Total itemized deductions: $20,871 (20% of AGI, reported on 55.5% of returns)
Here:
$20,871
State:
$20,239
Here:
20.2% of AGI
State:
19.5% of AGI
(% of AGI for various income ranges: 31.6% for AGIs below $10k, 18.6% for AGIs $10k-25k, 17.2% for AGIs $25k-50k, 19.7% for AGIs $50k-75k, 20.0% for AGIs $75k-100k, 14.9% for AGIs over 100k)
Charity contributions deductions: $2,898 (3% of AGI, reported on 50.4% of returns)
Here:
$2,898
State:
$3,719
Here:
2.7% of AGI
State:
3.4% of AGI
(% of AGI for various income ranges: 1.5% for AGIs below $10k, 1.2% for AGIs $10k-25k, 1.7% for AGIs $25k-50k, 2.0% for AGIs $50k-75k, 2.4% for AGIs $75k-100k, 2.2% for AGIs over 100k)
Total tax: $11,229 (reported on 82.5% of returns)
60031:
$11,229
State:
$9,882
(% of AGI for various income ranges: 4.4% for AGIs below $10k, 4.5% for AGIs $10k-25k, 7.4% for AGIs $25k-50k, 9.3% for AGIs $50k-75k, 9.8% for AGIs $75k-100k, 17.3% for AGIs over 100k)
Earned income credit: $1,537 (reported on 6.6% of returns)
Here:
$1,537
State:
$1,788
Percentage of individuals using paid preparers for their 2004 taxes: 53.2%
Here:
53%
State:
61%
(% for various income ranges: 44.7% for AGIs below $10k, 56.5% for AGIs $10k-25k, 55.3% for AGIs $25k-50k, 55.9% for AGIs $50k-75k, 52.9% for AGIs $75k-100k, 54.0% for AGIs over 100k)
Likely homosexual households (counted as self-reported same-sex unmarried-partner households)
Lesbian couples: 0.0% of all households
Gay men: 0.3% of all households
Household received Food Stamps/SNAP in the past 12 months: 1,117 Household did not receive Food Stamps/SNAP in the past 12 months: 13,338
Women who had a birth in the past 12 months: 226 (156 now married, 69 unmarried) Women who did not have a birth in the past 12 months: 8,809 (3,835 now married, 4,961 unmarried)
Housing units in zip code 60031 with a mortgage: 7,516 (823 second mortgage, 682 both second mortgage and home equity loan) Houses without a mortgage: 92
Median monthly owner costs for units with a mortgage: $2,163 Median monthly owner costs for units without a mortgage: $1,028
Residents with income below the poverty level in 2022:
This zip code:
4.5%
Whole state:
11.9%
Residents with income below 50% of the poverty level in 2022:
This zip code:
2.1%
Whole state:
5.7%
Median number of rooms in houses and condos:
Here:
7.3
State:
6.4
Median number of rooms in apartments:
Here:
3.6
State:
4.1
Notable locations in this zip code not listed on our city pages
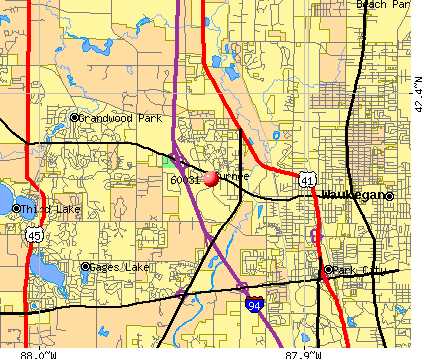
Notable locations in zip code 60031: Lambs Corners (A), Dillys Corners (B), Heather Ridge Golf Course (C), Grand Tri State Business Park (D), Gurnee Sewage Treatment Plant (E), Gurney Mills (F), Gurnee Village Hall (G), Warren - Newport Public Library (H), Gurnee Fire Department Station 2 (I), Gurnee Fire Department Station 1 (J). Display/hide their locations on the map
Parks in zip code 60031 include: Pembroke Community Park (1), Prairie Oaks Park (2), Gowe Park (3), Six Flags Great America (4), South Park (5), University Park (6), Woodlawn Park (7), Viking Park (8), River Hill Forest Preserve (9). Display/hide their locations on the map
5,814 married couples with children.
1,246 single-parent households (317 men, 929 women).
74.5% of residents of 60031 zip code speak English at home.
8.9% of residents speak Spanish at home (73% very well, 17% well, 9% not well).
9.3% of residents speak other Indo-European language at home (80% very well, 14% well, 4% not well, 1% not at all).
6.6% of residents speak Asian or Pacific Island language at home (72% very well, 20% well, 9% not well).
0.6% of residents speak other language at home (75% very well, 15% well, 10% not well).
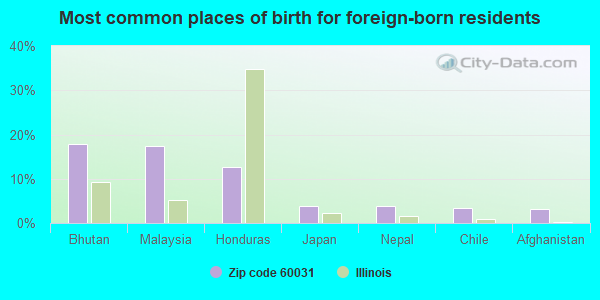
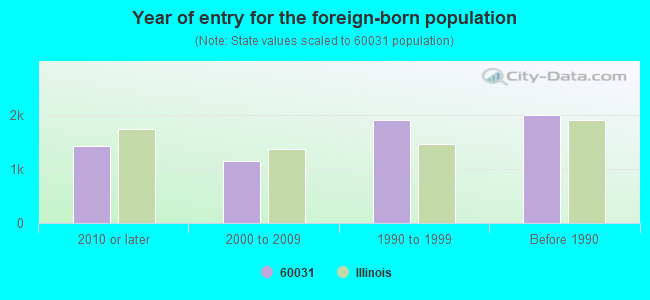
Foreign born population: 5,796 (15.8%) (74.2% of them are naturalized citizens)
Major facilities with environmental interests located in this zip code:
LAMBENT TECHNOLOGIES CORP. (3938 PORETT DRIVE in GURNEE, IL)
STATE MASTER (Illinois EPA Project) - SOLID WASTE PROGRAM, HAZARDOUS WASTE PROGRAM, AIR PROGRAM, National Pollutant Discharge Elimination System Permit AIR MAJOR (AIRS/AFS) COMPLIANCE ACTIVITY (Tracking inspections of insecticide, fungicide, and rodenticide, and toxic substances) CRITERIA AND HAZARDOUS AIR POLLUTANT INVENTORY (Inventory of air pollution sources) National Pollutant Discharge Elimination System NON-MAJOR (Tracking pollutant discharge elimination systems) - permit HAZARDOUS WASTE BIENNIAL REPORTER (Resource Conservation and Recovery Act (tracking hazardous waste)) Large Quantity Generators, more that 1000 kg of hazardous waste/month (Resource Conservation and Recovery Act (tracking hazardous waste)) - notification TRI REPORTER (Tracking of toxic chemicals releasing facilities) Business SIC classification: SURFACE ACTIVE AGENTS, FINISHING AGENTS, SULFONATED OILS, AND ASSISTANTS Business NAICS classification: SURFACE ACTIVE AGENT MANUFACTURING.; SURFACE ACTIVE AGENT MANUFACTURING. Organizations: LAMBERT TECH CORP (CONTACT/OPERATOR)
, PPG INDUSTRIES (CONTACT/OWNER)
, PETROFERM INC (CONTACT/OWNER)
Alternative names: BASF CORP, MAZER CHEMICALS, MAZER CHEMICALS DIVISION, PPG MAZER CHEMICALS
CIRQON TECHNOLOGIES CORP (1394 ST PAUL AVE in GURNEE, IL)
STATE MASTER (Illinois EPA Project) - SOLID WASTE PROGRAM, HAZARDOUS WASTE PROGRAM, AIR PROGRAM AIR MINOR (AIRS/AFS) CRITERIA AND HAZARDOUS AIR POLLUTANT INVENTORY (Inventory of air pollution sources) National Pollutant Discharge Elimination System NON-MAJOR (Tracking pollutant discharge elimination systems) - permit Large Quantity Generators, more that 1000 kg of hazardous waste/month (Resource Conservation and Recovery Act (tracking hazardous waste)) - notification HAZARDOUS WASTE BIENNIAL REPORTER (Resource Conservation and Recovery Act (tracking hazardous waste)) (Resource Conservation and Recovery Act (tracking hazardous waste)) Business SIC classification: ELECTRONIC COMPONENTS Organizations: LASERAGE TECHNOLOGY CORP (CONTACT/OWNER)
Alternative names: LASERAGE TECHNOLOGY CORP
NORTH SHORE SANITARY DISTRICT (WM. KOEPSEL DR in GURNEE, IL)
STATE MASTER (Illinois EPA Project) - SOLID WASTE PROGRAM, AIR PROGRAM AIR MINOR (AIRS/AFS) CRITERIA AND HAZARDOUS AIR POLLUTANT INVENTORY (Inventory of air pollution sources) National Pollutant Discharge Elimination System MAJOR (Tracking pollutant discharge elimination systems) - permit - ICIS-, ENFORCEMENT/COMPLIANCE ACTIVITY National Pollutant Discharge Elimination System NON-MAJOR (Tracking pollutant discharge elimination systems) - permit Small Quantity Generators, between 100 kg and 1000 kg of hazardous waste/month (Resource Conservation and Recovery Act (tracking hazardous waste)) Business SIC classification: SEWERAGE SYSTEMS Alternative names: NSSD-GURNEE STP
MANFREDI MOTOR TRANSIT CO INC (3870 CLEARVIEW CT in GURNEE, IL)
STATE MASTER (Illinois EPA Project) - SOLID WASTE PROGRAM, HAZARDOUS WASTE PROGRAM, National Pollutant Discharge Elimination System Permit National Pollutant Discharge Elimination System NON-MAJOR (Tracking pollutant discharge elimination systems) - permit Large Quantity Generators, more that 1000 kg of hazardous waste/month (Resource Conservation and Recovery Act (tracking hazardous waste)) - notification (Resource Conservation and Recovery Act (tracking hazardous waste)) Organizations: MANFREDI MOTOR TRANSIT COMPANY (CONTACT/OWNER)
ROQUETTE AMERICA INC (1550 NORTHWESTERN AVE. in GURNEE, IL)
STATE MASTER (Illinois EPA Project) - SOLID WASTE PROGRAM, HAZARDOUS WASTE PROGRAM, AIR PROGRAM, National Pollutant Discharge Elimination System Permit AIR MINOR (AIRS/AFS) CRITERIA AND HAZARDOUS AIR POLLUTANT INVENTORY (Inventory of air pollution sources) National Pollutant Discharge Elimination System NON-MAJOR (Tracking pollutant discharge elimination systems) - permit Small Quantity Generators, between 100 kg and 1000 kg of hazardous waste/month (Resource Conservation and Recovery Act (tracking hazardous waste)) - notification TRI REPORTER (Tracking of toxic chemicals releasing facilities) Business SIC classification: INDUSTRIAL ORGANIC CHEMICALS Organizations: ROQUETTE CORP (CONTACT/OWNER)
Alternative names: ROQUETTE CORP, ROQUETTE AMERICA INC., GURNEE PLANT
MIKE KALLAS (4005 PORETTE DR in GURNEE, IL)
STATE MASTER (Illinois EPA Project) - SOLID WASTE PROGRAM, HAZARDOUS WASTE PROGRAM, AIR PROGRAM AIR MINOR (AIRS/AFS) National Pollutant Discharge Elimination System NON-MAJOR (Tracking pollutant discharge elimination systems) - permit Small Quantity Generators, between 100 kg and 1000 kg of hazardous waste/month (Resource Conservation and Recovery Act (tracking hazardous waste)) - notification Business SIC classification: COURIER SERVICES, EXCEPT BY AIR Organizations: UNITED PARCEL SERVICE (CONTACT/OWNER)
, UNITED PARCEL (CONTACT/OWNER)
Alternative names: UNITED PARCEL SERVICE, UPS-GURNEE
NSSD GURNEE SEWAGE TREATMENT PLANT (RUSSELL ROAD in GURNEE, IL)
National Pollutant Discharge Elimination System NON-MAJOR (Tracking pollutant discharge elimination systems) - permit National Pollutant Discharge Elimination System NON-MAJOR (Tracking pollutant discharge elimination systems) - permit National Pollutant Discharge Elimination System NON-MAJOR (Tracking pollutant discharge elimination systems) - permit Organizations: NORTH SHORE SANITARY DISTRICT (CONTACT/OWNER)
Alternative names: CLAVEY RD SEWAGE TREATMENT PLT, WAUKEGAN SEWAGE TREATMENT PLNT
HOOVER MATERIALS HANDLING GROUP INC (2005 DELANY RD. in GURNEE, IL)
STATE MASTER (Illinois EPA Project) - SOLID WASTE PROGRAM, HAZARDOUS WASTE PROGRAM, AIR PROGRAM AIR MINOR (AIRS/AFS) Large Quantity Generators, more that 1000 kg of hazardous waste/month (Resource Conservation and Recovery Act (tracking hazardous waste)) - notification Business SIC classification: NONCLASSIFIABLE ESTABLISHMENTS Organizations: HOOVER MATERIALS HANDLING GRP INC (CONTACT/OWNER)
REFRACTORY TECHNOLOGY INC (3815 GRANDVILLE AVENUE in GURNEE, IL)
STATE MASTER (Illinois EPA Project) - AIR PROGRAM, National Pollutant Discharge Elimination System Permit AIR MINOR (AIRS/AFS) National Pollutant Discharge Elimination System NON-MAJOR (Tracking pollutant discharge elimination systems) - permit Business SIC classification: NONCLAY REFRACTORIES Organizations: REFRACTORY TECHNOLOGY INC. (CONTACT/OWNER)
PQ CORP (1945 DELANY ROAD in GURNEE, IL)
STATE MASTER (Illinois EPA Project) - SOLID WASTE PROGRAM, HAZARDOUS WASTE PROGRAM, AIR PROGRAM, National Pollutant Discharge Elimination System Permit AIR MAJOR (AIRS/AFS) CRITERIA AND HAZARDOUS AIR POLLUTANT INVENTORY (Inventory of air pollution sources) AIR MAJOR ("Best Available" air pollution technologies tracking) Conditionally Exempt Small Quantity Generators, less than 100 kg/month of hazardous waste (Resource Conservation and Recovery Act (tracking hazardous waste)) - notification TRI REPORTER (Tracking of toxic chemicals releasing facilities) Business SIC classification: INDUSTRIAL INORGANIC CHEMICALS Organizations: THE PQ CORPORATION (CONTACT/OWNER)
Alternative names: PQ CORP. - GURNEE, THE PQ CORPORATION GURNEE PLANT, PQ CORPORATION
ILLINOIS TOLLWAY (RTE 132 AND TRI STSTE I294 in GURNEE, IL)
STATE MASTER (Illinois EPA Project) - SOLID WASTE PROGRAM, HAZARDOUS WASTE PROGRAM, AIR PROGRAM AIR MINOR (AIRS/AFS) CRITERIA AND HAZARDOUS AIR POLLUTANT INVENTORY (Inventory of air pollution sources) Small Quantity Generators, between 100 kg and 1000 kg of hazardous waste/month (Resource Conservation and Recovery Act (tracking hazardous waste)) - notification Business SIC classification: REGULATION AND ADMINISTRATION OF TRANSPORTATION PROGRAMS Organizations: IL TOLLWAY AUTHORITY (CONTACT/OWNER)
Alternative names: ILLINOIS STATE TOLL HIGHWAY AUTHORITY, ILLINOIS TOLLWAY MAINT BLDG 4
KAHLE CHEMICAL CORP (4250 LEE AVENUE in GURNEE, IL)
STATE MASTER (Illinois EPA Project) - HAZARDOUS WASTE PROGRAM, AIR PROGRAM AIR MINOR (AIRS/AFS) Small Quantity Generators, between 100 kg and 1000 kg of hazardous waste/month (Resource Conservation and Recovery Act (tracking hazardous waste)) - notification Business SIC classification: MEDICINAL CHEMICALS AND BOTANICAL PRODUCTS Organizations: KAHLE VIVINNE P (CONTACT/OWNER)
NOSCO INC (2199 DELANY ROAD in GURNEE, IL)
STATE MASTER (Illinois EPA Project) - SOLID WASTE PROGRAM, HAZARDOUS WASTE PROGRAM, AIR PROGRAM AIR MINOR (AIRS/AFS) CRITERIA AND HAZARDOUS AIR POLLUTANT INVENTORY (Inventory of air pollution sources) Small Quantity Generators, between 100 kg and 1000 kg of hazardous waste/month (Resource Conservation and Recovery Act (tracking hazardous waste)) - notification Business SIC classification: COMMERCIAL PRINTING, LITHOGRAPHIC
Housing units lacking complete plumbing facilities: 0.1% Housing units lacking complete kitchen facilities: 1.7%
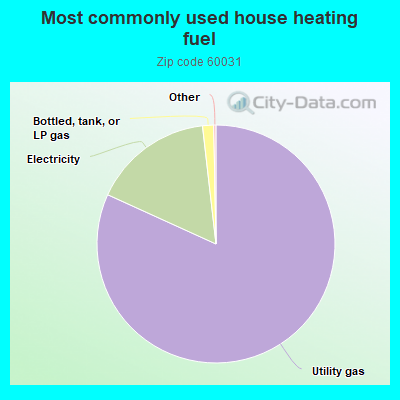
81.8%Utility gas
16.4%Electricity
1.5%Bottled, tank, or LP gas
Population in 1990: 32,114. Population change in the 1990s: +5,347 (+16.7%).
Place of birth for U.S.-born residents:
This state: 22,616
Northeast: 1,313
Midwest: 3,508
South: 1,768
West: 1,005
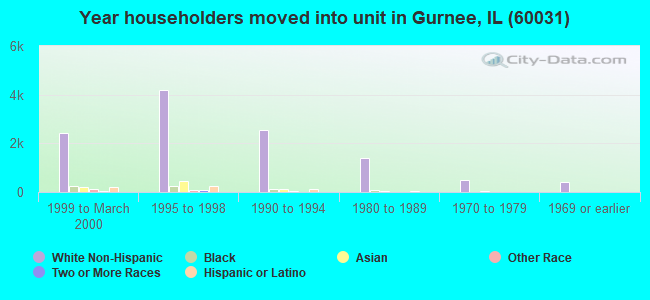
47% of the 60031 zip code residents lived in the same house 5 years ago. Out of people who lived in different houses, 51% lived in this county. Out of people who lived in different counties, 50% lived in Illinois.
89% of the 60031 zip code residents lived in the same house 1 year ago. Out of people who lived in different houses, 52% moved from this county. Out of people who lived in different houses, 22% moved from different county within same state. Out of people who lived in different houses, 21% moved from different state. Out of people who lived in different houses, 6% moved from abroad.
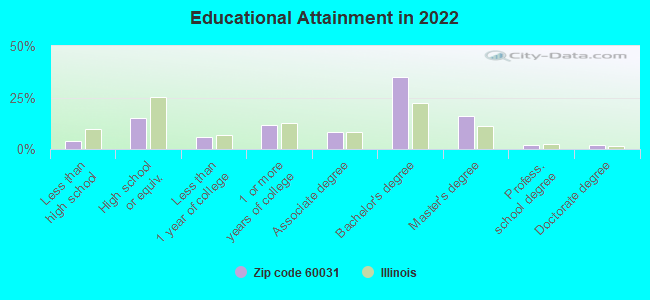
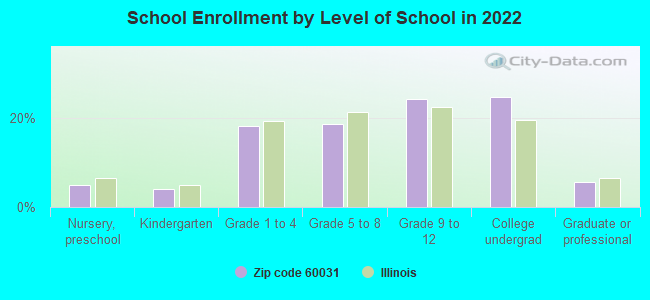
Private vs. public school enrollment:
Students in private schools in grades 1 to 8 (elementary and middle school): 277
Here:
8.1%
Illinois:
13.3%
Students in private schools in grades 9 to 12 (high school): 259
Here:
11.5%
Illinois:
9.9%
Students in private undergraduate colleges: 701
Here:
30.6%
Illinois:
27.4%
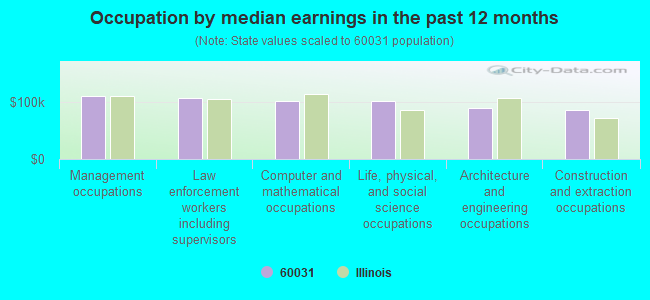
Occupation by median earnings in the past 12 months ($)
110,612Management occupations
106,710Law enforcement workers including supervisors
102,234Computer and mathematical occupations
100,919Life, physical, and social science occupations
89,856Architecture and engineering occupations
84,883Construction and extraction occupations
Companies with biggest federal contracts located in this zip code (GURNEE, IL):
JOSEPH J HENDERSON & SON INC (4288 OLD GRAND AVE) : $100,355,422 in 45 contractsfrom 1999 to 2006
Contracts for Construction of Structures and Facilities -- Family Housing Facilities, Maintenance, Repair or Alteration of Real Property -- Family Housing Facilities, Construction of Structures and Facilities -- Other Industrial Buildings, Construction of Structures and Facilities -- Other Utilities, and moreby Army, Navy Signed by year:2000: $39,678,224; 2001: $14,220,117; 2002: $11,959,464; 2003: $378,960; 2004: -$80,764; 2005: $28,793,000; 2006: $5,400,621.
Biggest contracts:
$28,793,000 with Army for Construction of Structures and Facilities -- Family Housing Facilities. Taking place in MT. Signed on 2005-09-28. Completion date: 2007-10-15.
$25,129,000 with Navy for Maintenance, Repair or Alteration of Real Property -- Family Housing Facilities. Signed on 2000-06-29. Completion date: 2003-08-13.
$12,744,000, same as above.Signed on 2001-05-16. Completion date: 2004-07-15.
$12,413,000 with Navy for Construction of Structures and Facilities -- Other Industrial Buildings. Signed on 2000-06-30. Completion date: 2001-09-23.
TUXCO CORP (4300 GROVE AVE; small business) : $912,154 in 33 contractsfrom 1999 to 2006
Contracts for Motor Vehicle Maintenance and Repair Shop Specialized Equipment, Miscellaneous Maintenance and Repair Shop Specialized Equipment, Manual Presses, Miscellaneous Machine Tools, and moreby Defense Logistics Agency, Army, Navy Signed by year:2000: $0; 2001: $67,663; 2002: $242,656; 2003: $138,030; 2004: $138,150; 2005: $153,003; 2006: $121,124.
Biggest contracts:
$95,243 with Defense Logistics Agency for Motor Vehicle Maintenance and Repair Shop Specialized Equipment. Signed on 2003-11-24. Completion date: 2004-02-22.
$91,488, same as above.Signed on 2002-01-10. Completion date: 2002-04-25.
$67,663, same as above.Signed on 2001-05-25. Completion date: 2001-09-22.
$65,940, same as above.Signed on 2002-09-13. Completion date: 2003-01-11.
GURNEE RADIOLOGY CENTER (25 TOWER CT SUITE A; small business) : $590,900 in 7 contractsfrom 2000 to 2004
Contracts for Radiology Services by Navy, Department of Veterans Affairs Signed by year:2000: $74,100; 2001: $185,250; 2002: $0; 2003: $195,700; 2004: $135,850; 2005: $0; 2006: $0.
Biggest contracts:
$148,200 with Navy for Radiology Services. Signed on 2003-10-01. Completion date: 2004-09-30.
$148,200, same as above.Signed on 2001-10-01. Completion date: 2002-09-30.
$135,850, same as above.Signed on 2004-10-01. Completion date: 2005-09-30.
$74,100, same as above.Signed on 2000-12-21. Completion date: 2001-09-30.
ROBERT L JUCOVICS DENTAL (JD (4451 CORNELL AVE; small business) : $471,591 in 7 contractsfrom 2000 to 2005
Contracts for Dentistry Services by Navy Signed by year:2000: $77,501; 2001: $0; 2002: $83,332; 2003: $86,586; 2004: $70,452; 2005: $153,720; 2006: $0.
Biggest contracts:
$126,880 with Navy for Dentistry Services. Signed on 2005-10-21. Completion date: 2005-09-30.
$86,586, same as above.Signed on 2003-10-01. Completion date: 2004-09-30.
$83,332, same as above.Signed on 2002-10-01. Completion date: 2003-09-30.
$77,501, same as above.Signed on 2000-10-01. Completion date: 2001-09-30.
JANINE TALLAT KELPSA DDS (34136 N HOMESTEAD RD; small business) : $256,511 in 7 contractsfrom 2000 to 2004
Contracts for Dentistry Services by Navy Signed by year:2000: $151,606; 2001: $0; 2002: $82,163; 2003: $85,119; 2004: -$62,377; 2005: $0; 2006: $0.
Biggest contracts:
$85,119 with Navy for Dentistry Services. Signed on 2003-10-01. Completion date: 2004-09-30.
$82,163, same as above.Signed on 2002-10-01. Completion date: 2003-09-30.
$76,856, same as above.Signed on 2000-10-01. Completion date: 2001-09-30.
$74,750, same as above.Signed on 2000-02-16. Completion date: 2000-09-30.
JACQUELINE R CLARK (1098 N FULLER RD; small business) : $244,875 in 6 contractsfrom 1999 to 2004
Contracts for Other Social Services, Social Rehabilitation Services by Navy Signed by year:2000: $32,075; 2001: $42,700; 2002: $43,200; 2003: $43,900; 2004: $43,000; 2005: $0; 2006: $0.
Biggest contracts:
$43,900 with Navy for Other Social Services. Signed on 2003-10-01. Completion date: 2004-09-30.
$43,200, same as above.Signed on 2002-10-01. Completion date: 2003-09-30.
$43,000 with Navy for Social Rehabilitation Services. Signed on 2004-10-01. Completion date: 2005-09-30.
$42,700 with Navy for Other Social Services. Signed on 2001-10-01. Completion date: 2002-09-30.
L B CARPETS OF IL (1820 DELANY ROAD # 510; small business) : $229,234 in 7 contractsfrom 2000 to 2001
Contracts for Maintenance, Repair or Alteration of Real Property -- Office Buildings, Floor Coverings, Maintenance, Repair and Rebuilding of Equipment -- Household and Commercial Furnishings and Appliances, Installation of Equipment -- Household and Commercial Furnishings and Appliances by Army, Air Force, Navy Signed by year:2000: $153,629; 2001: $75,605; 2002: $0; 2003: $0; 2004: $0; 2005: $0; 2006: $0.
Biggest contracts:
$71,478 with Army for Maintenance, Repair or Alteration of Real Property -- Office Buildings. Taking place in PA. Signed on 2000-02-14. Completion date: 2000-04-28.
$48,381 with Air Force for Floor Coverings. Signed on 2000-09-27. Completion date: 2000-10-20.
$47,605 with Navy for Maintenance, Repair and Rebuilding of Equipment -- Household and Commercial Furnishings and Appliances. Signed on 2001-05-10. Completion date: 2001-07-31.
$31,416 with Army for Installation of Equipment -- Household and Commercial Furnishings and Appliances. Signed on 2000-05-19. Completion date: 2000-06-19.
LIFTEX CORPORATION (4155 GROVE AVENUE; small business) : $216,940 in 12 contractsfrom 2003 to 2006
Contracts for Parachutes; Aerial Pick Up, Delivery, Recovery Systems; and Cargo Tie Down Equipment, Guided Missile Maintenance, Repair, and Checkout Specialized Equipment by Army, Navy, Defense Logistics Agency Signed by year:2000: $0; 2001: $0; 2002: $0; 2003: $115,314; 2004: $29,195; 2005: $0; 2006: $72,431.
Biggest contracts:
$73,125 with Army for Parachutes; Aerial Pick Up, Delivery, Recovery Systems; and Cargo Tie Down Equipment. Signed on 2003-09-10. Completion date: 2004-02-27.
$68,765, same as above.Signed on 2006-01-11. Completion date: 2011-07-28.
$16,517, same as above.Signed on 2003-08-15. Completion date: 2003-12-31.
$13,417 with Navy for Guided Missile Maintenance, Repair, and Checkout Specialized Equipment. Signed on 2004-11-05. Completion date: 2005-01-04.
JAMES AUSBROOKS (3438 GRANDVILLE AVENUE; small business) : $204,504 in 6 contractsfrom 2000 to 2005
Contracts for Dentistry Services by Navy Signed by year:2000: $59,392; 2001: $0; 2002: $35,496; 2003: $36,156; 2004: $36,540; 2005: $36,920; 2006: $0.
Biggest contracts:
$36,920 with Navy for Dentistry Services. Signed on 2005-10-21. Completion date: 2005-09-30.
$36,540, same as above.Signed on 2004-10-01. Completion date: 2005-09-30.
$36,156, same as above.Signed on 2003-10-01. Completion date: 2004-09-30.
$35,496, same as above.Signed on 2002-10-28. Completion date: 2003-09-30.
PETROFERM INC (3938 PORETT DR; small business) : $184,685 in 13 contractsfrom 2001 to 2006
Contracts for Cleaning and Polishing Compounds and Preparations, Miscellaneous Chemical Specialties, Miscellaneous Special Industry Machinery by Army, Air Force, Navy Signed by year:2000: $0; 2001: $34,400; 2002: $42,240; 2003: $0; 2004: $0; 2005: $43,878; 2006: $64,167.
Biggest contracts:
$42,240 with Army for Cleaning and Polishing Compounds and Preparations. Taking place in FL. Signed on 2002-11-15. Completion date: 2002-11-27.
$34,400, same as above.Signed on 2001-02-09. Completion date: 2001-02-27.
$21,096 with Air Force for Miscellaneous Chemical Specialties. Taking place in FL. Signed on 2006-04-18. Completion date: 2006-05-02.
$21,096, same as above.Signed on 2005-09-06. Completion date: 2005-09-29.
Top industries in this zip code by the number of employees in 2005:
2002 - 2018 National Fire Incident Reporting System (NFIRS) incidents
Based on the data from the years 2002 - 2018 the average number of fire incidents per year is 92. The highest number of reported fire incidents - 171 took place in 2003, and the least - 59 in 2015. The data has a decreasing trend.
When looking into fire subcategories, the most incidents belonged to: Structure Fires (46.1%), and Outside Fires (30.4%).
Fire incident types reported to NFIRS in Zip Code 60031


 Nearest zip codes: 60083, 60085, 60048, 60087, 60064, 60030.


 Based on the data from the years 2002 - 2018 the average number of fire incidents per year is 92. The highest number of reported fire incidents - 171 took place in 2003, and the least - 59 in 2015. The data has a decreasing trend.
 When looking into fire subcategories, the most incidents belonged to: Structure Fires (46.1%), and Outside Fires (30.4%).