Estimated zip code population in 2022: 2,032 Zip code population in 2010: 2,040 Zip code population in 2000: 1,896
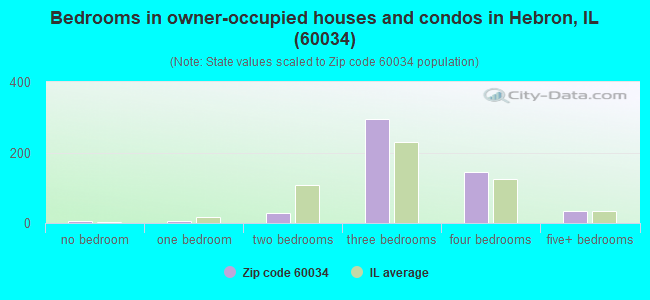
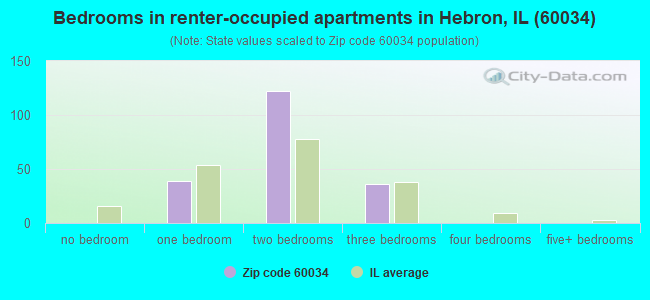
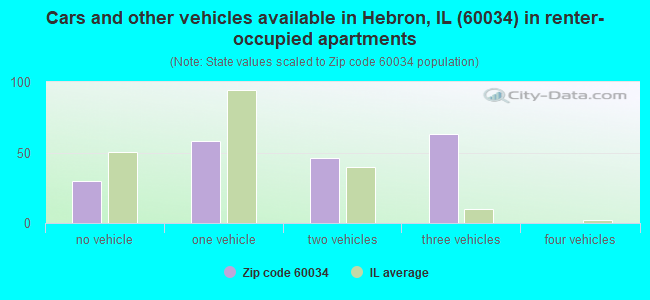
Houses and condos: 757 Renter-occupied apartments: 197
% of renters here:
28%
State:
33%
March 2022 cost of living index in zip code 60034: 93.9 (less than average, U.S. average is 100)
Land area: 26.0 sq. mi. Water area: 0.0 sq. mi.
Population density: 78 people per square mile
(very low).
OSM Map
General Map
Google Map
MSN Map
OSM Map
General Map
Google Map
MSN Map
OSM Map
General Map
Google Map
MSN Map
OSM Map
General Map
Google Map
MSN Map
Please wait while loading the map...
Real estate property taxes paid for housing units in 2022:
This zip code:
1.9% ($4,797)
Illinois:
2.0% ($4,912)
Median real estate property taxes paid for housing units with mortgages in 2022: $4,769 (1.8%) Median real estate property taxes paid for housing units with no mortgage in 2022: $4,834 (2.3%)
Business Search- 14 Million verified businesses
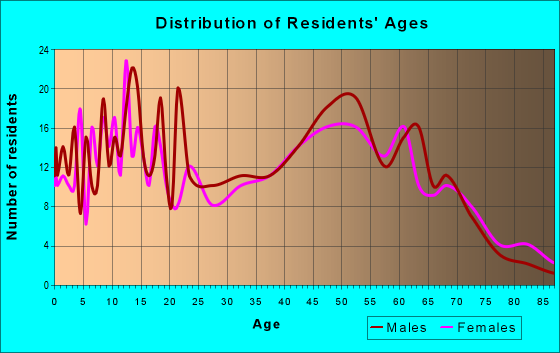
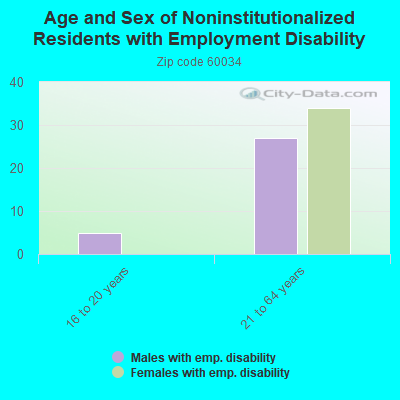
Males: 961
(47.3%)
Females: 1,071
(52.7%)
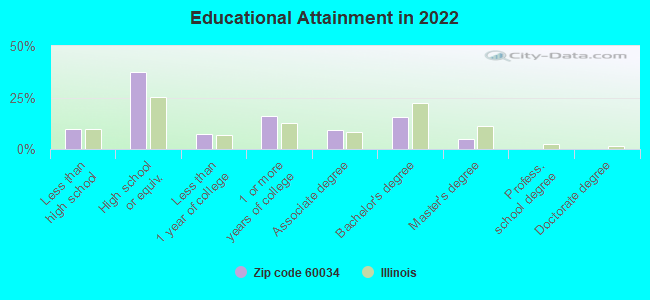
For population 25 years and over in 60034:
High school or higher: 89.3%
Bachelor's degree or higher: 20.6%
Graduate or professional degree: 5.1%
Unemployed: 2.1%
Mean travel time to work (commute): 31.5 minutes
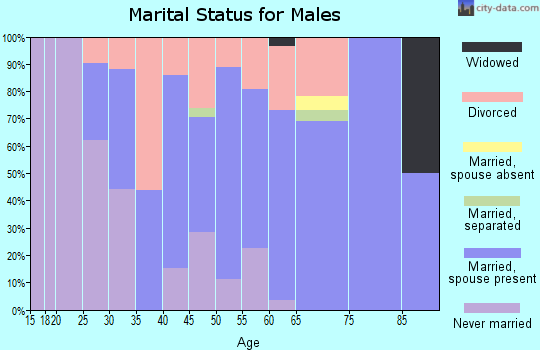
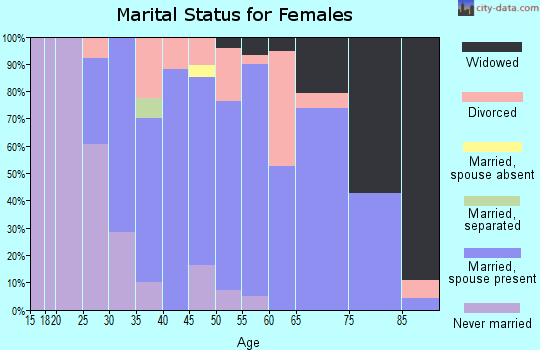
For population 15 years and over in 60034:
Never married: 33.2%
Now married: 49.6%
Separated: 0.8%
Widowed: 3.9%
Divorced: 12.5%
Zip code 60034 compared to state average:
Unemployed percentage below state average.
Black race population percentage significantly below state average.
Foreign-born population percentage significantly below state average.
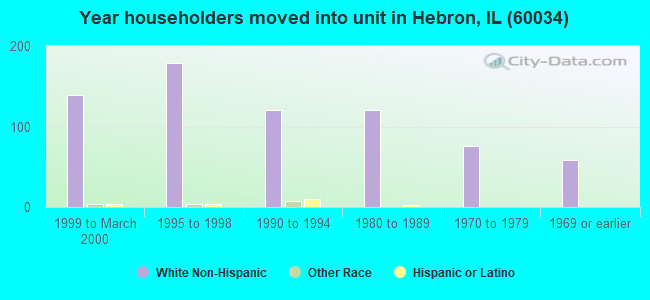
Length of stay since moving in above state average.
Percentage of population with a bachelor's degree or higher below state average.
Averages for the 2020 tax year for zip code 60034, filed in 2021:
Average Adjusted Gross Income (AGI) in 2020: $57,815 (Individual Income Tax Returns)
Here:
$57,815
State:
$82,626
Salary/wage: $52,225 (reported on 83.7% of returns)
Here:
$52,225
State:
$66,640
(% of AGI for various income ranges: 1117.7% for AGIs below $25k, 3398.6% for AGIs $25k-50k, 6645.0% for AGIs $50k-75k, 9343.3% for AGIs $75k-100k, 19117.0% for AGIs $100k-200k)
Taxable interest for individuals: $600 (reported on 28.8% of returns)
This zip code:
$600
Illinois:
$2,376
(% of AGI for various income ranges: 13.6% for AGIs below $25k, 33.2% for AGIs $25k-50k, 15.8% for AGIs $50k-75k, 7.8% for AGIs $75k-100k, 51.0% for AGIs $100k-200k)
Ordinary dividends: $2,465 (reported on 16.3% of returns)
Here:
$2,465
State:
$9,061
(% of AGI for various income ranges: 13.6% for AGIs below $25k, 50.5% for AGIs $25k-50k, 50.8% for AGIs $50k-75k, 28.9% for AGIs $75k-100k, 191.0% for AGIs $100k-200k)
Net capital gain/loss in AGI: +$4,040 (reported on 14.4% of returns)
Here:
+$4,040
State:
+$31,684
(% of AGI for various income ranges: 7.7% for AGIs below $25k, 34.5% for AGIs $25k-50k, 65.8% for AGIs $50k-75k, 16.7% for AGIs $75k-100k, 419.0% for AGIs $100k-200k)
Profit/loss from business: +$3,531 (reported on 15.4% of returns)
Here:
+$3,531
State:
+$12,175
(% of AGI for various income ranges: 51.8% for AGIs below $25k, 95.5% for AGIs $25k-50k, 221.7% for AGIs $50k-75k)
Taxable individual retirement arrangement distribution: $17,810 (reported on 9.6% of returns)
60034:
$17,810
Illinois:
$21,613
(% of AGI for various income ranges: 81.8% for AGIs below $25k, 103.6% for AGIs $25k-50k, 526.7% for AGIs $50k-75k, 741.0% for AGIs $100k-200k)
Total itemized deductions: $28,680 (reported on 4.8% of returns)
Here:
$28,680
State:
$34,948
(% of AGI for various income ranges: 568.3% for AGIs $50k-75k, 752.0% for AGIs $100k-200k)
Charity contributions: $7,433 (reported on 2.9% of returns)
Here:
$7,433
State:
$13,122
(% of AGI for various income ranges: 247.8% for AGIs $75k-100k)
Taxes paid: $8,460 (reported on 4.8% of returns)
60034:
$8,460
State:
$8,563
(% of AGI for various income ranges: 190.0% for AGIs $50k-75k, 195.0% for AGIs $100k-200k)
Earned income credit: $2,175 (reported on 11.5% of returns)
Here:
$2,175
State:
$2,311
(% of AGI for various income ranges: 58.2% for AGIs below $25k, 60.5% for AGIs $25k-50k)
Percentage of individuals using paid preparers for their 2020 taxes: 92.3%
Here:
92%
State:
93%
(% for various income ranges: 87.1% for AGIs below $25k, 92.6% for AGIs $25k-50k, 94.1% for AGIs $50k-75k, 100.0% for AGIs $75k-100k, 94.1% for AGIs $100k-200k)
Averages for the 2012 tax year for zip code 60034, filed in 2013:
Average Adjusted Gross Income (AGI) in 2012: $50,991 (Individual Income Tax Returns)
Here:
$50,991
State:
$68,058
Salary/wage: $41,504 (reported on 83.5% of returns)
Here:
$41,504
State:
$55,396
(% of AGI for various income ranges: 69.8% for AGIs below $25k, 79.4% for AGIs $25k-50k, 74.3% for AGIs $50k-75k, 75.9% for AGIs $75k-100k, 54.9% for AGIs $100k-200k)
Taxable interest for individuals: $694 (reported on 33.0% of returns)
This zip code:
$694
Illinois:
$1,969
(% of AGI for various income ranges: 1.0% for AGIs below $25k, 1.0% for AGIs $25k-50k, 0.4% for AGIs $50k-75k, 0.2% for AGIs $75k-100k, 0.2% for AGIs $100k-200k)
Ordinary dividends: $5,215 (reported on 20.6% of returns)
Here:
$5,215
State:
$7,786
(% of AGI for various income ranges: 1.0% for AGIs below $25k, 0.5% for AGIs $25k-50k, 1.1% for AGIs $50k-75k, 1.0% for AGIs $75k-100k, 4.2% for AGIs $100k-200k)
Net capital gain/loss in AGI: +$2,350 (reported on 14.4% of returns)
Here:
+$2,350
State:
+$22,183
(% of AGI for various income ranges: 0.3% for AGIs $50k-75k, 1.2% for AGIs $75k-100k, 1.1% for AGIs $100k-200k)
Profit/loss from business: +$8,127 (reported on 15.5% of returns)
Here:
+$8,127
State:
+$12,903
(% of AGI for various income ranges: 7.7% for AGIs below $25k, 4.1% for AGIs $25k-50k, 1.1% for AGIs $50k-75k, 4.7% for AGIs $75k-100k)
Taxable individual retirement arrangement distribution: $11,800 (reported on 13.4% of returns)
60034:
$11,800
Illinois:
$17,929
(% of AGI for various income ranges: 5.1% for AGIs below $25k, 4.3% for AGIs $25k-50k, 4.5% for AGIs $50k-75k, 2.8% for AGIs $100k-200k)
Total itemized deductions: $19,167 (23% of AGI, reported on 37.1% of returns)
Here:
$19,167
State:
$26,433
Here:
22.7% of AGI
State:
19.2% of AGI
(% of AGI for various income ranges: 17.5% for AGIs below $25k, 11.9% for AGIs $25k-50k, 14.8% for AGIs $50k-75k, 17.3% for AGIs $75k-100k, 12.0% for AGIs $100k-200k)
Charity contributions: $2,044 (reported on 27.8% of returns)
Here:
$2,044
State:
$4,525
(% of AGI for various income ranges: 0.7% for AGIs below $25k, 0.5% for AGIs $25k-50k, 1.0% for AGIs $50k-75k, 1.4% for AGIs $75k-100k, 1.4% for AGIs $100k-200k)
Taxes paid: $8,391 (reported on 36.1% of returns)
60034:
$8,391
State:
$11,968
(% of AGI for various income ranges: 5.0% for AGIs below $25k, 4.2% for AGIs $25k-50k, 5.4% for AGIs $50k-75k, 7.2% for AGIs $75k-100k, 6.6% for AGIs $100k-200k)
Earned income credit: $2,167 (reported on 15.5% of returns)
Here:
$2,167
State:
$2,349
(% of AGI for various income ranges: 4.9% for AGIs below $25k, 1.2% for AGIs $25k-50k)
Percentage of individuals using paid preparers for their 2012 taxes: 56.7%
Here:
57%
State:
57%
(% for various income ranges: 47.4% for AGIs below $25k, 58.3% for AGIs $25k-50k, 66.7% for AGIs $50k-75k, 70.0% for AGIs $75k-100k, 60.0% for AGIs $100k-200k)
Averages for the 2004 tax year for zip code 60034, filed in 2005:
Average Adjusted Gross Income (AGI) in 2004: $51,037 (Individual Income Tax Returns)
Here:
$51,037
State:
$54,625
Salary/wage: $45,869 (reported on 84.1% of returns)
Here:
$45,869
State:
$46,811
(% of AGI for various income ranges: 90.2% for AGIs below $10k, 66.0% for AGIs $10k-25k, 78.5% for AGIs $25k-50k, 83.8% for AGIs $50k-75k, 87.2% for AGIs $75k-100k, 59.9% for AGIs over 100k)
Taxable interest for individuals: $1,668 (reported on 55.6% of returns)
This zip code:
$1,668
Illinois:
$2,101
(% of AGI for various income ranges: 4.3% for AGIs below $10k, 5.1% for AGIs $10k-25k, 2.6% for AGIs $25k-50k, 1.1% for AGIs $50k-75k, 0.7% for AGIs $75k-100k, 1.7% for AGIs over 100k)
Taxable dividends: $1,460 (reported on 28.3% of returns)
Here:
$1,460
State:
$4,306
(% of AGI for various income ranges: 2.2% for AGIs below $10k, 2.5% for AGIs $10k-25k, 1.0% for AGIs $25k-50k, 1.1% for AGIs $50k-75k, 0.2% for AGIs $75k-100k, 0.4% for AGIs over 100k)
Net capital gain/loss: +$11,883 (reported on 19.5% of returns)
Here:
+$11,883
State:
+$17,321
(% of AGI for various income ranges: 0.3% for AGIs $10k-25k, 0.0% for AGIs $25k-50k, 1.0% for AGIs $50k-75k, 0.4% for AGIs $75k-100k, 15.7% for AGIs over 100k)
Profit/loss from business: +$6,712 (reported on 18.5% of returns)
Here:
+$6,712
State:
+$11,771
(% of AGI for various income ranges: 13.0% for AGIs $10k-25k, 4.2% for AGIs $25k-50k, 2.6% for AGIs $50k-75k, -0.5% for AGIs $75k-100k, -0.1% for AGIs over 100k)
IRA payment deduction: $2,227 (reported on 2.8% of returns)
60034:
$2,227
Illinois:
$3,087
Total itemized deductions: $16,341 (23% of AGI, reported on 46.6% of returns)
Here:
$16,341
State:
$20,239
Here:
23.2% of AGI
State:
19.5% of AGI
(% of AGI for various income ranges: 19.0% for AGIs $10k-25k, 13.4% for AGIs $25k-50k, 18.1% for AGIs $50k-75k, 17.1% for AGIs $75k-100k, 10.8% for AGIs over 100k)
Charity contributions deductions: $1,837 (3% of AGI, reported on 40.3% of returns)
Here:
$1,837
State:
$3,719
Here:
2.5% of AGI
State:
3.4% of AGI
(% of AGI for various income ranges: 1.1% for AGIs $10k-25k, 1.1% for AGIs $25k-50k, 1.6% for AGIs $50k-75k, 2.2% for AGIs $75k-100k, 1.2% for AGIs over 100k)
Total tax: $6,150 (reported on 84.2% of returns)
60034:
$6,150
State:
$9,882
(% of AGI for various income ranges: 3.3% for AGIs below $10k, 5.6% for AGIs $10k-25k, 7.2% for AGIs $25k-50k, 8.0% for AGIs $50k-75k, 9.9% for AGIs $75k-100k, 16.0% for AGIs over 100k)
Earned income credit: $1,435 (reported on 8.7% of returns)
Here:
$1,435
State:
$1,788
Percentage of individuals using paid preparers for their 2004 taxes: 63.7%
Here:
64%
State:
61%
(% for various income ranges: 32.3% for AGIs below $10k, 61.3% for AGIs $10k-25k, 66.4% for AGIs $25k-50k, 72.3% for AGIs $50k-75k, 66.3% for AGIs $75k-100k, 67.2% for AGIs over 100k)
Household received Food Stamps/SNAP in the past 12 months: 104 Household did not receive Food Stamps/SNAP in the past 12 months: 606
Women who had a birth in the past 12 months: 23 (23 now married, 0 unmarried) Women who did not have a birth in the past 12 months: 427 (128 now married, 300 unmarried)
Housing units in zip code 60034 with a mortgage: 334 (41 second mortgage, 2 home equity loan, 35 both second mortgage and home equity loan) Median monthly owner costs for units with a mortgage: $1,755 Median monthly owner costs for units without a mortgage: $860
Residents with income below the poverty level in 2022:
This zip code:
8.1%
Whole state:
11.9%
Residents with income below 50% of the poverty level in 2022:
This zip code:
4.5%
Whole state:
5.7%
Median number of rooms in houses and condos:
Here:
6.4
State:
6.4
Median number of rooms in apartments:
Here:
4.6
State:
4.1
Notable locations in this zip code not listed on our city pages
In group quarters: 15 (-1 institutionalized population)
Size of family households: 201 2-persons, 106 3-persons, 78 4-persons, 146 5-persons, 11 6-persons, 2 7-or-more-persons
Size of nonfamily households: 141 1-person, 9 2-persons
262 married couples with children.
162 single-parent households (58 men, 104 women).
91.1% of residents of 60034 zip code speak English at home.
6.7% of residents speak Spanish at home (76% very well, 19% well, 5% not well).
1.5% of residents speak other Indo-European language at home (83% very well, 17% well).
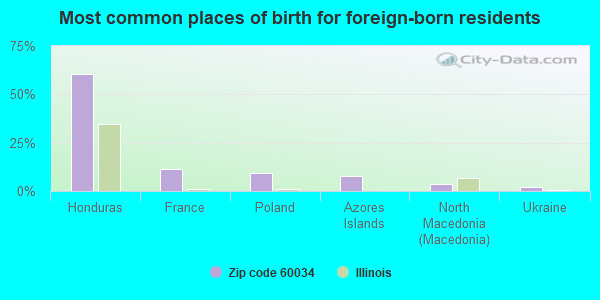
Foreign born population: 53 (2.6%) (51.2% of them are naturalized citizens)
This zip code:
2.6%
Whole state:
14.4%
60%Honduras
11%France
9%Poland
8%Azores Islands
4%North Macedonia (Macedonia)
2%Ukraine
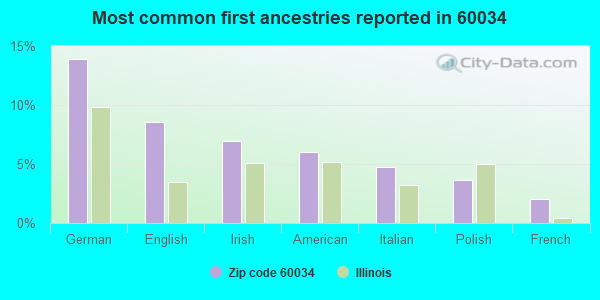
14%German
9%English
7%Irish
6%American
5%Italian
4%Polish
2%French
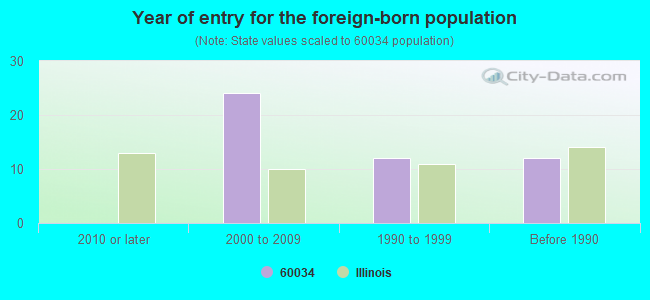
Year of entry for the foreign-born population
02010 or later
242000 to 2009
121990 to 1999
12Before 1990
Major facilities with environmental interests located in this zip code:
ALDEN/HEBRON HIGH SCH DIST 19 (9604 ILLINOIS ST in HEBRON, IL)
STATE MASTER (Illinois EPA Project) - SOLID WASTE PROGRAM (Geographic Names Information System) (National Center for Education Statistics) - STATE ID-4406301900002 Organizations: ALDEN HEBRON SCHOOL DIST 19 (SCHOOL DISTRICT)
LABEL GRAPHICS (12024 3RD AVE in HEBRON, IL)
STATE MASTER (Illinois EPA Project) - HAZARDOUS WASTE PROGRAM (Integrated Compliance Information System) - ICIS-05-2004-0049, FORMAL ENFORCEMENT ACTION COMPLIANCE ACTIVITY (Tracking inspections of insecticide, fungicide, and rodenticide, and toxic substances)
LYN PRODUCTS INC (12120 RTE 173 in HEBRON, IL)
STATE MASTER (Illinois EPA Project) - AIR PROGRAM AIR MINOR (AIRS/AFS) SUPERFUND (Superfund database) (Resource Conservation and Recovery Act (tracking hazardous waste)) Business SIC classification: CUTTING TOOLS, MACHINE TOOL ACCESSORIES, AND MACHINISTS' PRECISION MEASURING DEVICES Organizations: ELLISON INVESTMENTS (CONTACT/OWNER)
Alternative names: HEBRON PLATING, HEBRON PLATING AND MFG INC
ALDEN/HEBRON ELEM SCH DIST 19 (11915 PRICE RD in HEBRON, IL)
STATE MASTER (Illinois EPA Project) - SOLID WASTE PROGRAM (National Center for Education Statistics) - STATE ID-4406301902001 Organizations: ALDEN HEBRON SCHOOL DIST 19 (SCHOOL DISTRICT)
KEYSTONE DISPLAY INC (11916 MAPLE AVENUE in HEBRON, IL)
STATE MASTER (Illinois EPA Project) - HAZARDOUS WASTE PROGRAM, AIR PROGRAM AIR MINOR (AIRS/AFS) CRITERIA AND HAZARDOUS AIR POLLUTANT INVENTORY (Inventory of air pollution sources) Small Quantity Generators, between 100 kg and 1000 kg of hazardous waste/month (Resource Conservation and Recovery Act (tracking hazardous waste)) - notification Business SIC classification: OFFICE AND STORE FIXTURES, PARTITIONS, SHELVING, AND LOCKERS, EXCEPT WOOD; SIGNS AND ADVERTISING SPECIALTIES Organizations: CROWN INDUSTRIAL PRODUCTS CO (CONTACT/OWNER)
ARROW PRODUCTS INC (12007 MEAD AVE in HEBRON, IL)
STATE MASTER (Illinois EPA Project) - HAZARDOUS WASTE PROGRAM (Resource Conservation and Recovery Act (tracking hazardous waste)) Organizations: MANCINI CARL (CONTACT/OWNER)
KENOSHA BEEF INTERNATIONAL (12130 ST. RTE. 173 in HEBRON, IL)
STATE MASTER (Illinois EPA Project) - AIR PROGRAM AIR MINOR (AIRS/AFS) TRI REPORTER (Tracking of toxic chemicals releasing facilities) Business SIC classification: MEAT PACKING PLANTS
LINDEN LAKES SAND & GRAVEL - TONYAN BROS (IL ROUTE 173 in HEBRON, IL)
STATE MASTER (Illinois EPA Project) - AIR PROGRAM AIR MINOR (AIRS/AFS) CRITERIA AND HAZARDOUS AIR POLLUTANT INVENTORY (Inventory of air pollution sources) Business SIC classification: CONSTRUCTION SAND AND GRAVEL
NICOR GAS (RT. 173, 2 MILES E OF HEBRON in HEBRON, IL)
STATE MASTER (Illinois EPA Project) - AIR PROGRAM AIR MINOR (AIRS/AFS) Business SIC classification: NATURAL GAS DISTRIBUTION
CROWN INDUSTRIAL PRODUCTS CO (12603 STATELINE RD in HEBRON, IL)
STATE MASTER (Illinois EPA Project) - SOLID WASTE PROGRAM, HAZARDOUS WASTE PROGRAM, AIR PROGRAM AIR MINOR (AIRS/AFS) Business SIC classification: SPECIAL INDUSTRY MACHINERY
HEBRON TOWNSHIP HWY DEPT (10005 GREEN ST in HEBRON, IL)
STATE MASTER (Illinois EPA Project) - HAZARDOUS WASTE PROGRAM Small Quantity Generators, between 100 kg and 1000 kg of hazardous waste/month (Resource Conservation and Recovery Act (tracking hazardous waste)) - notification Organizations: HEBRON TWNSHP HWY DEPT (CONTACT/OWNER)
Alternative names: HEBRIN TOWNSHIP HWY DEPT
ALDEN-HEBRON MIDDLE SCHOOL (9604 ILLINOIS ST in HEBRON, IL)
(National Center for Education Statistics) - STATE ID-4406301901001 Organizations: ALDEN HEBRON SCHOOL DIST 19 (SCHOOL DISTRICT)
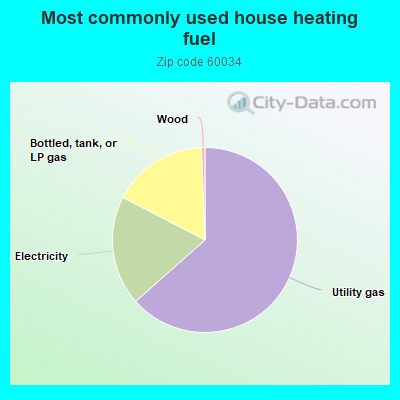
63.6%Utility gas
19.2%Electricity
16.8%Bottled, tank, or LP gas
0.6%Wood
Population in 1990: 1,606. Population change in the 1990s: +290 (+18.1%).
Place of birth for U.S.-born residents:
This state: 1,485
Northeast: 28
Midwest: 202
South: 172
West: 82
60% of the 60034 zip code residents lived in the same house 5 years ago. Out of people who lived in different houses, 69% lived in this county. Out of people who lived in different counties, 50% lived in Illinois.
94% of the 60034 zip code residents lived in the same house 1 year ago. Out of people who lived in different houses, 46% moved from this county. Out of people who lived in different houses, 12% moved from different county within same state. Out of people who lived in different houses, 43% moved from different state.
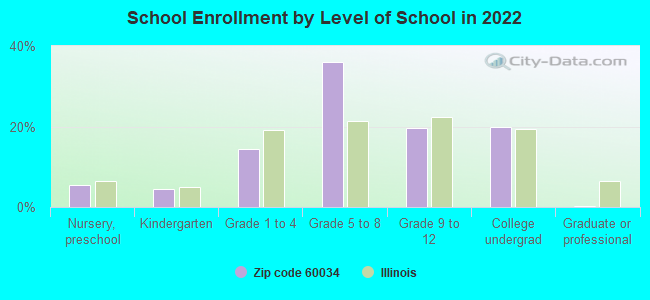
Private vs. public school enrollment:
Students in private schools in grades 1 to 8 (elementary and middle school): 13
Here:
5.0%
Illinois:
13.3%
Students in private schools in grades 9 to 12 (high school): 22
Here:
21.1%
Illinois:
9.9%
Students in private undergraduate colleges: 82
Here:
74.8%
Illinois:
27.4%
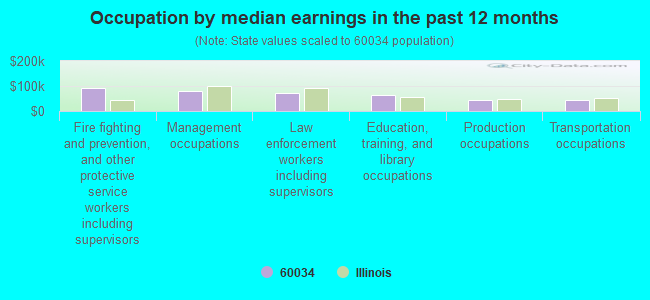
Occupation by median earnings in the past 12 months ($)
90,116Fire fighting and prevention, and other protective service workers including supervisors
79,538Management occupations
73,163Law enforcement workers including supervisors
63,671Education, training, and library occupations
43,526Production occupations
43,127Transportation occupations
Companies with federal contracts located in this zip code:
SHOOLTZ ENTERPRISES INC (11829 PRAIRIE AVE in HEBRON, IL; small business)
$69,000 with Navy for Custodial Janitorial Services. Signed on 1999-10-18. Completion date: 2000-04-30.
TRISEAL CORPORATION (11920 PRICE ROAD in HEBRON, IL; small business) : $0 in 2 contractsin 2003
$0 with Defense Logistics Agency for Bushings, Rings, Shims, and Spacers. Signed on 2003-10-31. Completion date: 2008-10-30.
$0, same as above.Signed on 2003-10-31. Completion date: 2008-10-30.
Top industries in this zip code by the number of employees in 2005:
Management of Companies and Enterprises: Corporate, Subsidiary, and Regional Managing Offices (20-49 employees: 1 establishment)
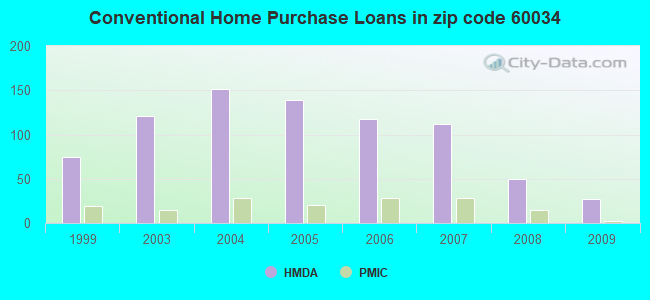
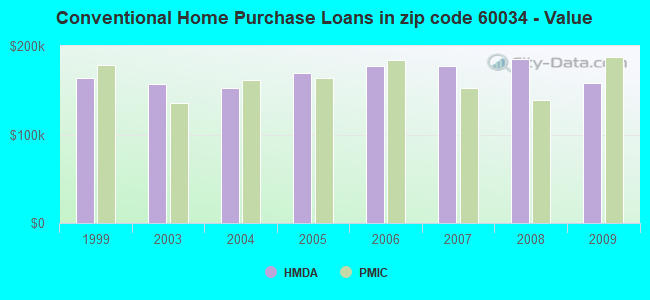
Detailed PMIC statistics for the following Tracts:8701.01
2002 - 2018 National Fire Incident Reporting System (NFIRS) incidents
According to the data from the years 2002 - 2018 the average number of fires per year is 23. The highest number of reported fire incidents - 44 took place in 2007, and the least - 9 in 2014. The data has a rising trend.
When looking into fire subcategories, the most reports belonged to: Structure Fires (50.6%), and Outside Fires (32.4%).
Fire incident types reported to NFIRS in Zip Code 60034
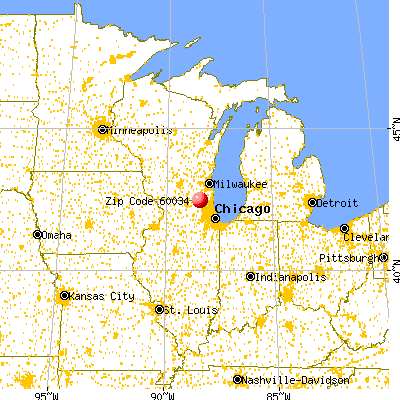


 Nearest zip codes: 60097, 53195, 60071, 53128, 53147, 60072.
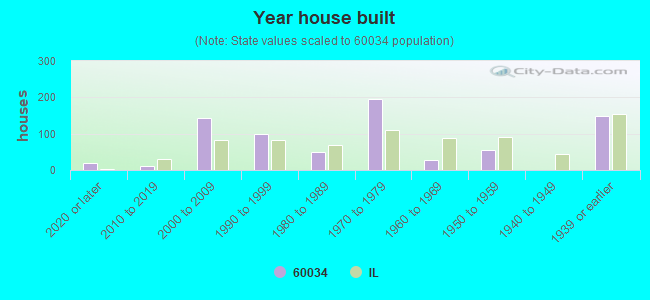


 According to the data from the years 2002 - 2018 the average number of fires per year is 23. The highest number of reported fire incidents - 44 took place in 2007, and the least - 9 in 2014. The data has a rising trend.
 When looking into fire subcategories, the most reports belonged to: Structure Fires (50.6%), and Outside Fires (32.4%).