Estimated zip code population in 2022: 18,026 Zip code population in 2010: 17,495 Zip code population in 2000: 17,198
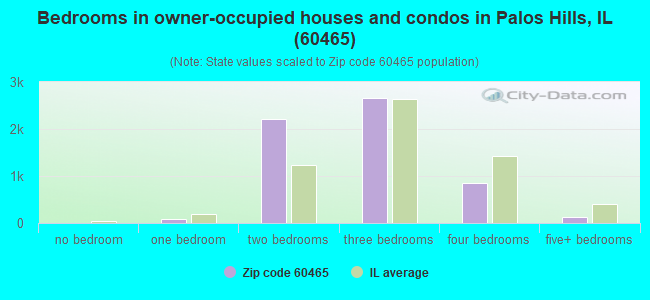
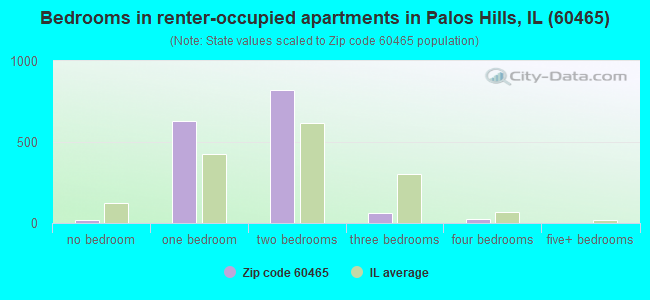
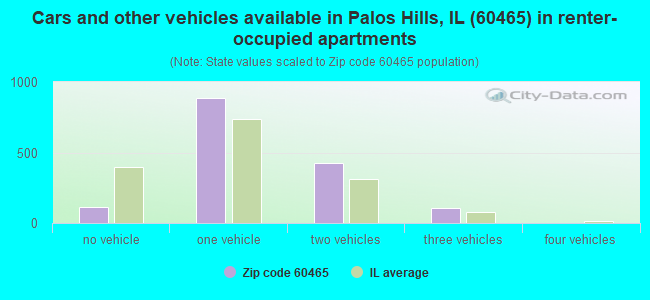
Houses and condos: 7,937 Renter-occupied apartments: 1,549
% of renters here:
21%
State:
33%
March 2022 cost of living index in zip code 60465: 100.3 (near average, U.S. average is 100)
Land area: 4.7 sq. mi. Water area: 0.0 sq. mi.
Population density: 3,795 people per square mile
(average).
OSM Map
General Map
Google Map
MSN Map
OSM Map
General Map
Google Map
MSN Map
OSM Map
General Map
Google Map
MSN Map
OSM Map
General Map
Google Map
MSN Map
Please wait while loading the map...
Real estate property taxes paid for housing units in 2022:
This zip code:
2.1% ($5,261)
Illinois:
2.0% ($4,912)
Median real estate property taxes paid for housing units with mortgages in 2022: $5,473 (2.2%) Median real estate property taxes paid for housing units with no mortgage in 2022: $4,447 (1.8%)
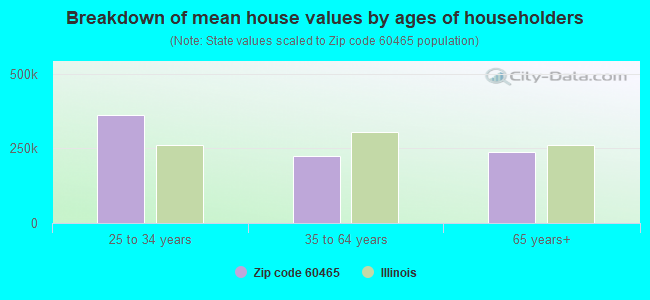
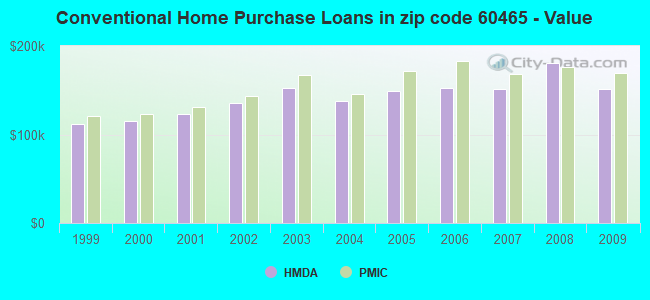
Estimated median house/condo value in 2022: $253,599
60465:
$253,599
Illinois:
$251,600
According to our research of Illinois and other state lists, there were 7 registered sex offenders living in 60465 zip code as of April 26, 2024. The ratio of all residents to sex offenders in zip code 60465 is 2,547 to 1. The ratio of registered sex offenders to all residents in this zip code is much lower than the state average.
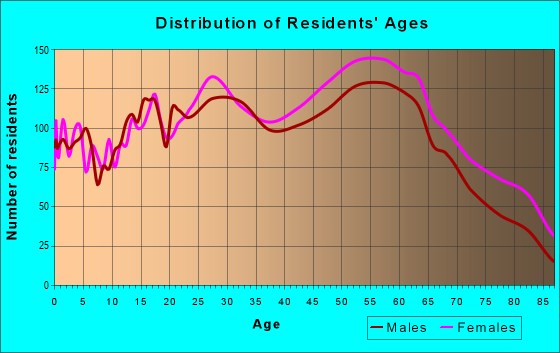
Median resident age:
This zip code:
42.6 years
Illinois median age:
39.1 years
Average household size:
This zip code:
2.4 people
Illinois:
2.4 people
Averages for the 2020 tax year for zip code 60465, filed in 2021:
Average Adjusted Gross Income (AGI) in 2020: $58,082 (Individual Income Tax Returns)
Here:
$58,082
State:
$82,626
Salary/wage: $52,335 (reported on 72.5% of returns)
Here:
$52,335
State:
$66,640
(% of AGI for various income ranges: 1007.9% for AGIs below $25k, 3117.4% for AGIs $25k-50k, 6303.9% for AGIs $50k-75k, 9453.1% for AGIs $75k-100k, 16744.8% for AGIs $100k-200k, 59595.7% for AGIs over 200k)
Taxable interest for individuals: $1,874 (reported on 29.0% of returns)
This zip code:
$1,874
Illinois:
$2,376
(% of AGI for various income ranges: 38.8% for AGIs below $25k, 43.8% for AGIs $25k-50k, 52.2% for AGIs $50k-75k, 99.5% for AGIs $75k-100k, 180.0% for AGIs $100k-200k, 1692.9% for AGIs over 200k)
Ordinary dividends: $3,809 (reported on 19.0% of returns)
Here:
$3,809
State:
$9,061
(% of AGI for various income ranges: 34.9% for AGIs below $25k, 44.6% for AGIs $25k-50k, 80.4% for AGIs $50k-75k, 139.5% for AGIs $75k-100k, 318.1% for AGIs $100k-200k, 2065.7% for AGIs over 200k)
Net capital gain/loss in AGI: +$9,636 (reported on 17.5% of returns)
Here:
+$9,636
State:
+$31,684
(% of AGI for various income ranges: 7.4% for AGIs below $25k, 30.9% for AGIs $25k-50k, 91.9% for AGIs $50k-75k, 172.6% for AGIs $75k-100k, 520.7% for AGIs $100k-200k, 13542.9% for AGIs over 200k)
Profit/loss from business: +$10,626 (reported on 21.9% of returns)
Here:
+$10,626
State:
+$12,175
(% of AGI for various income ranges: 332.4% for AGIs below $25k, 421.4% for AGIs $25k-50k, 289.0% for AGIs $50k-75k, 241.8% for AGIs $75k-100k, 345.8% for AGIs $100k-200k, 1725.7% for AGIs over 200k)
Taxable individual retirement arrangement distribution: $16,707 (reported on 10.5% of returns)
60465:
$16,707
Illinois:
$21,613
(% of AGI for various income ranges: 78.4% for AGIs below $25k, 132.2% for AGIs $25k-50k, 196.1% for AGIs $50k-75k, 298.5% for AGIs $75k-100k, 892.2% for AGIs $100k-200k, 3811.4% for AGIs over 200k)
Total itemized deductions: $24,688 (reported on 7.2% of returns)
Here:
$24,688
State:
$34,948
(% of AGI for various income ranges: 57.1% for AGIs below $25k, 140.1% for AGIs $25k-50k, 264.6% for AGIs $50k-75k, 474.4% for AGIs $75k-100k, 802.5% for AGIs $100k-200k, 2680.0% for AGIs over 200k)
Charity contributions: $5,217 (reported on 5.8% of returns)
Here:
$5,217
State:
$13,122
(% of AGI for various income ranges: 3.4% for AGIs below $25k, 11.4% for AGIs $25k-50k, 48.0% for AGIs $50k-75k, 70.0% for AGIs $75k-100k, 143.3% for AGIs $100k-200k, 915.7% for AGIs over 200k)
Taxes paid: $8,009 (reported on 7.2% of returns)
60465:
$8,009
State:
$8,563
(% of AGI for various income ranges: 15.5% for AGIs below $25k, 35.4% for AGIs $25k-50k, 92.2% for AGIs $50k-75k, 175.3% for AGIs $75k-100k, 265.8% for AGIs $100k-200k, 852.9% for AGIs over 200k)
Earned income credit: $2,342 (reported on 15.3% of returns)
Here:
$2,342
State:
$2,311
(% of AGI for various income ranges: 98.4% for AGIs below $25k, 84.1% for AGIs $25k-50k, 1.2% for AGIs $50k-75k)
Percentage of individuals using paid preparers for their 2020 taxes: 91.9%
Here:
92%
State:
93%
(% for various income ranges: 91.4% for AGIs below $25k, 93.4% for AGIs $25k-50k, 90.5% for AGIs $50k-75k, 92.7% for AGIs $75k-100k, 91.7% for AGIs $100k-200k, 91.7% for AGIs over 200k)
Averages for the 2012 tax year for zip code 60465, filed in 2013:
Average Adjusted Gross Income (AGI) in 2012: $50,327 (Individual Income Tax Returns)
Here:
$50,327
State:
$68,058
Salary/wage: $46,357 (reported on 76.0% of returns)
Here:
$46,357
State:
$55,396
(% of AGI for various income ranges: 58.4% for AGIs below $25k, 70.9% for AGIs $25k-50k, 75.8% for AGIs $50k-75k, 71.2% for AGIs $75k-100k, 73.2% for AGIs $100k-200k, 58.8% for AGIs over 200k)
Taxable interest for individuals: $1,287 (reported on 38.0% of returns)
This zip code:
$1,287
Illinois:
$1,969
(% of AGI for various income ranges: 2.0% for AGIs below $25k, 0.9% for AGIs $25k-50k, 0.8% for AGIs $50k-75k, 1.0% for AGIs $75k-100k, 0.8% for AGIs $100k-200k, 1.0% for AGIs over 200k)
Ordinary dividends: $3,309 (reported on 22.2% of returns)
Here:
$3,309
State:
$7,786
(% of AGI for various income ranges: 1.9% for AGIs below $25k, 1.2% for AGIs $25k-50k, 1.0% for AGIs $50k-75k, 1.6% for AGIs $75k-100k, 1.5% for AGIs $100k-200k, 2.0% for AGIs over 200k)
Net capital gain/loss in AGI: +$2,483 (reported on 15.7% of returns)
Here:
+$2,483
State:
+$22,183
(% of AGI for various income ranges: 0.5% for AGIs $75k-100k, 0.7% for AGIs $100k-200k, 4.7% for AGIs over 200k)
Profit/loss from business: +$11,057 (reported on 19.2% of returns)
Here:
+$11,057
State:
+$12,903
(% of AGI for various income ranges: 18.6% for AGIs below $25k, 6.4% for AGIs $25k-50k, 2.3% for AGIs $50k-75k, 1.5% for AGIs $75k-100k, 1.2% for AGIs $100k-200k, 3.1% for AGIs over 200k)
Taxable individual retirement arrangement distribution: $12,528 (reported on 12.0% of returns)
60465:
$12,528
Illinois:
$17,929
(% of AGI for various income ranges: 4.5% for AGIs below $25k, 3.1% for AGIs $25k-50k, 2.2% for AGIs $50k-75k, 3.4% for AGIs $75k-100k, 3.0% for AGIs $100k-200k, 2.3% for AGIs over 200k)
Self-employment retirement plans: $16,700 (reported on 0.2% of returns)
60465:
$16,700
Illinois:
$24,666
Total itemized deductions: $19,563 (24% of AGI, reported on 38.1% of returns)
Here:
$19,563
State:
$26,433
Here:
23.6% of AGI
State:
19.2% of AGI
(% of AGI for various income ranges: 13.1% for AGIs below $25k, 15.0% for AGIs $25k-50k, 15.3% for AGIs $50k-75k, 15.7% for AGIs $75k-100k, 15.5% for AGIs $100k-200k, 12.3% for AGIs over 200k)
Charity contributions: $2,119 (reported on 32.3% of returns)
Here:
$2,119
State:
$4,525
(% of AGI for various income ranges: 0.8% for AGIs below $25k, 1.1% for AGIs $25k-50k, 1.4% for AGIs $50k-75k, 1.4% for AGIs $75k-100k, 1.5% for AGIs $100k-200k, 1.8% for AGIs over 200k)
Taxes paid: $8,625 (reported on 38.1% of returns)
60465:
$8,625
State:
$11,968
(% of AGI for various income ranges: 4.2% for AGIs below $25k, 5.6% for AGIs $25k-50k, 6.6% for AGIs $50k-75k, 7.1% for AGIs $75k-100k, 7.5% for AGIs $100k-200k, 6.8% for AGIs over 200k)
Earned income credit: $2,213 (reported on 16.0% of returns)
Here:
$2,213
State:
$2,349
(% of AGI for various income ranges: 5.8% for AGIs below $25k, 1.0% for AGIs $25k-50k)
Percentage of individuals using paid preparers for their 2012 taxes: 65.2%
Here:
65%
State:
57%
(% for various income ranges: 61.8% for AGIs below $25k, 64.4% for AGIs $25k-50k, 67.8% for AGIs $50k-75k, 67.8% for AGIs $75k-100k, 70.3% for AGIs $100k-200k, 85.7% for AGIs over 200k)
Averages for the 2004 tax year for zip code 60465, filed in 2005:
Average Adjusted Gross Income (AGI) in 2004: $45,055 (Individual Income Tax Returns)
Here:
$45,055
State:
$54,625
Salary/wage: $41,610 (reported on 78.3% of returns)
Here:
$41,610
State:
$46,811
(% of AGI for various income ranges: 94.1% for AGIs below $10k, 61.3% for AGIs $10k-25k, 76.1% for AGIs $25k-50k, 78.5% for AGIs $50k-75k, 78.9% for AGIs $75k-100k, 63.2% for AGIs over 100k)
Taxable interest for individuals: $1,673 (reported on 55.7% of returns)
This zip code:
$1,673
Illinois:
$2,101
(% of AGI for various income ranges: 10.1% for AGIs below $10k, 4.3% for AGIs $10k-25k, 1.8% for AGIs $25k-50k, 1.9% for AGIs $50k-75k, 1.3% for AGIs $75k-100k, 1.7% for AGIs over 100k)
Taxable dividends: $2,063 (reported on 29.8% of returns)
Here:
$2,063
State:
$4,306
(% of AGI for various income ranges: 5.2% for AGIs below $10k, 2.4% for AGIs $10k-25k, 1.1% for AGIs $25k-50k, 1.1% for AGIs $50k-75k, 1.0% for AGIs $75k-100k, 1.5% for AGIs over 100k)
Net capital gain/loss: +$7,518 (reported on 22.1% of returns)
Here:
+$7,518
State:
+$17,321
(% of AGI for various income ranges: -2.2% for AGIs below $10k, -0.0% for AGIs $10k-25k, 0.6% for AGIs $25k-50k, 0.7% for AGIs $50k-75k, 0.7% for AGIs $75k-100k, 11.1% for AGIs over 100k)
Profit/loss from business: +$12,221 (reported on 16.4% of returns)
Here:
+$12,221
State:
+$11,771
(% of AGI for various income ranges: 20.0% for AGIs below $10k, 11.9% for AGIs $10k-25k, 4.4% for AGIs $25k-50k, 2.0% for AGIs $50k-75k, 2.2% for AGIs $75k-100k, 4.8% for AGIs over 100k)
IRA payment deduction: $3,443 (reported on 3.6% of returns)
60465:
$3,443
Illinois:
$3,087
(% of AGI for various income ranges: 0.4% for AGIs $10k-25k, 0.4% for AGIs $25k-50k, 0.3% for AGIs $50k-75k, 0.2% for AGIs $75k-100k, 0.2% for AGIs over 100k)
Self-employed pension: $15,125 (reported on 0.4% of returns)
Here:
$15,125
Illinois:
$16,965
Total itemized deductions: $15,687 (22% of AGI, reported on 40.2% of returns)
Here:
$15,687
State:
$20,239
Here:
22.3% of AGI
State:
19.5% of AGI
(% of AGI for various income ranges: 21.0% for AGIs below $10k, 16.1% for AGIs $10k-25k, 14.4% for AGIs $25k-50k, 15.7% for AGIs $50k-75k, 15.2% for AGIs $75k-100k, 10.8% for AGIs over 100k)
Charity contributions deductions: $2,084 (3% of AGI, reported on 36.8% of returns)
Here:
$2,084
State:
$3,719
Here:
2.9% of AGI
State:
3.4% of AGI
(% of AGI for various income ranges: 1.2% for AGIs below $10k, 1.3% for AGIs $10k-25k, 1.5% for AGIs $25k-50k, 1.8% for AGIs $50k-75k, 2.0% for AGIs $75k-100k, 1.7% for AGIs over 100k)
Total tax: $6,421 (reported on 80.2% of returns)
60465:
$6,421
State:
$9,882
(% of AGI for various income ranges: 4.8% for AGIs below $10k, 4.9% for AGIs $10k-25k, 7.7% for AGIs $25k-50k, 9.8% for AGIs $50k-75k, 11.1% for AGIs $75k-100k, 17.7% for AGIs over 100k)
Earned income credit: $1,527 (reported on 10.5% of returns)
Here:
$1,527
State:
$1,788
Percentage of individuals using paid preparers for their 2004 taxes: 64.6%
Here:
65%
State:
61%
(% for various income ranges: 57.2% for AGIs below $10k, 64.8% for AGIs $10k-25k, 65.2% for AGIs $25k-50k, 66.8% for AGIs $50k-75k, 66.6% for AGIs $75k-100k, 72.4% for AGIs over 100k)
Household received Food Stamps/SNAP in the past 12 months: 724 Household did not receive Food Stamps/SNAP in the past 12 months: 6,715
Women who had a birth in the past 12 months: 143 (117 now married, 26 unmarried) Women who did not have a birth in the past 12 months: 3,900 (1,378 now married, 2,528 unmarried)
Housing units in zip code 60465 with a mortgage: 3,886 (151 second mortgage, 3 home equity loan, 142 both second mortgage and home equity loan) Houses without a mortgage: 69
Median monthly owner costs for units with a mortgage: $1,684 Median monthly owner costs for units without a mortgage: $746
Residents with income below the poverty level in 2022:
This zip code:
9.9%
Whole state:
11.9%
Residents with income below 50% of the poverty level in 2022:
This zip code:
7.3%
Whole state:
5.7%
Median number of rooms in houses and condos:
Here:
5.8
State:
6.4
Median number of rooms in apartments:
Here:
3.5
State:
4.1
Notable locations in this zip code not listed on our city pages
Notable locations in zip code 60465: Palos Hills Golf Club (A), North Palos Fire Protection District Station 2 (B), North Palos Fire Protection District Station 1 (C), Green Hills Public Library (D). Display/hide their locations on the map
Churches in zip code 60465 include: Moraine Valley Community Church (A), Sacred Heart Church (B), Saint Luke Church (C). Display/hide their locations on the map
Parks in zip code 60465 include: Loveland Park (1), Aspen Park (2), Palos Fen Nature Preserve (3), Volunteer Park (4), Osborne Park (5), Michael Park (6), Krasowski Park (7). Display/hide their locations on the map
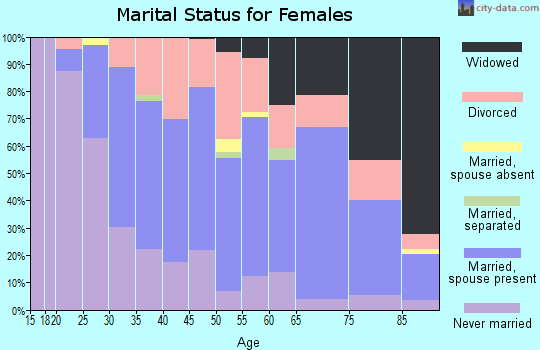
2,298 married couples with children.
1,014 single-parent households (483 men, 531 women).
56.3% of residents of 60465 zip code speak English at home.
4.6% of residents speak Spanish at home (55% very well, 28% well, 13% not well, 4% not at all).
30.9% of residents speak other Indo-European language at home (58% very well, 27% well, 13% not well, 2% not at all).
1.5% of residents speak Asian or Pacific Island language at home (71% very well, 7% well, 11% not well, 11% not at all).
8.0% of residents speak other language at home (75% very well, 19% well, 6% not well).
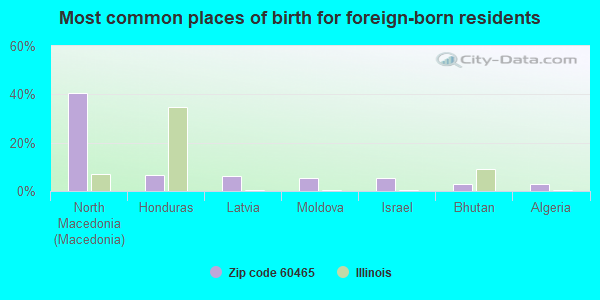
Foreign born population: 5,103 (28.3%) (67.8% of them are naturalized citizens)
This zip code:
28.3%
Whole state:
14.4%
41%North Macedonia (Macedonia)
7%Honduras
6%Latvia
6%Moldova
5%Israel
3%Bhutan
3%Algeria
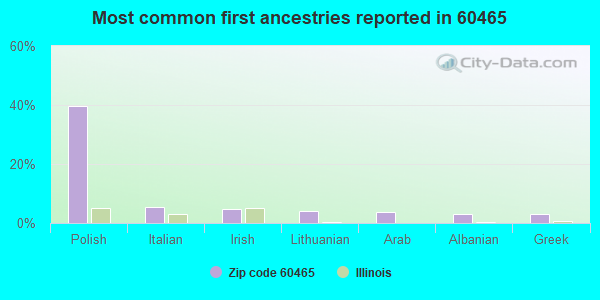
40%Polish
5%Italian
5%Irish
4%Lithuanian
4%Arab
3%Albanian
3%Greek
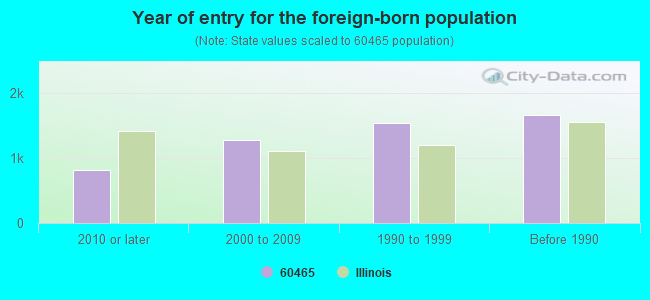
Year of entry for the foreign-born population
8102010 or later
1,2782000 to 2009
1,5461990 to 1999
1,663Before 1990
Major facilities with environmental interests located in this zip code:
NORTH PALOS FIRE PROTECTION (10629 S ROBERTS RD in PALOS HILLS, IL)
STATE MASTER (Illinois EPA Project) - HAZARDOUS WASTE PROGRAM Large Quantity Generators, more that 1000 kg of hazardous waste/month (Resource Conservation and Recovery Act (tracking hazardous waste)) - notification Organizations: NORTH PALOS FIRE PROTECTION DIST (CONTACT/OWNER)
BOUNTY FOODS (7610 W 111 ST in PALOS HILLS, IL)
STATE MASTER (Illinois EPA Project) - AIR PROGRAM AIR MINOR (AIRS/AFS) Business SIC classification: GROCERY STORES
MIDAS (11108 SOUTHWEST HWY in PALOS HILLS, IL)
STATE MASTER (Illinois EPA Project) - SCRAP TIRE MANAGEMENT, HAZARDOUS WASTE PROGRAM Conditionally Exempt Small Quantity Generators, less than 100 kg/month of hazardous waste (Resource Conservation and Recovery Act (tracking hazardous waste)) Business NAICS classification: AUTOMOTIVE EXHAUST SYSTEM REPAIR.
MORAINE VALLEY COLLEGE (10900 S 88TH AVE in PALOS HILLS, IL)
STATE MASTER (Illinois EPA Project) - SOLID WASTE PROGRAM, HAZARDOUS WASTE PROGRAM Small Quantity Generators, between 100 kg and 1000 kg of hazardous waste/month (Resource Conservation and Recovery Act (tracking hazardous waste)) - notification Alternative names: MORAINE VALLEY COMMUNITY COLLEGE
ONE HOUR MARTINIZING (7660 WILL ST in PALOS HILLS, IL)
STATE MASTER (Illinois EPA Project) - AIR PROGRAM AIR MINOR (AIRS/AFS) Business SIC classification: DRYCLEANING PLANTS, EXCEPT RUG CLEANING Alternative names: BETSCHER CLEANERS
PALOS HILLS AUTO CARE (8000 W 111TH ST & ROBERTS in PALOS HILLS, IL)
STATE MASTER (Illinois EPA Project) - SOLID WASTE PROGRAM, HAZARDOUS WASTE PROGRAM, SCRAP TIRE MANAGEMENT Conditionally Exempt Small Quantity Generators, less than 100 kg/month of hazardous waste (Resource Conservation and Recovery Act (tracking hazardous waste)) - notification Business NAICS classification: GENERAL AUTOMOTIVE REPAIR.
CLOTHES CLINIC (8106 W 111TH ST in PALOS HILLS, IL)
STATE MASTER (Illinois EPA Project) - HAZARDOUS WASTE PROGRAM Small Quantity Generators, between 100 kg and 1000 kg of hazardous waste/month (Resource Conservation and Recovery Act (tracking hazardous waste)) - notification Organizations: WILSON BUD (CONTACT/OWNER)
A&H RENTAL (10544 S HARLEM AVE in PALOS HILLS, IL)
STATE MASTER (Illinois EPA Project) - HAZARDOUS WASTE PROGRAM Conditionally Exempt Small Quantity Generators, less than 100 kg/month of hazardous waste (Resource Conservation and Recovery Act (tracking hazardous waste)) - notification Organizations: A & A RENTAL (CONTACT/OWNER)
HAMES OLDSMOBILE INC (11001 SOUTHWEST HWY in PALOS HILLS, IL)
STATE MASTER (Illinois EPA Project) - HAZARDOUS WASTE PROGRAM Small Quantity Generators, between 100 kg and 1000 kg of hazardous waste/month (Resource Conservation and Recovery Act (tracking hazardous waste)) - notification
HILL TOP CLEANERS (8632 W 103RD in PALOS HILLS, IL)
STATE MASTER (Illinois EPA Project) - HAZARDOUS WASTE PROGRAM Conditionally Exempt Small Quantity Generators, less than 100 kg/month of hazardous waste (Resource Conservation and Recovery Act (tracking hazardous waste)) - notification Organizations: ABBASI MIKE (CONTACT/OWNER)
Alternative names: HILLTOP CLEANERS
JIFFY LUBE 474 (8052 W 111TH AVE in PALOS HILLS, IL)
STATE MASTER (Illinois EPA Project) - HAZARDOUS WASTE PROGRAM, SOLID WASTE PROGRAM Small Quantity Generators, between 100 kg and 1000 kg of hazardous waste/month (Resource Conservation and Recovery Act (tracking hazardous waste)) - notification Organizations: JIFFY LUBE INTERNATIONAL (CONTACT/OWNER)
DEVRIES CLEANERS (8108 W 111TH ST in PALOS HILLS, IL)
STATE MASTER (Illinois EPA Project) - HAZARDOUS WASTE PROGRAM Small Quantity Generators, between 100 kg and 1000 kg of hazardous waste/month (Resource Conservation and Recovery Act (tracking hazardous waste)) - notification Organizations: CORPORATION (CONTACT/OWNER)
OAK RIDGE ELEM SCHOOL (8791 W 103RD ST in PALOS HILLS, IL)
(National Center for Education Statistics) - STATE ID-1401611702004 Organizations: NORTH PALOS SCHOOL DIST 117 (SCHOOL DISTRICT)
Housing units lacking complete plumbing facilities: 0.4% Housing units lacking complete kitchen facilities: 1.2%
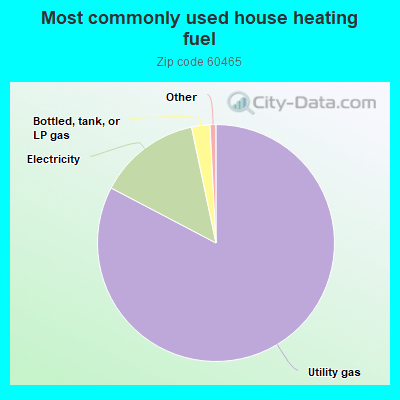
82.7%Utility gas
14.0%Electricity
2.5%Bottled, tank, or LP gas
Population in 1990: 18,112.
Place of birth for U.S.-born residents:
This state: 11,535
Northeast: 130
Midwest: 524
South: 369
West: 64
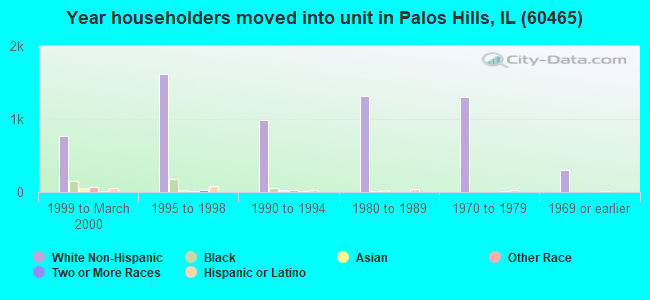
64% of the 60465 zip code residents lived in the same house 5 years ago. Out of people who lived in different houses, 76% lived in this county. Out of people who lived in different counties, 50% lived in Illinois.
90% of the 60465 zip code residents lived in the same house 1 year ago. Out of people who lived in different houses, 77% moved from this county. Out of people who lived in different houses, 7% moved from different county within same state. Out of people who lived in different houses, 9% moved from different state. Out of people who lived in different houses, 4% moved from abroad.
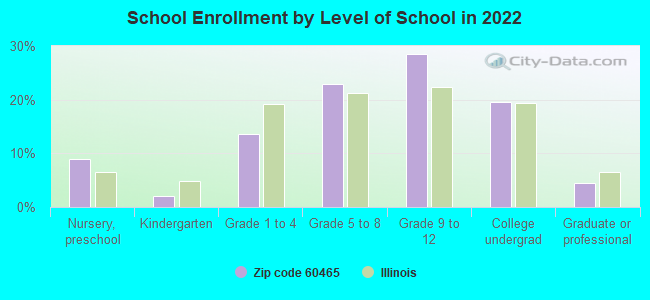
Private vs. public school enrollment:
Students in private schools in grades 1 to 8 (elementary and middle school): 159
Here:
11.1%
Illinois:
13.3%
Students in private schools in grades 9 to 12 (high school): 91
Here:
8.2%
Illinois:
9.9%
Students in private undergraduate colleges: 160
Here:
21.1%
Illinois:
27.4%
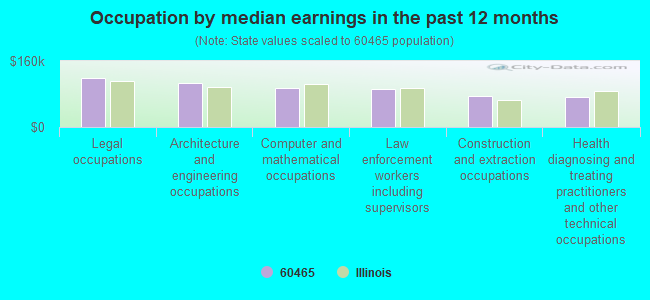
Occupation by median earnings in the past 12 months ($)
118,769Legal occupations
106,735Architecture and engineering occupations
94,657Computer and mathematical occupations
91,682Law enforcement workers including supervisors
75,416Construction and extraction occupations
72,310Health diagnosing and treating practitioners and other technical occupations
Companies with federal contracts located in this zip code:
ENTERPRISE WAREHOUSING SOLUTIO (9006 DEL PRADO DRIVE UNIT in PALOS HILLS, IL; small business) : $2,037,797 in 8 contractsfrom 2002 to 2006
Contracts for ADP Software, Equipment, and Telecommunications Training, Automated Information System Design and Integration Services by Navy, Department of Defense, Defense Logistics Agency Signed by year:2000: $0; 2001: $0; 2002: $291,704; 2003: $793,066; 2004: $901,827; 2005: $0; 2006: $51,200.
Biggest contracts:
$709,436 with Navy for ADP Software, Equipment, and Telecommunications Training. Taking place in SC. Signed on 2004-02-13. Completion date: 2004-05-31.
$696,005 with Navy for ADP Software, Equipment, and Telecommunications Training. Signed on 2003-10-20. Completion date: 2004-02-16.
$192,391 with Navy for ADP Software, Equipment, and Telecommunications Training. Taking place in SC. Signed on 2004-05-27. Completion date: 2004-05-31.
$98,023 with Department of Defense for ADP Software, Equipment, and Telecommunications Training. Signed on 2002-10-01. Completion date: 2002-12-31.
GAMMA PRODUCTS, INC (7730 W 114TH PL in PALOS HILLS, IL; small business) : $299,640 in 12 contractsfrom 1999 to 2006
Contracts for Construction of Structures and Facilities -- Other Non-Building Facilities, Maintenance, Repair and Rebuilding of Equipment -- Automatic Data Processing Equipment (Including Firmware), Software, Supplies and Support Equipment, Maintenance, Repair and Rebuilding of Equipment -- Instruments and Laboratory Equipment, Electrical and Electronic Properties Measuring and Testing Instruments, and moreby Army, Air Force, Navy Signed by year:2000: $35,250; 2001: $0; 2002: $20,400; 2003: $39,390; 2004: $25,900; 2005: $106,100; 2006: $31,350.
Biggest contracts:
$53,400 with Army for Construction of Structures and Facilities -- Other Non-Building Facilities. Signed on 2005-09-26. Completion date: 2006-07-31.
$41,250 with Air Force for Maintenance, Repair and Rebuilding of Equipment -- Automatic Data Processing Equipment (Including Firmware), Software, Supplies and Support Equipment. Taking place in TX. Signed on 1999-11-01. Completion date: 2000-10-31.
$35,250 with Air Force for Maintenance, Repair and Rebuilding of Equipment -- Instruments and Laboratory Equipment. Signed on 2000-10-25. Completion date: 2001-10-31.
$31,350 with Air Force for Electrical and Electronic Properties Measuring and Testing Instruments. Signed on 2006-05-03. Completion date: 2006-08-01.
Top industries in this zip code by the number of employees in 2005:
Professional, Scientific, and Technical Services: Direct Mail Advertising (500-999 employees: 1 establishment)
Finance and Insurance: All Other Insurance Related Activities (100-249: 1, 10-19: 1, 5-9: 1, 1-4: 1)
Administrative and Support and Waste Management and Remediation Services: Office Administrative Services (100-249: 1, 1-4: 2)
Health Care and Social Assistance: Nursing Care Facilities (100-249: 1)
Construction: New Single-Family Housing Construction (except Operative Builders) (50-99: 1, 20-49: 1, 5-9: 1, 1-4: 9)
Other Services (except Public Administration): Religious Organizations (50-99: 1, 20-49: 1, 10-19: 1, 1-4: 3)
2002 - 2018 National Fire Incident Reporting System (NFIRS) incidents
According to the data from the years 2002 - 2018 the average number of fires per year is 93. The highest number of fires - 119 took place in 2003, and the least - 53 in 2018. The data has a dropping trend.
When looking into fire subcategories, the most reports belonged to: Structure Fires (48.1%), and Outside Fires (30.7%).
Fire incident types reported to NFIRS in Zip Code 60465


 Nearest zip codes: 60457, 60482, 60464, 60455, 60415, 60463.


 According to the data from the years 2002 - 2018 the average number of fires per year is 93. The highest number of fires - 119 took place in 2003, and the least - 53 in 2018. The data has a dropping trend.
 When looking into fire subcategories, the most reports belonged to: Structure Fires (48.1%), and Outside Fires (30.7%).