Estimated zip code population in 2022: 14,448 Zip code population in 2010: 14,049 Zip code population in 2000: 14,110
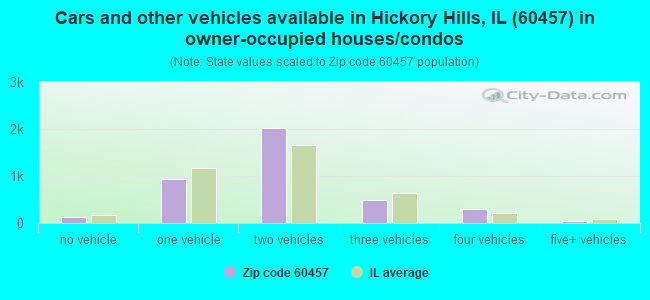
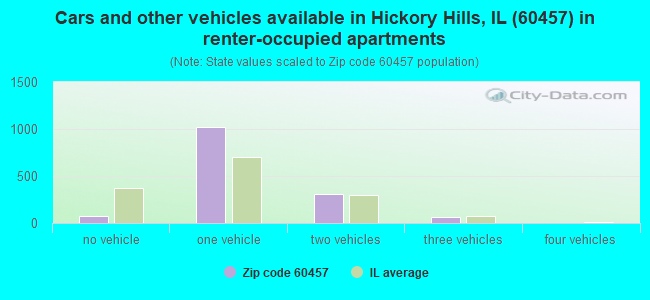
Houses and condos: 5,551 Renter-occupied apartments: 1,473
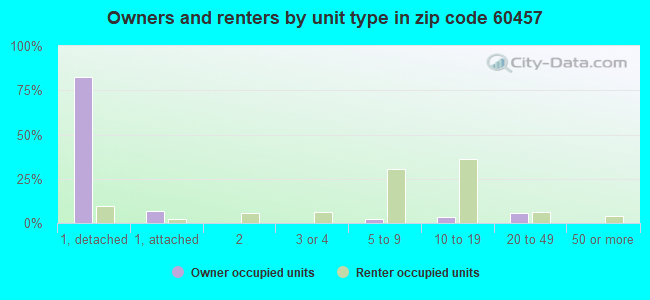
% of renters here:
27%
State:
33%
March 2022 cost of living index in zip code 60457: 99.8 (near average, U.S. average is 100)
Land area: 2.9 sq. mi. Water area: 0.0 sq. mi.
Population density: 4,991 people per square mile
(average).
OSM Map
General Map
Google Map
MSN Map
OSM Map
General Map
Google Map
MSN Map
OSM Map
General Map
Google Map
MSN Map
OSM Map
General Map
Google Map
MSN Map
Please wait while loading the map...
Real estate property taxes paid for housing units in 2022:
This zip code:
2.2% ($6,287)
Illinois:
2.0% ($4,912)
Median real estate property taxes paid for housing units with mortgages in 2022: $6,443 (2.2%) Median real estate property taxes paid for housing units with no mortgage in 2022: $5,986 (2.2%)
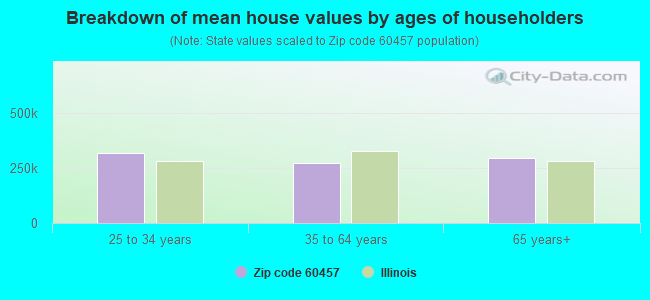
Estimated median house/condo value in 2022: $284,221
60457:
$284,221
Illinois:
$251,600
According to our research of Illinois and other state lists, there were 9 registered sex offenders living in 60457 zip code as of April 27, 2024. The ratio of all residents to sex offenders in zip code 60457 is 1,562 to 1. The ratio of registered sex offenders to all residents in this zip code is lower than the state average.
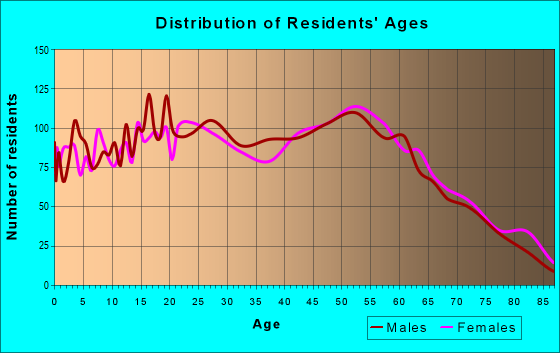
Median resident age:
This zip code:
37.0 years
Illinois median age:
39.1 years
Average household size:
This zip code:
2.7 people
Illinois:
2.4 people
Averages for the 2020 tax year for zip code 60457, filed in 2021:
Average Adjusted Gross Income (AGI) in 2020: $59,174 (Individual Income Tax Returns)
Here:
$59,174
State:
$82,626
Salary/wage: $53,035 (reported on 75.1% of returns)
Here:
$53,035
State:
$66,640
(% of AGI for various income ranges: 1069.1% for AGIs below $25k, 3309.0% for AGIs $25k-50k, 6229.6% for AGIs $50k-75k, 9257.7% for AGIs $75k-100k, 16381.9% for AGIs $100k-200k, 56983.3% for AGIs over 200k)
Taxable interest for individuals: $1,405 (reported on 26.8% of returns)
This zip code:
$1,405
Illinois:
$2,376
(% of AGI for various income ranges: 19.7% for AGIs below $25k, 24.6% for AGIs $25k-50k, 52.7% for AGIs $50k-75k, 67.5% for AGIs $75k-100k, 143.2% for AGIs $100k-200k, 781.7% for AGIs over 200k)
Ordinary dividends: $3,803 (reported on 17.2% of returns)
Here:
$3,803
State:
$9,061
(% of AGI for various income ranges: 19.1% for AGIs below $25k, 32.1% for AGIs $25k-50k, 76.9% for AGIs $50k-75k, 120.6% for AGIs $75k-100k, 256.8% for AGIs $100k-200k, 2053.3% for AGIs over 200k)
Net capital gain/loss in AGI: +$9,004 (reported on 15.5% of returns)
Here:
+$9,004
State:
+$31,684
(% of AGI for various income ranges: 8.8% for AGIs below $25k, 25.6% for AGIs $25k-50k, 95.6% for AGIs $50k-75k, 127.9% for AGIs $75k-100k, 442.1% for AGIs $100k-200k, 8996.7% for AGIs over 200k)
Profit/loss from business: +$11,568 (reported on 21.5% of returns)
Here:
+$11,568
State:
+$12,175
(% of AGI for various income ranges: 284.3% for AGIs below $25k, 410.4% for AGIs $25k-50k, 329.0% for AGIs $50k-75k, 279.6% for AGIs $75k-100k, 407.0% for AGIs $100k-200k, 2701.7% for AGIs over 200k)
Taxable individual retirement arrangement distribution: $17,365 (reported on 8.9% of returns)
60457:
$17,365
Illinois:
$21,613
(% of AGI for various income ranges: 58.2% for AGIs below $25k, 90.1% for AGIs $25k-50k, 205.8% for AGIs $50k-75k, 390.8% for AGIs $75k-100k, 607.0% for AGIs $100k-200k, 3028.3% for AGIs over 200k)
Total itemized deductions: $25,715 (reported on 6.7% of returns)
Here:
$25,715
State:
$34,948
(% of AGI for various income ranges: 29.0% for AGIs below $25k, 116.1% for AGIs $25k-50k, 263.8% for AGIs $50k-75k, 525.8% for AGIs $75k-100k, 679.6% for AGIs $100k-200k, 2928.3% for AGIs over 200k)
Charity contributions: $6,042 (reported on 5.2% of returns)
Here:
$6,042
State:
$13,122
(% of AGI for various income ranges: 10.2% for AGIs $25k-50k, 28.8% for AGIs $50k-75k, 60.4% for AGIs $75k-100k, 129.3% for AGIs $100k-200k, 1331.7% for AGIs over 200k)
Taxes paid: $8,562 (reported on 6.7% of returns)
60457:
$8,562
State:
$8,563
(% of AGI for various income ranges: 9.2% for AGIs below $25k, 34.8% for AGIs $25k-50k, 98.4% for AGIs $50k-75k, 187.7% for AGIs $75k-100k, 234.4% for AGIs $100k-200k, 753.3% for AGIs over 200k)
Earned income credit: $2,431 (reported on 16.3% of returns)
Here:
$2,431
State:
$2,311
(% of AGI for various income ranges: 103.7% for AGIs below $25k, 91.9% for AGIs $25k-50k, 1.8% for AGIs $50k-75k)
Percentage of individuals using paid preparers for their 2020 taxes: 92.1%
Here:
92%
State:
93%
(% for various income ranges: 90.6% for AGIs below $25k, 92.2% for AGIs $25k-50k, 93.7% for AGIs $50k-75k, 94.4% for AGIs $75k-100k, 92.8% for AGIs $100k-200k, 89.5% for AGIs over 200k)
Averages for the 2012 tax year for zip code 60457, filed in 2013:
Average Adjusted Gross Income (AGI) in 2012: $48,638 (Individual Income Tax Returns)
Here:
$48,638
State:
$68,058
Salary/wage: $44,779 (reported on 78.2% of returns)
Here:
$44,779
State:
$55,396
(% of AGI for various income ranges: 64.0% for AGIs below $25k, 73.9% for AGIs $25k-50k, 75.3% for AGIs $50k-75k, 77.3% for AGIs $75k-100k, 76.6% for AGIs $100k-200k, 48.8% for AGIs over 200k)
Taxable interest for individuals: $1,017 (reported on 32.8% of returns)
This zip code:
$1,017
Illinois:
$1,969
(% of AGI for various income ranges: 1.1% for AGIs below $25k, 0.7% for AGIs $25k-50k, 0.6% for AGIs $50k-75k, 0.6% for AGIs $75k-100k, 0.5% for AGIs $100k-200k, 1.2% for AGIs over 200k)
Ordinary dividends: $2,852 (reported on 18.6% of returns)
Here:
$2,852
State:
$7,786
(% of AGI for various income ranges: 1.2% for AGIs below $25k, 0.9% for AGIs $25k-50k, 1.2% for AGIs $50k-75k, 0.9% for AGIs $75k-100k, 1.3% for AGIs $100k-200k, 0.8% for AGIs over 200k)
Net capital gain/loss in AGI: +$3,384 (reported on 12.3% of returns)
Here:
+$3,384
State:
+$22,183
(% of AGI for various income ranges: 0.1% for AGIs $25k-50k, 1.1% for AGIs $100k-200k, 5.8% for AGIs over 200k)
Profit/loss from business: +$10,988 (reported on 19.3% of returns)
Here:
+$10,988
State:
+$12,903
(% of AGI for various income ranges: 19.7% for AGIs below $25k, 6.6% for AGIs $25k-50k, 2.1% for AGIs $50k-75k, 1.3% for AGIs $75k-100k, 2.3% for AGIs $100k-200k)
Taxable individual retirement arrangement distribution: $15,199 (reported on 10.4% of returns)
60457:
$15,199
Illinois:
$17,929
(% of AGI for various income ranges: 3.6% for AGIs below $25k, 3.1% for AGIs $25k-50k, 2.8% for AGIs $50k-75k, 4.1% for AGIs $75k-100k, 2.8% for AGIs $100k-200k, 4.1% for AGIs over 200k)
Total itemized deductions: $19,906 (24% of AGI, reported on 35.7% of returns)
Here:
$19,906
State:
$26,433
Here:
23.7% of AGI
State:
19.2% of AGI
(% of AGI for various income ranges: 11.3% for AGIs below $25k, 13.6% for AGIs $25k-50k, 15.8% for AGIs $50k-75k, 16.6% for AGIs $75k-100k, 15.1% for AGIs $100k-200k, 12.7% for AGIs over 200k)
Charity contributions: $2,134 (reported on 29.8% of returns)
Here:
$2,134
State:
$4,525
(% of AGI for various income ranges: 0.5% for AGIs below $25k, 0.9% for AGIs $25k-50k, 1.2% for AGIs $50k-75k, 1.5% for AGIs $75k-100k, 1.5% for AGIs $100k-200k, 2.2% for AGIs over 200k)
Taxes paid: $9,189 (reported on 35.4% of returns)
60457:
$9,189
State:
$11,968
(% of AGI for various income ranges: 3.9% for AGIs below $25k, 5.1% for AGIs $25k-50k, 7.0% for AGIs $50k-75k, 7.7% for AGIs $75k-100k, 7.8% for AGIs $100k-200k, 7.1% for AGIs over 200k)
Earned income credit: $2,412 (reported on 18.0% of returns)
Here:
$2,412
State:
$2,349
(% of AGI for various income ranges: 6.9% for AGIs below $25k, 1.2% for AGIs $25k-50k)
Percentage of individuals using paid preparers for their 2012 taxes: 63.6%
Here:
64%
State:
57%
(% for various income ranges: 60.6% for AGIs below $25k, 63.4% for AGIs $25k-50k, 67.0% for AGIs $50k-75k, 67.7% for AGIs $75k-100k, 64.8% for AGIs $100k-200k, 80.0% for AGIs over 200k)
Averages for the 2004 tax year for zip code 60457, filed in 2005:
Average Adjusted Gross Income (AGI) in 2004: $44,022 (Individual Income Tax Returns)
Here:
$44,022
State:
$54,625
Salary/wage: $42,219 (reported on 81.0% of returns)
Here:
$42,219
State:
$46,811
(% of AGI for various income ranges: 106.1% for AGIs below $10k, 64.5% for AGIs $10k-25k, 79.7% for AGIs $25k-50k, 81.1% for AGIs $50k-75k, 85.1% for AGIs $75k-100k, 71.0% for AGIs over 100k)
Taxable interest for individuals: $1,404 (reported on 50.8% of returns)
This zip code:
$1,404
Illinois:
$2,101
(% of AGI for various income ranges: 9.1% for AGIs below $10k, 2.9% for AGIs $10k-25k, 1.8% for AGIs $25k-50k, 1.4% for AGIs $50k-75k, 0.9% for AGIs $75k-100k, 1.4% for AGIs over 100k)
Taxable dividends: $2,041 (reported on 24.9% of returns)
Here:
$2,041
State:
$4,306
(% of AGI for various income ranges: 3.5% for AGIs below $10k, 1.4% for AGIs $10k-25k, 0.8% for AGIs $25k-50k, 0.9% for AGIs $50k-75k, 0.8% for AGIs $75k-100k, 1.6% for AGIs over 100k)
Net capital gain/loss: +$4,668 (reported on 17.5% of returns)
Here:
+$4,668
State:
+$17,321
(% of AGI for various income ranges: -1.7% for AGIs below $10k, 0.4% for AGIs $10k-25k, 0.4% for AGIs $25k-50k, 0.8% for AGIs $50k-75k, 1.3% for AGIs $75k-100k, 4.7% for AGIs over 100k)
Profit/loss from business: +$10,756 (reported on 16.8% of returns)
Here:
+$10,756
State:
+$11,771
(% of AGI for various income ranges: 33.9% for AGIs below $10k, 14.5% for AGIs $10k-25k, 4.6% for AGIs $25k-50k, 1.6% for AGIs $50k-75k, 1.3% for AGIs $75k-100k, 3.0% for AGIs over 100k)
IRA payment deduction: $3,261 (reported on 2.8% of returns)
60457:
$3,261
Illinois:
$3,087
(% of AGI for various income ranges: 0.3% for AGIs $10k-25k, 0.3% for AGIs $25k-50k, 0.2% for AGIs $50k-75k, 0.2% for AGIs $75k-100k, 0.1% for AGIs over 100k)
Self-employed pension: $8,789 (reported on 0.3% of returns)
Here:
$8,789
Illinois:
$16,965
Total itemized deductions: $16,158 (22% of AGI, reported on 38.7% of returns)
Here:
$16,158
State:
$20,239
Here:
22.4% of AGI
State:
19.5% of AGI
(% of AGI for various income ranges: 21.0% for AGIs below $10k, 12.4% for AGIs $10k-25k, 14.2% for AGIs $25k-50k, 15.5% for AGIs $50k-75k, 15.6% for AGIs $75k-100k, 12.5% for AGIs over 100k)
Charity contributions deductions: $1,967 (3% of AGI, reported on 35.4% of returns)
Here:
$1,967
State:
$3,719
Here:
2.6% of AGI
State:
3.4% of AGI
(% of AGI for various income ranges: 1.1% for AGIs below $10k, 0.8% for AGIs $10k-25k, 1.5% for AGIs $25k-50k, 1.6% for AGIs $50k-75k, 1.8% for AGIs $75k-100k, 1.7% for AGIs over 100k)
Total tax: $5,894 (reported on 79.9% of returns)
60457:
$5,894
State:
$9,882
(% of AGI for various income ranges: 6.3% for AGIs below $10k, 5.2% for AGIs $10k-25k, 7.5% for AGIs $25k-50k, 8.9% for AGIs $50k-75k, 9.8% for AGIs $75k-100k, 16.9% for AGIs over 100k)
Earned income credit: $1,687 (reported on 12.6% of returns)
Here:
$1,687
State:
$1,788
Percentage of individuals using paid preparers for their 2004 taxes: 62.9%
Here:
63%
State:
61%
(% for various income ranges: 55.9% for AGIs below $10k, 66.3% for AGIs $10k-25k, 63.1% for AGIs $25k-50k, 65.8% for AGIs $50k-75k, 62.1% for AGIs $75k-100k, 66.1% for AGIs over 100k)
Likely homosexual households (counted as self-reported same-sex unmarried-partner households)
Lesbian couples: 0.0% of all households
Gay men: 0.2% of all households
Household received Food Stamps/SNAP in the past 12 months: 553 Household did not receive Food Stamps/SNAP in the past 12 months: 4,798
Women who had a birth in the past 12 months: 272 (229 now married, 42 unmarried) Women who did not have a birth in the past 12 months: 2,586 (1,383 now married, 1,189 unmarried)
Housing units in zip code 60457 with a mortgage: 2,260 (139 second mortgage, 28 home equity loan, 88 both second mortgage and home equity loan) Houses without a mortgage: 79
Median monthly owner costs for units with a mortgage: $1,963 Median monthly owner costs for units without a mortgage: $860
Residents with income below the poverty level in 2022:
This zip code:
7.5%
Whole state:
11.9%
Residents with income below 50% of the poverty level in 2022:
This zip code:
4.0%
Whole state:
5.7%
Median number of rooms in houses and condos:
Here:
6.1
State:
6.4
Median number of rooms in apartments:
Here:
3.7
State:
4.1
Notable locations in this zip code not listed on our city pages
In group quarters: 85 (-1 institutionalized population)
Size of family households: 1,302 2-persons, 690 3-persons, 753 4-persons, 386 5-persons, 294 6-persons, 123 7-or-more-persons
Size of nonfamily households: 1,613 1-person, 180 2-persons, 9 3-persons
3,162 married couples with children.
574 single-parent households (256 men, 318 women).
46.1% of residents of 60457 zip code speak English at home.
11.9% of residents speak Spanish at home (66% very well, 17% well, 15% not well, 1% not at all).
26.8% of residents speak other Indo-European language at home (51% very well, 30% well, 17% not well, 3% not at all).
1.1% of residents speak Asian or Pacific Island language at home (79% very well, 21% not well).
14.9% of residents speak other language at home (71% very well, 14% well, 12% not well, 3% not at all).
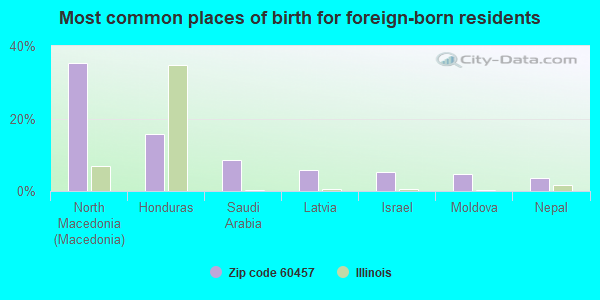
Foreign born population: 4,533 (31.4%) (67.4% of them are naturalized citizens)
This zip code:
31.4%
Whole state:
14.4%
35%North Macedonia (Macedonia)
16%Honduras
8%Saudi Arabia
6%Latvia
5%Israel
5%Moldova
3%Nepal
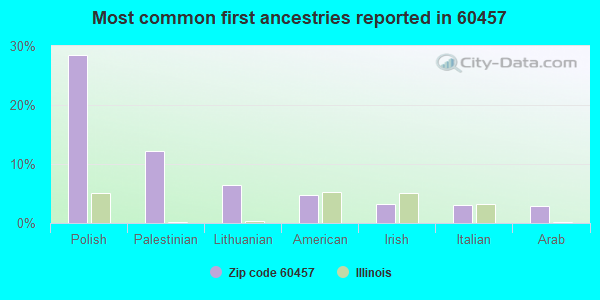
29%Polish
12%Palestinian
6%Lithuanian
5%American
3%Irish
3%Italian
3%Arab
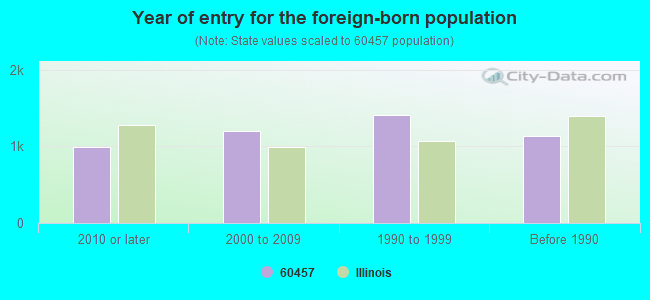
Year of entry for the foreign-born population
9882010 or later
1,2012000 to 2009
1,4101990 to 1999
1,137Before 1990
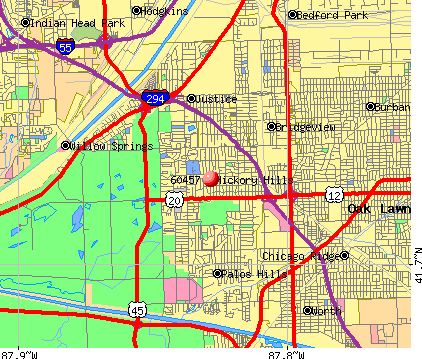
Major facilities with environmental interests located in this zip code:
HICKORY HILL CLEANERS (9432 S. ROBERTS RD. in HICKORY HILLS, IL)
STATE MASTER (Illinois EPA Project) - HAZARDOUS WASTE PROGRAM, AIR PROGRAM AIR MINOR (AIRS/AFS) CRITERIA AND HAZARDOUS AIR POLLUTANT INVENTORY (Inventory of air pollution sources) Small Quantity Generators, between 100 kg and 1000 kg of hazardous waste/month (Resource Conservation and Recovery Act (tracking hazardous waste)) - notification Business SIC classification: DRYCLEANING PLANTS, EXCEPT RUG CLEANING Business NAICS classification: DRYCLEANING AND LAUNDRY SERVICES (EXCEPT COIN-OPERATED). Organizations: TUCKER JAMES (CONTACT/OWNER)
Alternative names: HICKORY HILLS CLEANERS
ONE HOUR CLEANERS (8033 W 87TH ST in HICKORY HILLS, IL)
STATE MASTER (Illinois EPA Project) - HAZARDOUS WASTE PROGRAM (Resource Conservation and Recovery Act (tracking hazardous waste)) Organizations: SONG CH (CONTACT/OWNER)
CROUSE CARTAGE CO (7701 W. 95TH STREET in HICKORY HILLS, IL)
STATE MASTER (Illinois EPA Project) - SOLID WASTE PROGRAM, HAZARDOUS WASTE PROGRAM, National Pollutant Discharge Elimination System Permit National Pollutant Discharge Elimination System NON-MAJOR (Tracking pollutant discharge elimination systems) - permit Organizations: CROUSE CARTAGE COMPANY (CONTACT/OWNER)
Alternative names: CROUSE CARTAGE CO-HICKORY HILL
AMOCO 18725 (8764 W 95TH ST in HICKORY HILLS, IL)
STATE MASTER (Illinois EPA Project) - SOLID WASTE PROGRAM, HAZARDOUS WASTE PROGRAM Small Quantity Generators, between 100 kg and 1000 kg of hazardous waste/month (Resource Conservation and Recovery Act (tracking hazardous waste)) - notification Conditionally Exempt Small Quantity Generators, less than 100 kg/month of hazardous waste (Resource Conservation and Recovery Act (tracking hazardous waste)) - notification Organizations: AMOCO OIL CO (CONTACT/OWNER)
, HICKORY HILLS AMOCO (CONTACT/OWNER)
Alternative names: HICKORY HILLS AMOCO
OSCO DRUG STORE 18 (9534 S ROBERTS RD in HICKORY HILLS, IL)
STATE MASTER (Illinois EPA Project) - HAZARDOUS WASTE PROGRAM (Resource Conservation and Recovery Act (tracking hazardous waste)) Organizations: AMERICAN DRUG STORES (CONTACT/OWNER)
Alternative names: OSCO DRUG STORE NO 18
HENRY BROS CO (9821 S 78TH AVE in HICKORY HILLS, IL)
STATE MASTER (Illinois EPA Project) - SOLID WASTE PROGRAM Small Quantity Generators, between 100 kg and 1000 kg of hazardous waste/month (Resource Conservation and Recovery Act (tracking hazardous waste)) Organizations: GEORGE FERRELL/WILLIAM CALLAGHAN (CONTACT/OWNER)
CHEMLAWN SVC CORP (7650 W 99TH ST in HICKORY HILLS, IL)
STATE MASTER (Illinois EPA Project) - HAZARDOUS WASTE PROGRAM Conditionally Exempt Small Quantity Generators, less than 100 kg/month of hazardous waste (Resource Conservation and Recovery Act (tracking hazardous waste)) - notification
7-ELEVEN 33032 (7700 WEST 95TH STREET in HICKORY HILLS, IL)
STATE MASTER (Illinois EPA Project) - SOLID WASTE PROGRAM Small Quantity Generators, between 100 kg and 1000 kg of hazardous waste/month (Resource Conservation and Recovery Act (tracking hazardous waste)) - notification Organizations: 7 ELEVEN INC (CONTACT/OWNER)
Alternative names: 7 ELEVEN #33032
AMERICAN MEDICAL RESPONSE (9913 S 78TH AVE in HICKORY HILLS, IL)
STATE MASTER (Illinois EPA Project) - HAZARDOUS WASTE PROGRAM Small Quantity Generators, between 100 kg and 1000 kg of hazardous waste/month (Resource Conservation and Recovery Act (tracking hazardous waste)) - notification Organizations: CORPORATION (CONTACT/OWNER)
HICKORY HILLS CLEANERS (9450 S ROBERTS RD in HICKORY HILLS, IL)
STATE MASTER (Illinois EPA Project) - HAZARDOUS WASTE PROGRAM Small Quantity Generators, between 100 kg and 1000 kg of hazardous waste/month (Resource Conservation and Recovery Act (tracking hazardous waste)) - notification Organizations: HICKORY HILLS CLEANRS (CONTACT/OWNER)
JEWEL FOOD STORES, INC. #3029 (9528 SOUTH ROBERTS ROAD in HICKORY HILLS, IL)
AIR MINOR (AIRS/AFS) - ICIS-05-2003-0340, ENFORCEMENT/COMPLIANCE ACTIVITY Business SIC classification: GROCERY STORES
CLASSIC THERMOGRAPHERS (7725 W 98TH ST in HICKORY HILLS, IL)
STATE MASTER (Illinois EPA Project) - HAZARDOUS WASTE PROGRAM Small Quantity Generators, between 100 kg and 1000 kg of hazardous waste/month (Resource Conservation and Recovery Act (tracking hazardous waste)) - notification Organizations: WILKIN DONALD (CONTACT/OWNER)
Housing units lacking complete plumbing facilities: 0.7% Housing units lacking complete kitchen facilities: 0.7%
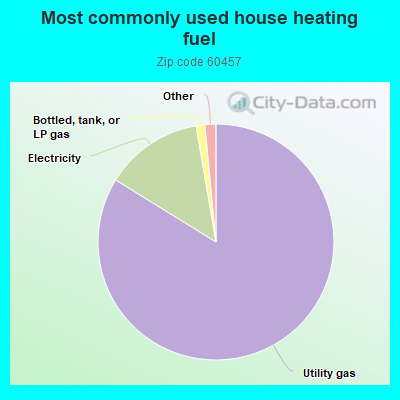
83.9%Utility gas
13.5%Electricity
1.2%Bottled, tank, or LP gas
0.7%No fuel used
0.5%Other fuel
Population in 1990: 12,894. Population change in the 1990s: +1,216 (+9.4%).
Place of birth for U.S.-born residents:
This state: 8,688
Northeast: 251
Midwest: 318
South: 184
West: 244
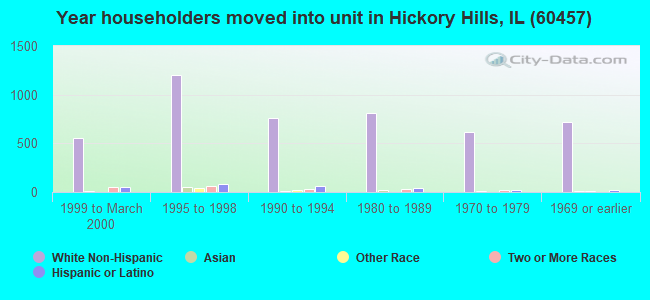
67% of the 60457 zip code residents lived in the same house 5 years ago. Out of people who lived in different houses, 86% lived in this county. Out of people who lived in different counties, 50% lived in Illinois.
92% of the 60457 zip code residents lived in the same house 1 year ago. Out of people who lived in different houses, 78% moved from this county. Out of people who lived in different houses, 8% moved from different county within same state. Out of people who lived in different houses, 7% moved from different state. Out of people who lived in different houses, 3% moved from abroad.
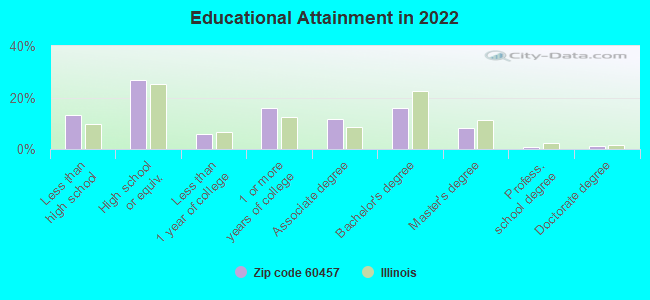
Private vs. public school enrollment:
Students in private schools in grades 1 to 8 (elementary and middle school): 135
Here:
6.5%
Illinois:
13.3%
Students in private schools in grades 9 to 12 (high school): 58
Here:
9.2%
Illinois:
9.9%
Students in private undergraduate colleges: 93
Here:
14.0%
Illinois:
27.4%
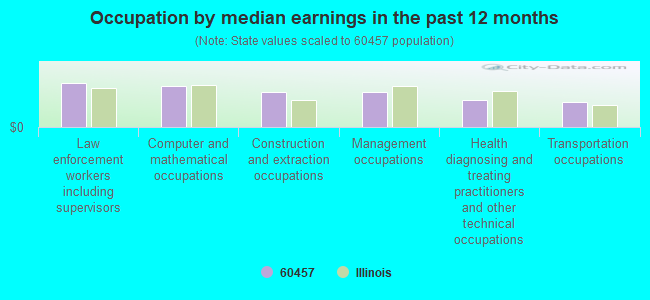
Occupation by median earnings in the past 12 months ($)
108,060Law enforcement workers including supervisors
101,908Computer and mathematical occupations
86,441Construction and extraction occupations
85,012Management occupations
65,663Health diagnosing and treating practitioners and other technical occupations
61,901Transportation occupations
Companies with federal contracts located in this zip code:
NATIONAL BULLET PROOF, INC (9855 S 78TH AVE in HICKORY HILLS, IL)
$15,481 with Navy for Building Components, Prefabricated. Taking place in SC. Signed on 2004-07-09. Completion date: 2004-07-30.
Top industries in this zip code by the number of employees in 2005:
2002 - 2018 National Fire Incident Reporting System (NFIRS) incidents
Based on the data from the years 2002 - 2018 the average number of fires per year is 68. The highest number of reported fire incidents - 103 took place in 2018, and the least - 35 in 2016. The data has a rising trend.
When looking into fire subcategories, the most reports belonged to: Structure Fires (51.2%), and Outside Fires (23.1%).
Fire incident types reported to NFIRS in Zip Code 60457
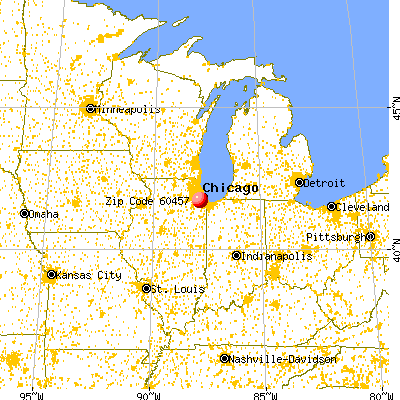


 Nearest zip codes: 60455, 60465, 60458, 60482, 60480, 60415.


 Based on the data from the years 2002 - 2018 the average number of fires per year is 68. The highest number of reported fire incidents - 103 took place in 2018, and the least - 35 in 2016. The data has a rising trend.
 When looking into fire subcategories, the most reports belonged to: Structure Fires (51.2%), and Outside Fires (23.1%).