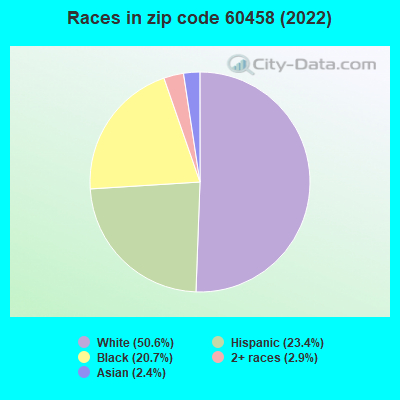
Estimated zip code population in 2022: 14,162 Zip code population in 2010: 14,428 Zip code population in 2000: 14,226
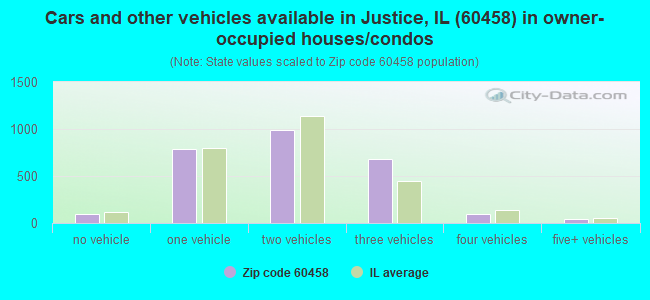
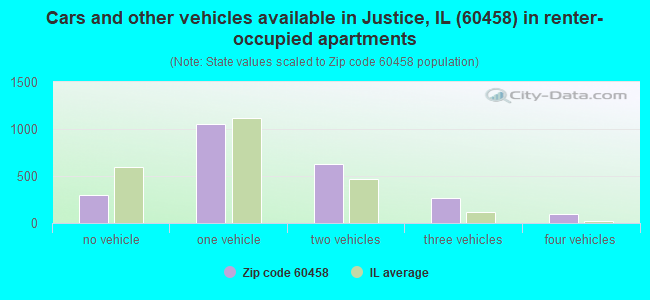
Houses and condos: 5,452 Renter-occupied apartments: 2,363
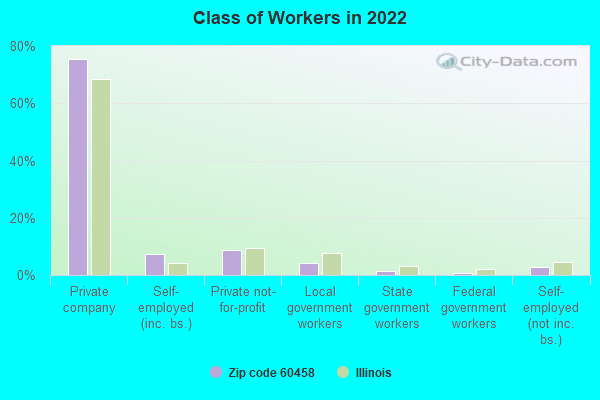
% of renters here:
47%
State:
33%
March 2022 cost of living index in zip code 60458: 101.0 (near average, U.S. average is 100)
Land area: 2.9 sq. mi. Water area: 0.0 sq. mi.
Population density: 4,928 people per square mile
(average).
OSM Map
General Map
Google Map
MSN Map
OSM Map
General Map
Google Map
MSN Map
OSM Map
General Map
Google Map
MSN Map
OSM Map
General Map
Google Map
MSN Map
Please wait while loading the map...
Real estate property taxes paid for housing units in 2022:
This zip code:
2.2% ($5,128)
Illinois:
2.0% ($4,912)
Median real estate property taxes paid for housing units with mortgages in 2022: $5,225 (2.1%) Median real estate property taxes paid for housing units with no mortgage in 2022: $4,873 (2.4%)
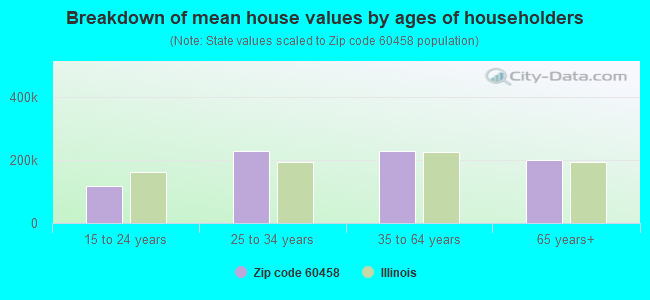
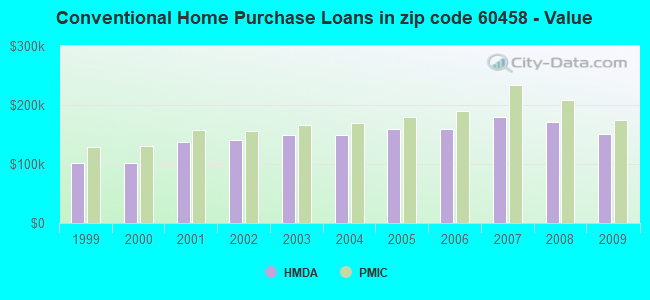
Estimated median house/condo value in 2022: $231,291
60458:
$231,291
Illinois:
$251,600
According to our research of Illinois and other state lists, there were 9 registered sex offenders living in 60458 zip code as of April 27, 2024. The ratio of all residents to sex offenders in zip code 60458 is 1,678 to 1. The ratio of registered sex offenders to all residents in this zip code is lower than the state average.
Median resident age:
This zip code:
30.5 years
Illinois median age:
39.1 years
Average household size:
This zip code:
2.8 people
Illinois:
2.4 people
Averages for the 2020 tax year for zip code 60458, filed in 2021:
Average Adjusted Gross Income (AGI) in 2020: $44,280 (Individual Income Tax Returns)
Here:
$44,280
State:
$82,626
Salary/wage: $41,951 (reported on 79.7% of returns)
Here:
$41,951
State:
$66,640
(% of AGI for various income ranges: 1146.5% for AGIs below $25k, 3370.7% for AGIs $25k-50k, 6919.1% for AGIs $50k-75k, 9930.8% for AGIs $75k-100k, 17352.3% for AGIs $100k-200k, 48400.0% for AGIs over 200k)
Taxable interest for individuals: $757 (reported on 16.2% of returns)
This zip code:
$757
Illinois:
$2,376
(% of AGI for various income ranges: 10.7% for AGIs below $25k, 10.2% for AGIs $25k-50k, 13.9% for AGIs $50k-75k, 31.8% for AGIs $75k-100k, 69.0% for AGIs $100k-200k, 185.0% for AGIs over 200k)
Ordinary dividends: $1,823 (reported on 7.6% of returns)
Here:
$1,823
State:
$9,061
(% of AGI for various income ranges: 6.8% for AGIs below $25k, 9.3% for AGIs $25k-50k, 12.9% for AGIs $50k-75k, 53.1% for AGIs $75k-100k, 107.3% for AGIs $100k-200k, 210.0% for AGIs over 200k)
Net capital gain/loss in AGI: +$5,153 (reported on 7.2% of returns)
Here:
+$5,153
State:
+$31,684
(% of AGI for various income ranges: 3.1% for AGIs below $25k, 10.2% for AGIs $25k-50k, 26.8% for AGIs $50k-75k, 76.4% for AGIs $75k-100k, 601.0% for AGIs $100k-200k)
Profit/loss from business: +$8,207 (reported on 21.8% of returns)
Here:
+$8,207
State:
+$12,175
(% of AGI for various income ranges: 244.9% for AGIs below $25k, 233.1% for AGIs $25k-50k, 248.3% for AGIs $50k-75k, 313.3% for AGIs $75k-100k, 246.3% for AGIs $100k-200k)
Taxable individual retirement arrangement distribution: $12,176 (reported on 4.2% of returns)
60458:
$12,176
Illinois:
$21,613
(% of AGI for various income ranges: 31.1% for AGIs below $25k, 34.4% for AGIs $25k-50k, 51.5% for AGIs $50k-75k, 185.9% for AGIs $75k-100k, 424.7% for AGIs $100k-200k)
Total itemized deductions: $22,615 (reported on 4.8% of returns)
Here:
$22,615
State:
$34,948
(% of AGI for various income ranges: 23.4% for AGIs below $25k, 97.6% for AGIs $25k-50k, 211.7% for AGIs $50k-75k, 376.7% for AGIs $75k-100k, 794.3% for AGIs $100k-200k)
Charity contributions: $5,135 (reported on 3.4% of returns)
Here:
$5,135
State:
$13,122
(% of AGI for various income ranges: 15.1% for AGIs $25k-50k, 26.5% for AGIs $50k-75k, 58.5% for AGIs $75k-100k, 170.0% for AGIs $100k-200k)
Taxes paid: $7,641 (reported on 4.7% of returns)
60458:
$7,641
State:
$8,563
(% of AGI for various income ranges: 7.4% for AGIs below $25k, 28.0% for AGIs $25k-50k, 77.6% for AGIs $50k-75k, 142.3% for AGIs $75k-100k, 238.7% for AGIs $100k-200k)
Earned income credit: $2,531 (reported on 24.7% of returns)
Here:
$2,531
State:
$2,311
(% of AGI for various income ranges: 143.8% for AGIs below $25k, 96.4% for AGIs $25k-50k)
Percentage of individuals using paid preparers for their 2020 taxes: 93.1%
Here:
93%
State:
93%
(% for various income ranges: 91.6% for AGIs below $25k, 93.7% for AGIs $25k-50k, 93.3% for AGIs $50k-75k, 94.8% for AGIs $75k-100k, 96.0% for AGIs $100k-200k, 100.0% for AGIs over 200k)
Averages for the 2012 tax year for zip code 60458, filed in 2013:
Average Adjusted Gross Income (AGI) in 2012: $37,105 (Individual Income Tax Returns)
Here:
$37,105
State:
$68,058
Salary/wage: $37,022 (reported on 79.8% of returns)
Here:
$37,022
State:
$55,396
(% of AGI for various income ranges: 65.2% for AGIs below $25k, 80.4% for AGIs $25k-50k, 85.5% for AGIs $50k-75k, 83.9% for AGIs $75k-100k, 80.5% for AGIs $100k-200k)
Taxable interest for individuals: $505 (reported on 21.4% of returns)
This zip code:
$505
Illinois:
$1,969
(% of AGI for various income ranges: 0.5% for AGIs below $25k, 0.2% for AGIs $25k-50k, 0.3% for AGIs $50k-75k, 0.1% for AGIs $75k-100k, 0.3% for AGIs $100k-200k)
Ordinary dividends: $1,534 (reported on 9.0% of returns)
Here:
$1,534
State:
$7,786
(% of AGI for various income ranges: 0.5% for AGIs below $25k, 0.2% for AGIs $25k-50k, 0.3% for AGIs $50k-75k, 0.4% for AGIs $75k-100k, 0.5% for AGIs $100k-200k)
Net capital gain/loss in AGI: +$490 (reported on 4.8% of returns)
Here:
+$490
State:
+$22,183
(% of AGI for various income ranges: 0.4% for AGIs $75k-100k, 0.3% for AGIs $100k-200k)
Profit/loss from business: +$10,373 (reported on 20.5% of returns)
Here:
+$10,373
State:
+$12,903
(% of AGI for various income ranges: 22.2% for AGIs below $25k, 5.5% for AGIs $25k-50k, 1.4% for AGIs $50k-75k, 1.6% for AGIs $75k-100k, 0.7% for AGIs $100k-200k)
Taxable individual retirement arrangement distribution: $10,150 (reported on 5.6% of returns)
60458:
$10,150
Illinois:
$17,929
(% of AGI for various income ranges: 1.6% for AGIs below $25k, 1.7% for AGIs $25k-50k, 1.1% for AGIs $50k-75k, 1.2% for AGIs $75k-100k, 1.9% for AGIs $100k-200k)
Total itemized deductions: $17,973 (26% of AGI, reported on 24.5% of returns)
Here:
$17,973
State:
$26,433
Here:
26.4% of AGI
State:
19.2% of AGI
(% of AGI for various income ranges: 6.0% for AGIs below $25k, 10.5% for AGIs $25k-50k, 13.5% for AGIs $50k-75k, 14.3% for AGIs $75k-100k, 14.8% for AGIs $100k-200k)
Charity contributions: $1,918 (reported on 20.0% of returns)
Here:
$1,918
State:
$4,525
(% of AGI for various income ranges: 0.4% for AGIs below $25k, 0.9% for AGIs $25k-50k, 1.2% for AGIs $50k-75k, 1.2% for AGIs $75k-100k, 1.4% for AGIs $100k-200k)
Taxes paid: $7,325 (reported on 24.3% of returns)
60458:
$7,325
State:
$11,968
(% of AGI for various income ranges: 1.9% for AGIs below $25k, 3.7% for AGIs $25k-50k, 5.3% for AGIs $50k-75k, 6.2% for AGIs $75k-100k, 6.9% for AGIs $100k-200k)
Earned income credit: $2,654 (reported on 28.7% of returns)
Here:
$2,654
State:
$2,349
(% of AGI for various income ranges: 10.4% for AGIs below $25k, 1.4% for AGIs $25k-50k)
Percentage of individuals using paid preparers for their 2012 taxes: 62.6%
Here:
63%
State:
57%
(% for various income ranges: 62.3% for AGIs below $25k, 59.6% for AGIs $25k-50k, 64.4% for AGIs $50k-75k, 70.0% for AGIs $75k-100k, 68.6% for AGIs $100k-200k)
Averages for the 2004 tax year for zip code 60458, filed in 2005:
Average Adjusted Gross Income (AGI) in 2004: $34,996 (Individual Income Tax Returns)
Here:
$34,996
State:
$54,625
Salary/wage: $34,887 (reported on 85.1% of returns)
Here:
$34,887
State:
$46,811
(% of AGI for various income ranges: 72.2% for AGIs below $10k, 73.6% for AGIs $10k-25k, 88.3% for AGIs $25k-50k, 88.9% for AGIs $50k-75k, 89.7% for AGIs $75k-100k, 76.4% for AGIs over 100k)
Taxable interest for individuals: $691 (reported on 34.6% of returns)
This zip code:
$691
Illinois:
$2,101
(% of AGI for various income ranges: 1.9% for AGIs below $10k, 1.2% for AGIs $10k-25k, 0.5% for AGIs $25k-50k, 0.7% for AGIs $50k-75k, 0.3% for AGIs $75k-100k, 0.6% for AGIs over 100k)
Taxable dividends: $847 (reported on 12.1% of returns)
Here:
$847
State:
$4,306
(% of AGI for various income ranges: 1.2% for AGIs below $10k, 0.5% for AGIs $10k-25k, 0.2% for AGIs $25k-50k, 0.3% for AGIs $50k-75k, 0.3% for AGIs $75k-100k, 0.2% for AGIs over 100k)
Net capital gain/loss: +$3,771 (reported on 7.7% of returns)
Here:
+$3,771
State:
+$17,321
(% of AGI for various income ranges: -0.9% for AGIs below $10k, 0.0% for AGIs $10k-25k, 0.3% for AGIs $25k-50k, 0.3% for AGIs $50k-75k, 0.6% for AGIs $75k-100k, 4.8% for AGIs over 100k)
Profit/loss from business: +$9,237 (reported on 16.6% of returns)
Here:
+$9,237
State:
+$11,771
(% of AGI for various income ranges: 19.5% for AGIs below $10k, 15.4% for AGIs $10k-25k, 3.5% for AGIs $25k-50k, 1.7% for AGIs $50k-75k, 1.1% for AGIs $75k-100k, 1.1% for AGIs over 100k)
IRA payment deduction: $2,916 (reported on 2.0% of returns)
60458:
$2,916
Illinois:
$3,087
(% of AGI for various income ranges: 0.2% for AGIs $10k-25k, 0.3% for AGIs $25k-50k, 0.2% for AGIs $50k-75k, 0.1% for AGIs $75k-100k)
Total itemized deductions: $15,090 (26% of AGI, reported on 29.0% of returns)
Here:
$15,090
State:
$20,239
Here:
25.5% of AGI
State:
19.5% of AGI
(% of AGI for various income ranges: 8.5% for AGIs below $10k, 7.8% for AGIs $10k-25k, 11.2% for AGIs $25k-50k, 15.3% for AGIs $50k-75k, 14.2% for AGIs $75k-100k, 13.9% for AGIs over 100k)
Charity contributions deductions: $1,977 (3% of AGI, reported on 25.8% of returns)
Here:
$1,977
State:
$3,719
Here:
3.2% of AGI
State:
3.4% of AGI
(% of AGI for various income ranges: 0.3% for AGIs below $10k, 0.7% for AGIs $10k-25k, 1.2% for AGIs $25k-50k, 2.0% for AGIs $50k-75k, 1.6% for AGIs $75k-100k, 1.9% for AGIs over 100k)
Total tax: $4,107 (reported on 73.5% of returns)
60458:
$4,107
State:
$9,882
(% of AGI for various income ranges: 3.6% for AGIs below $10k, 5.0% for AGIs $10k-25k, 6.5% for AGIs $25k-50k, 9.0% for AGIs $50k-75k, 10.6% for AGIs $75k-100k, 15.7% for AGIs over 100k)
Earned income credit: $1,902 (reported on 21.8% of returns)
Here:
$1,902
State:
$1,788
Percentage of individuals using paid preparers for their 2004 taxes: 63.7%
Here:
64%
State:
61%
(% for various income ranges: 55.8% for AGIs below $10k, 66.4% for AGIs $10k-25k, 63.7% for AGIs $25k-50k, 68.2% for AGIs $50k-75k, 63.7% for AGIs $75k-100k, 66.3% for AGIs over 100k)
Household received Food Stamps/SNAP in the past 12 months: 1,396 Household did not receive Food Stamps/SNAP in the past 12 months: 3,760
Women who had a birth in the past 12 months: 236 (186 now married, 50 unmarried) Women who did not have a birth in the past 12 months: 3,486 (1,279 now married, 2,210 unmarried)
Housing units in zip code 60458 with a mortgage: 1,466 (190 second mortgage, 17 home equity loan, 173 both second mortgage and home equity loan) Houses without a mortgage: 60
Median monthly owner costs for units with a mortgage: $1,722 Median monthly owner costs for units without a mortgage: $844
Residents with income below the poverty level in 2022:
This zip code:
23.8%
Whole state:
11.9%
Residents with income below 50% of the poverty level in 2022:
This zip code:
14.9%
Whole state:
5.7%
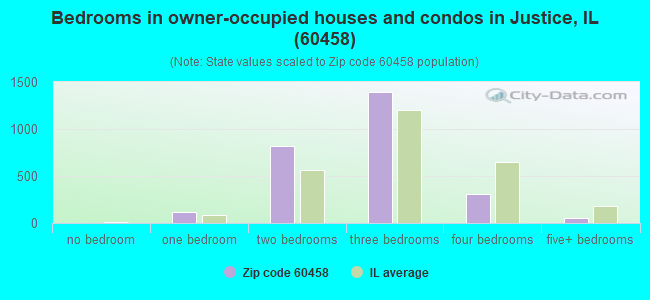
Median number of rooms in houses and condos:
Here:
5.7
State:
6.4
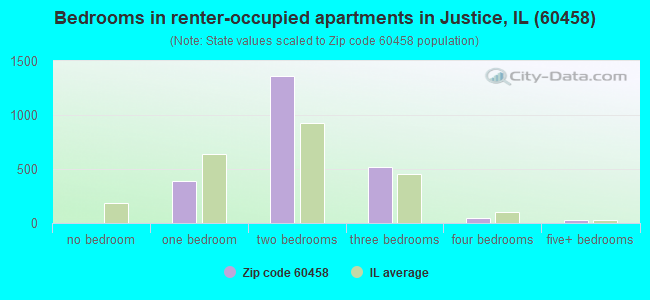
Median number of rooms in apartments:
Here:
4.1
State:
4.1
Notable locations in this zip code not listed on our city pages
Notable locations in zip code 60458: Roberts Park Fire Protection District (A), Roberts Park Fire Protection District Station 2 (B). Display/hide their locations on the map
In group quarters: 2 (-1 institutionalized population)
Size of family households: 933 2-persons, 1,096 3-persons, 800 4-persons, 303 5-persons, 90 6-persons, 105 7-or-more-persons
Size of nonfamily households: 1,456 1-person, 155 2-persons, 120 5-persons
2,173 married couples with children.
865 single-parent households (30 men, 835 women).
54.5% of residents of 60458 zip code speak English at home.
15.5% of residents speak Spanish at home (65% very well, 17% well, 15% not well, 3% not at all).
19.8% of residents speak other Indo-European language at home (48% very well, 34% well, 19% not well).
2.3% of residents speak Asian or Pacific Island language at home (85% very well, 15% well).
8.2% of residents speak other language at home (60% very well, 18% well, 18% not well, 3% not at all).
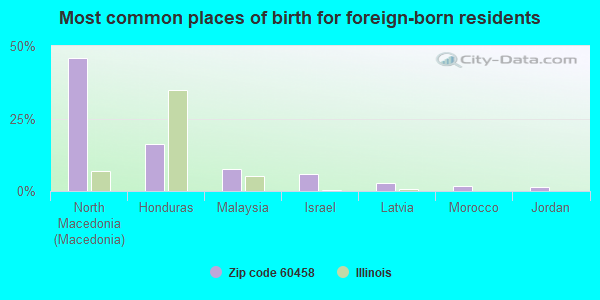
Foreign born population: 3,423 (24.2%) (59.6% of them are naturalized citizens)
This zip code:
24.2%
Whole state:
14.4%
46%North Macedonia (Macedonia)
16%Honduras
7%Malaysia
6%Israel
3%Latvia
2%Morocco
1%Jordan
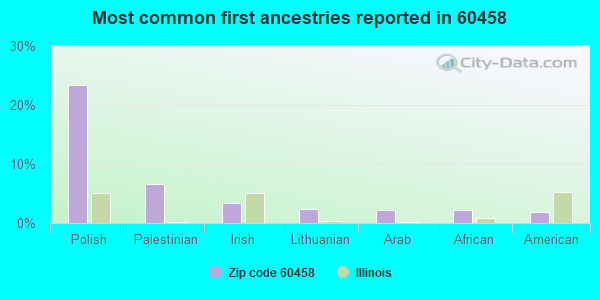
23%Polish
7%Palestinian
3%Irish
2%Lithuanian
2%Arab
2%African
2%American
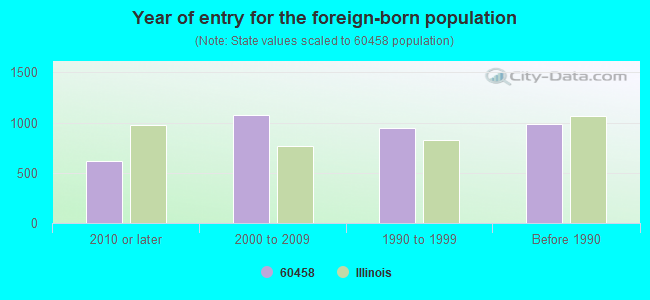
Year of entry for the foreign-born population
6192010 or later
1,0752000 to 2009
9451990 to 1999
984Before 1990
Major facilities with environmental interests located in this zip code:
ALADDIN CLEANERS (8049 S CORK AVE in JUSTICE, IL)
STATE MASTER (Illinois EPA Project) - HAZARDOUS WASTE PROGRAM, AIR PROGRAM AIR MINOR (AIRS/AFS) CRITERIA AND HAZARDOUS AIR POLLUTANT INVENTORY (Inventory of air pollution sources) Small Quantity Generators, between 100 kg and 1000 kg of hazardous waste/month (Resource Conservation and Recovery Act (tracking hazardous waste)) - notification Business SIC classification: DRYCLEANING PLANTS, EXCEPT RUG CLEANING Organizations: MUSCHAL SCOTT (CONTACT/OWNER)
NIKOLAS PAINTING CONTRACTORS (8356 S 78TH CT in JUSTICE, IL)
STATE MASTER (Illinois EPA Project) - HAZARDOUS WASTE PROGRAM Large Quantity Generators, more that 1000 kg of hazardous waste/month (Resource Conservation and Recovery Act (tracking hazardous waste)) - notification Organizations: KARNAVAS VASILIA (CONTACT/OWNER)
REFINERS TRANSPORT & TERMINAL (9001 WEST 79TH PLACE in JUSTICE, IL)
STATE MASTER (Illinois EPA Project) - National Pollutant Discharge Elimination System Permit National Pollutant Discharge Elimination System NON-MAJOR (Tracking pollutant discharge elimination systems) - permit
JUSTICE CLEANERS (8420 S CORK ST in JUSTICE, IL)
STATE MASTER (Illinois EPA Project) - HAZARDOUS WASTE PROGRAM Small Quantity Generators, between 100 kg and 1000 kg of hazardous waste/month (Resource Conservation and Recovery Act (tracking hazardous waste)) - notification Organizations: NON YUN (CONTACT/OWNER)
K L OIL CO UNION 76 (8801 W 84TH PL in JUSTICE, IL)
STATE MASTER (Illinois EPA Project) - AIR PROGRAM, SOLID WASTE PROGRAM AIR MINOR (AIRS/AFS) Business SIC classification: PETROLEUM BULK STATIONS AND TERMINALS
PAPPAS CLEANERS (8405 W 79TH ST in JUSTICE, IL)
STATE MASTER (Illinois EPA Project) - HAZARDOUS WASTE PROGRAM Small Quantity Generators, between 100 kg and 1000 kg of hazardous waste/month (Resource Conservation and Recovery Act (tracking hazardous waste)) - notification Organizations: PHITIE SURGURU (CONTACT/OWNER)
AMOCO 19750 (7900 S CORK in JUSTICE, IL)
STATE MASTER (Illinois EPA Project) - SOLID WASTE PROGRAM, HAZARDOUS WASTE PROGRAM Small Quantity Generators, between 100 kg and 1000 kg of hazardous waste/month (Resource Conservation and Recovery Act (tracking hazardous waste)) - notification Organizations: AMOCO OIL CO (CONTACT/OWNER)
ARTS FLEET ENTERPRISES (8231 S 86TH COURT in JUSTICE, IL)
STATE MASTER (Illinois EPA Project) - HAZARDOUS WASTE PROGRAM Conditionally Exempt Small Quantity Generators, less than 100 kg/month of hazardous waste (Resource Conservation and Recovery Act (tracking hazardous waste)) - notification Organizations: AMAZY MANAGEMENT CO (CONTACT/OWNER)
PRO LUBE INC (8226 S 86TH CT in JUSTICE, IL)
STATE MASTER (Illinois EPA Project) - HAZARDOUS WASTE PROGRAM Conditionally Exempt Small Quantity Generators, less than 100 kg/month of hazardous waste (Resource Conservation and Recovery Act (tracking hazardous waste)) - notification Organizations: PRO LUBE CORP (CONTACT/OWNER)
LOVE KEN EXCAVATING INC (8419 S 79TH AVE in JUSTICE, IL)
TRANSPORTER (Resource Conservation and Recovery Act (tracking hazardous waste)) Organizations: KEN LOVE (CONTACT/OWNER)
INDIAN SPRINGS SCHOOL DISTRICT #109 (80TH AND 82ND AVENUE in JUSTICE, IL)
COMPLIANCE ACTIVITY (Tracking inspections of insecticide, fungicide, and rodenticide, and toxic substances) Alternative names: INDIAN SPRINGS SD #109
CUMMINS ONAN CHGO CARRIER (8745 W 82ND PL in JUSTICE, IL)
Small Quantity Generators, between 100 kg and 1000 kg of hazardous waste/month (Resource Conservation and Recovery Act (tracking hazardous waste)) - notification
Housing units lacking complete plumbing facilities: 1.0% Housing units lacking complete kitchen facilities: 1.0%
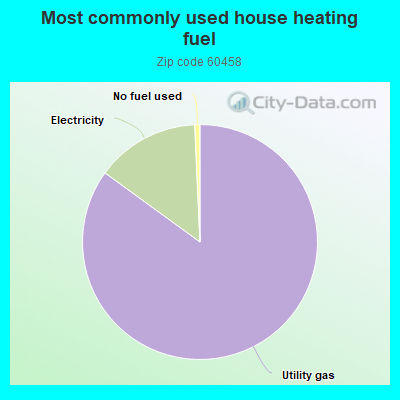
84.6%Utility gas
14.2%Electricity
0.7%No fuel used
Population in 1990: 12,773. Population change in the 1990s: +1,453 (+11.4%).
Place of birth for U.S.-born residents:
This state: 9,436
Northeast: 111
Midwest: 184
South: 552
West: 165
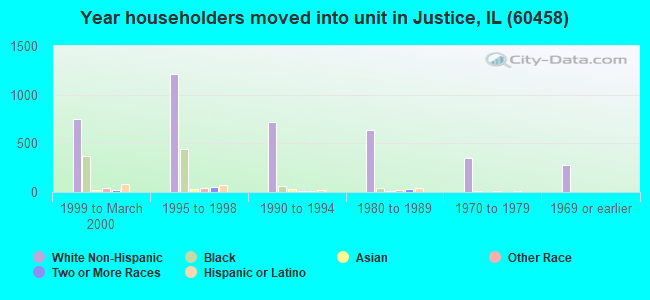
51% of the 60458 zip code residents lived in the same house 5 years ago. Out of people who lived in different houses, 85% lived in this county. Out of people who lived in different counties, 50% lived in Illinois.
90% of the 60458 zip code residents lived in the same house 1 year ago. Out of people who lived in different houses, 87% moved from this county. Out of people who lived in different houses, 3% moved from different county within same state. Out of people who lived in different houses, 4% moved from different state.
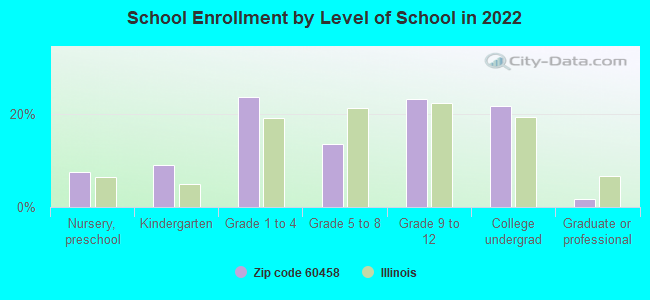
Private vs. public school enrollment:
Students in private schools in grades 1 to 8 (elementary and middle school): 191
Here:
15.1%
Illinois:
13.3%
Students in private schools in grades 9 to 12 (high school): 131
Here:
16.6%
Illinois:
9.9%
Students in private undergraduate colleges: 289
Here:
38.9%
Illinois:
27.4%
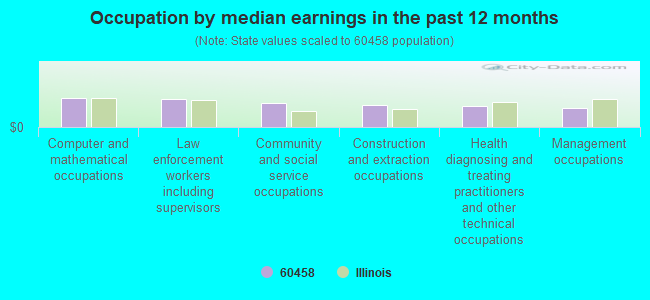
Occupation by median earnings in the past 12 months ($)
108,861Computer and mathematical occupations
102,399Law enforcement workers including supervisors
89,992Community and social service occupations
80,277Construction and extraction occupations
79,026Health diagnosing and treating practitioners and other technical occupations
69,662Management occupations
Companies with federal contracts located in this zip code:
NUTRAGENOMICS (7628 GARDEN LN in OAK LAWN, IL; small business)
$18,000 with Navy for In Vitro Diagnostic Substances, Reagents, Test Kits, and Sets. Signed on 2004-03-11. Completion date: 2004-06-15.
MIKE HARTZ (7116 S CLARK AVE in OAK LAWN, IL; small business)
$2,100 with Office of the Assistant Secretary for Administration and Management for . Signed on 2006-06-13. Effective on 2006-08-15. Completion date: 2006-08-17.
Top industries in this zip code by the number of employees in 2005:
Other Services (except Public Administration): Industrial Launderers (100-249 employees: 1 establishment)
2002 - 2018 National Fire Incident Reporting System (NFIRS) incidents
Based on the data from the years 2002 - 2018 the average number of fires per year is 84. The highest number of reported fire incidents - 127 took place in 2004, and the least - 48 in 2013. The data has a rising trend.
When looking into fire subcategories, the most reports belonged to: Structure Fires (55.6%), and Outside Fires (22.4%).
Fire incident types reported to NFIRS in Zip Code 60458


 Nearest zip codes: 60455, 60501, 60457, 60525, 60465, 60459.


 Based on the data from the years 2002 - 2018 the average number of fires per year is 84. The highest number of reported fire incidents - 127 took place in 2004, and the least - 48 in 2013. The data has a rising trend.
 When looking into fire subcategories, the most reports belonged to: Structure Fires (55.6%), and Outside Fires (22.4%).