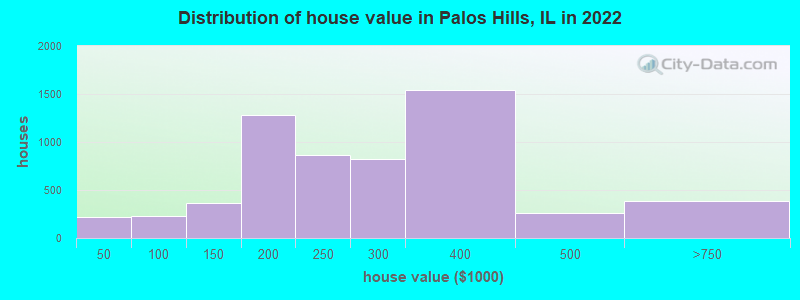
Estimated median house or condo value in 2022: $247,318 (it was $156,100 in 2000)
Palos Hills:
$247,318
IL:
$251,600
Mean prices in 2022:all housing units: $251,655; detached houses: $307,693; townhouses or other attached units: $212,664; in 2-unit structures: $111,871; in 3-to-4-unit structures: $220,153; in 5-or-more-unit structures: $154,835
Median gross rent in 2022: $1,242.
March 2022 cost of living index in Palos Hills: 100.8 (near average, U.S. average is 100)
Percentage of residents living in poverty in 2022: 10.2%
(9.9% for White Non-Hispanic residents, 14.7% for Black residents, 6.2% for Hispanic or Latino residents, 6.5% for two or more races residents)
According to our research of Illinois and other state lists, there were 8 registered sex offenders living in Palos Hills, Illinois as of April 27, 2024. The ratio of all residents to sex offenders in Palos Hills is 2,183 to 1. The ratio of registered sex offenders to all residents in this city is much lower than the state average.
Crime rates in Palos Hills by year
Type
2009
2010
2011
2012
2013
2014
2015
2016
2017
2018
2019
2020
2021
2022
Murders (per 100,000)
0 (0.0)
0 (0.0)
0 (0.0)
0 (0.0)
0 (0.0)
0 (0.0)
0 (0.0)
0 (0.0)
0 (0.0)
0 (0.0)
0 (0.0)
0 (0.0)
0 (0.0)
0 (0.0)
Rapes (per 100,000)
0 (0.0)
0 (0.0)
0 (0.0)
0 (0.0)
0 (0.0)
3 (17.0)
1 (5.7)
1 (5.7)
2 (11.5)
2 (11.5)
3 (17.5)
0 (0.0)
3 (17.8)
1 (5.6)
Robberies (per 100,000)
2 (11.9)
2 (11.4)
4 (22.8)
3 (17.1)
3 (17.0)
6 (34.0)
1 (5.7)
5 (28.4)
1 (5.7)
3 (17.3)
1 (5.8)
6 (35.3)
3 (17.8)
1 (5.6)
Assaults (per 100,000)
6 (35.6)
2 (11.4)
9 (51.3)
3 (17.1)
10 (56.7)
19 (107.5)
6 (34.0)
10 (56.9)
7 (40.2)
13 (75.0)
15 (87.4)
7 (41.1)
3 (17.8)
10 (56.2)
Burglaries (per 100,000)
18 (106.9)
23 (131.5)
21 (119.7)
19 (108.1)
15 (85.0)
23 (130.1)
19 (107.6)
6 (34.1)
14 (80.5)
8 (46.1)
19 (110.7)
8 (47.0)
6 (35.7)
17 (95.6)
Thefts (per 100,000)
179 (1,063)
158 (903.7)
77 (439.1)
110 (626.1)
137 (776.4)
76 (430.0)
78 (441.7)
70 (398.2)
70 (402.4)
68 (392.2)
81 (472.1)
28 (164.6)
31 (184.4)
54 (303.5)
Auto thefts (per 100,000)
11 (65.3)
7 (40.0)
9 (51.3)
11 (62.6)
7 (39.7)
6 (34.0)
7 (39.6)
8 (45.5)
12 (69.0)
8 (46.1)
13 (75.8)
2 (11.8)
8 (47.6)
11 (61.8)
Arson (per 100,000)
0 (0.0)
1 (5.7)
1 (5.7)
1 (5.7)
1 (5.7)
1 (5.7)
0 (0.0)
0 (0.0)
0 (0.0)
0 (0.0)
0 (0.0)
1 (5.9)
0 (0.0)
0 (0.0)
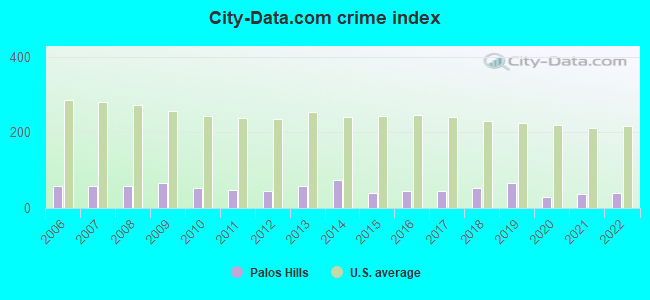
City-Data.com crime index
65.9
54.3
47.2
46.2
56.6
74.3
41.4
46.4
46.2
52.0
65.9
29.6
36.9
41.2
The City-Data.com crime index weighs serious crimes and violent crimes more heavily. Higher means more crime, U.S. average is 246.1. It adjusts for the number of visitors and daily workers commuting into cities.
Latest news from Palos Hills, IL collected exclusively by city-data.com from local newspapers, TV, and radio stations
Ancestries: Polish (38.5%), Italian (5.5%), Irish (4.8%), Jordanian (4.0%), Lithuanian (3.9%), Arab (3.6%).
Current Local Time: CST time zone
Incorporated on 02/25/1959
Elevation: 600 feet
Land area: 4.17 square miles.
Population density: 4,292 people per square mile (average).
5,051 residents are foreign born (18.2% Europe, 5.4% Asia).
This city:
28.3%
Illinois:
14.1%
Median real estate property taxes paid for housing units with mortgages in 2022: $5,440 (2.2%) Median real estate property taxes paid for housing units with no mortgage in 2022: $4,391 (1.8%)
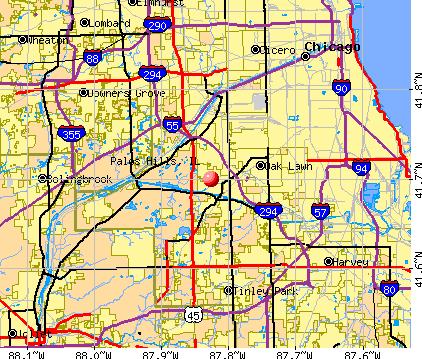
Nearest city with pop. 50,000+: Oak Lawn, IL (3.9 miles , pop. 55,245).
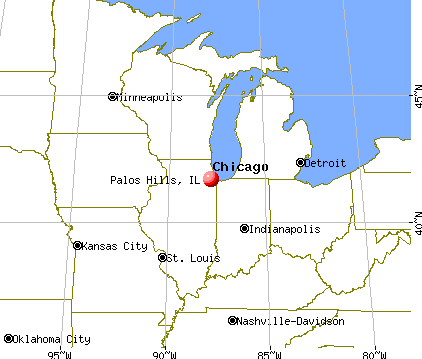
Nearest city with pop. 200,000+: Chicago, IL (12.4 miles , pop. 2,896,016).
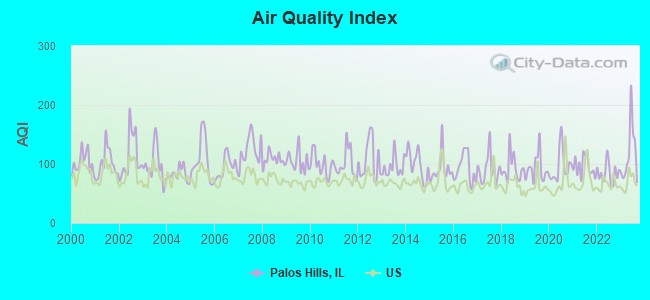
Air Quality Index (AQI) level in 2023 was 116. This is significantly worse than average.
City:
116
U.S.:
73
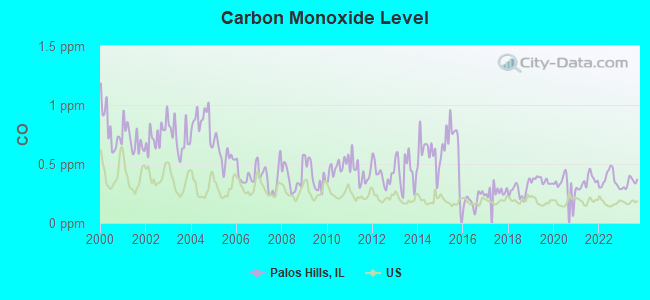
Carbon Monoxide (CO) [ppm] level in 2023 was 0.339. This is worse than average.Closest monitor was 5.9 miles away from the city center.
City:
0.339
U.S.:
0.251
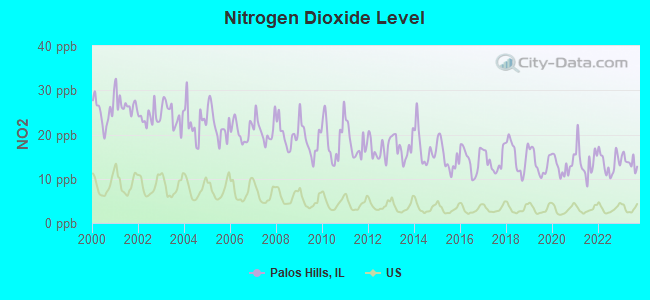
Nitrogen Dioxide (NO2) [ppb] level in 2023 was 13.9. This is significantly worse than average.Closest monitor was 5.2 miles away from the city center.
City:
13.9
U.S.:
5.1
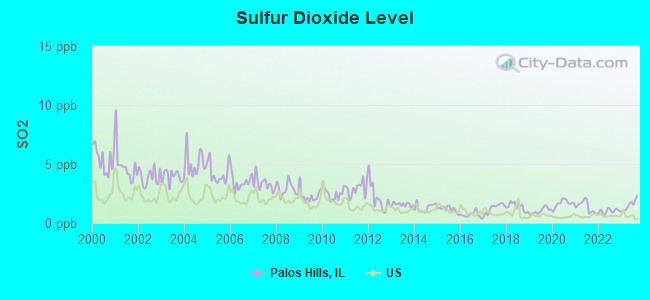
Sulfur Dioxide (SO2) [ppb] level in 2023 was 1.52. This is about average.Closest monitor was 4.9 miles away from the city center.
City:
1.52
U.S.:
1.51
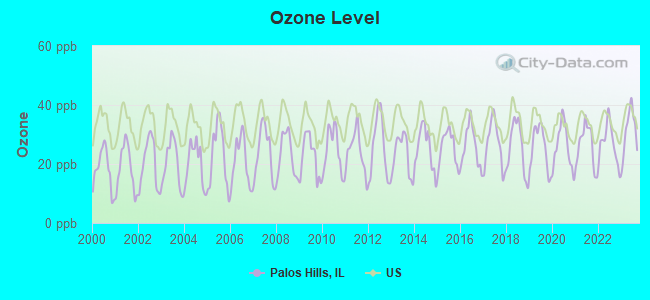
Ozone [ppb] level in 2023 was 31.2. This is about average.Closest monitor was 5.2 miles away from the city center.
City:
31.2
U.S.:
33.3
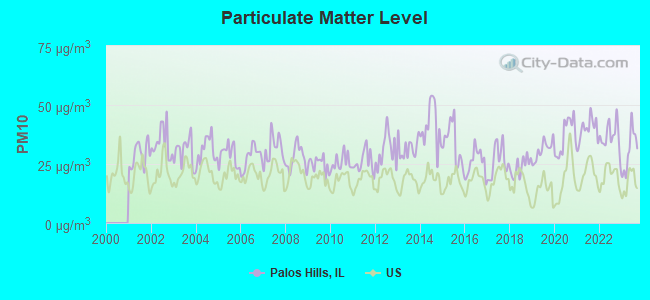
Particulate Matter (PM10) [µg/m3] level in 2023 was 30.6. This is significantly worse than average.Closest monitor was 5.2 miles away from the city center.
City:
30.6
U.S.:
19.2
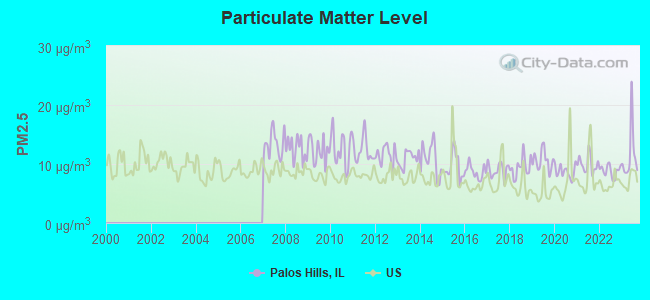
Particulate Matter (PM2.5) [µg/m3] level in 2023 was 11.5. This is significantly worse than average.Closest monitor was 5.2 miles away from the city center.
City:
11.5
U.S.:
8.1
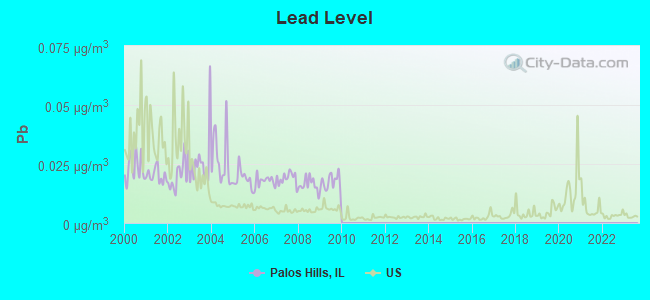
Lead (Pb) [µg/m3] level in 2009 was 0.0173. This is significantly worse than average.Closest monitor was 3.8 miles away from the city center.
City:
0.0173
U.S.:
0.0093
Tornado activity:
Palos Hills-area historical tornado activity is near Illinois state average. It is 54% greater than the overall U.S. average.
On 8/28/1990, a category F5 (max. wind speeds 261-318 mph) tornado 18.8 miles away from the Palos Hills city center killed 29 peopleand injured 350 peopleand causedbetween $50,000 and $500,000 in damages.
On 4/21/1967, a category F4 (max. wind speeds 207-260 mph) tornado 2.0 miles away from the city center killed 33 peopleand injured 500 peopleand causedbetween $5,000,000 and $50,000,000 in damages.
Earthquake activity:
Palos Hills-area historical earthquake activity is significantly above Illinois state average. It is 45% greater than the overall U.S. average.
On 4/18/2008 at 09:36:59, a magnitude 5.4 (5.1 MB, 4.8 MS, 5.4 MW, 5.2 MW, Class: Moderate, Intensity: VI - VII) earthquake occurred 224.6 miles away from the city center On 6/10/1987 at 23:48:54, a magnitude 5.1 (4.9 MB, 4.4 MS, 4.6 MS, 5.1 LG) earthquake occurred 199.1 miles away from Palos Hills center On 4/18/2008 at 09:36:59, a magnitude 5.2 (5.2 MW, Depth: 8.9 mi) earthquake occurred 224.7 miles away from Palos Hills center On 6/28/2004 at 06:10:52, a magnitude 4.2 (4.2 MW, Depth: 6.2 mi, Class: Light, Intensity: IV - V) earthquake occurred 58.0 miles away from Palos Hills center On 6/18/2002 at 17:37:15, a magnitude 5.0 (4.3 MB, 4.6 MW, 5.0 LG) earthquake occurred 256.8 miles away from Palos Hills center On 4/18/2008 at 15:14:16, a magnitude 4.8 (4.5 MB, 4.8 MW, 4.6 MW) earthquake occurred 222.9 miles away from the city center Magnitude types: regional Lg-wave magnitude (LG), body-wave magnitude (MB), surface-wave magnitude (MS), moment magnitude (MW)
Natural disasters:
The number of natural disasters in Cook County (20) is greater than the US average (15). Major Disasters (Presidential) Declared: 15 Emergencies Declared: 4
Causes of natural disasters: Floods: 13, Storms: 12, Tornadoes: 3, Snowstorms: 2, Winter Storms: 2, Blizzard: 1, Hurricane: 1, Snow: 1, Wind: 1, Other: 1 (Note: some incidents may be assigned to more than one category).
Hospitals and medical centers in Palos Hills:
ALLIANCE HOME HEALTHCARE INC. (11001 SOUTHWEST HIGHWAY)
ANCHOR HOME HEALTH CARE AGENCY, INC (9800 SOUTH ROBERTS ROAD, SUITE 100)
CITYWIDE HOME HEALTH SERVICES, INC (8150 W 111TH STREET, STE 11)
FIDELITY HEALTH CARE, INC (8150 W 111TH STREET, SUITE 5)
GLOBAL HOME HEALTH CARE, INC (9848 SOUTH ROBERTS ROAD)
PRESTIGE HEALTHCARE SERVICES OF IL, INC (9800 S ROBERTS ROAD, STE 206)
PRESTIGE HOME HEALTH CARE, INC (7840 W 103RD STREET)
PALOS HILLS HEALTHCARE (10426 SOUTH ROBERTS)
WINDSOR MANOR (10426 S ROBERTS RD)
Amtrak stations near Palos Hills:
7 miles: SUMMIT (ARCHER & CENTER AVE.) . Services: public payphones, free short-term parking, free long-term parking, call for taxi service, public transit connection.
9 miles: LA GRANGE ROAD (LA GRANGE, 25 W. BURLINGTON AVE.) . Services: enclosed waiting area, public payphones, taxi stand, public transit connection.
13 miles: HOMEWOOD (181 1ST ST. & PARK AVE.) . Services: ticket office, enclosed waiting area, public restrooms, public payphones, paid short-term parking, paid long-term parking, public transit connection.
Colleges/Universities in Palos Hills:
Moraine Valley Community College (Full-time enrollment: 12,008; Location: 9000 W. College Parkway; Public; Website: www.morainevalley.edu)
Hair Professionals Career College (Full-time enrollment: 100; Location: 10321 S Roberts Rd; Private, for-profit; Website: www.hairpros.edu)
Other colleges/universities with over 2000 students near Palos Hills:
Saint Xavier University (about 6 miles; Chicago, IL; Full-time enrollment: 3,576)
City Colleges of Chicago-Richard J Daley College (about 7 miles; Chicago, IL; FT enrollment: 7,497)
Morton College (about 10 miles; Cicero, IL; FT enrollment: 3,236)
City Colleges of Chicago-Kennedy-King College (about 11 miles; Chicago, IL; FT enrollment: 5,044)
Chicago State University (about 12 miles; Chicago, IL; FT enrollment: 4,352)
City Colleges of Chicago-Olive-Harvey College (about 13 miles; Chicago, IL; FT enrollment: 4,110)
South Suburban College (about 13 miles; South Holland, IL; FT enrollment: 3,972)
GREEN HILLS PUBLIC LIBRARY DISTRICT (Operating income: $2,291,859; Location: 8611 WEST 103RD STREET; 57,527 books; 4,723 audio materials; 3,506 video materials; 4 local licensed databases; 15 state licensed databases; 1 other licensed databases; 189 print serial subscriptions)
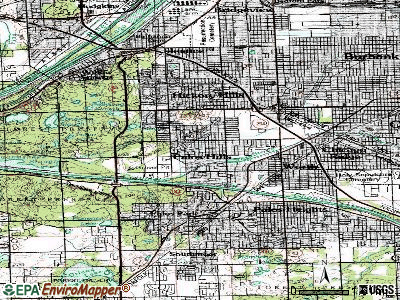
Notable locations in Palos Hills: Palos Hills Golf Club (A), North Palos Fire Protection District Station 2 (B), North Palos Fire Protection District Station 1 (C), Green Hills Public Library (D). Display/hide their locations on the map
Parks in Palos Hills include: Loveland Park (1), Aspen Park (2), Palos Fen Nature Preserve (3), Volunteer Park (4), Osborne Park (5), Michael Park (6), Krasowski Park (7). Display/hide their locations on the map
Cook County has a predicted average indoor radon screening level between 2 and 4 pCi/L (pico curies per liter) - Moderate Potential
Average household size:
This city:
2.4 people
Illinois:
2.6 people
Percentage of family households:
This city:
63.2%
Whole state:
65.8%
Percentage of households with unmarried partners:
This city:
5.3%
Whole state:
6.3%
Likely homosexual households (counted as self-reported same-sex unmarried-partner households)
Lesbian couples: 0.3% of all households
Gay men: 0.2% of all households
120 people in nursing facilities/skilled-nursing facilities in 2010
30 people in emergency and transitional shelters (with sleeping facilities) for people experiencing homelessness in 2010
167 people in nursing homes in 2000
Banks with branches in Palos Hills (2011 data):
Bank of America, National Association: Palos Hills at 10260 South Roberts Road, branch established on 1889/01/01. Info updated 2009/11/18: Bank assets: $1,451,969.3 mil, Deposits: $1,077,176.8 mil, headquarters in Charlotte, NC, positive income, 5782 total offices, Holding Company: Bank Of America Corporation
FirstSecure Bank and Trust Co.: Firstsecure Bank And Trust Co. at 10360 South Roberts Road, branch established on 1977/10/21. Info updated 2009/11/23: Bank assets: $66.0 mil, Deposits: $62.9 mil, local headquarters, negative income in the last year, Commercial Lending Specialization, 1 total offices, Holding Company: Community Holdings Corporation
PNC Bank, National Association: Palos Hills at 10135 S. Roberts Road, branch established on 1924/01/01. Info updated 2012/03/20: Bank assets: $263,309.6 mil, Deposits: $197,343.0 mil, headquarters in Wilmington, DE, positive income, Commercial Lending Specialization, 3085 total offices, Holding Company: Pnc Financial Services Group, Inc., The
Religion statistics for Palos Hills, IL (based on Cook County data)
Religion
Adherents
Congregations
Catholic
1,947,223
376
Evangelical Protestant
432,975
1,484
Other
312,636
403
Mainline Protestant
202,114
630
Black Protestant
148,895
395
Orthodox
53,276
66
None
2,097,556
-
Source: Clifford Grammich, Kirk Hadaway, Richard Houseal, Dale E.Jones, Alexei Krindatch, Richie Stanley and Richard H.Taylor. 2012. 2010 U.S.Religion Census: Religious Congregations & Membership Study. Association of Statisticians of American Religious Bodies. Jones, Dale E., et al. 2002. Congregations and Membership in the United States 2000. Nashville, TN: Glenmary Research Center. Graphs represent county-level data
Aircraft: PIPER PA-28-161 (Category: Land, Seats: 4, Weight: Up to 12,499 Pounds, Speed: 108 mph), Engine: LYCOMING 0-320 SERIES (180 HP) (Reciprocating) N-Number: 47718, N47718, N-47718, Serial Number: 28-7816127, Year manufactured: 1977, Airworthiness Date: 09/28/1977, Certificate Issue Date: 03/26/2001 Registrant (Corporation): Ap Midway Inc, 7900 W 111th St, Palos Hills, IL 60465
Aircraft: PIPER PA-28-161 (Category: Land, Seats: 4, Weight: Up to 12,499 Pounds, Speed: 108 mph), Engine: LYCOMING 0-320 SERIES (180 HP) (Reciprocating) N-Number: 8334W, N8334W, N-8334W, Serial Number: 28-8116150, Year manufactured: 1981, Airworthiness Date: 02/23/1981, Certificate Issue Date: 06/24/2003 Registrant (Co-Owned): Petre I Ghenciu, 8363 W 99th St, Palos Hills, IL 60465, Other Owners: Alex Ghenciu
Aircraft: EVEKTOR-AEROTECHNIK AS SPORTSTAR SL (Category: Land, Seats: 2, Weight: Up to 12,499 Pounds), Engine: ROTAX 912ULS SERIES (100 HP) (4 Cycle) N-Number: 903SL, N903SL, N-903SL, Serial Number: 2008 0003, Year manufactured: 2008, Airworthiness Date: 07/03/2008, Certificate Issue Date: 04/07/2016 Registrant (Individual): Mark G Filar, 10623 S 82nd Ave, Palos Hills, IL 60465
Home Mortgage Disclosure Act Aggregated Statistics For Year 2009 (Based on 1 full and 2 partial tracts)
A) FHA, FSA/RHS & VA Home Purchase Loans
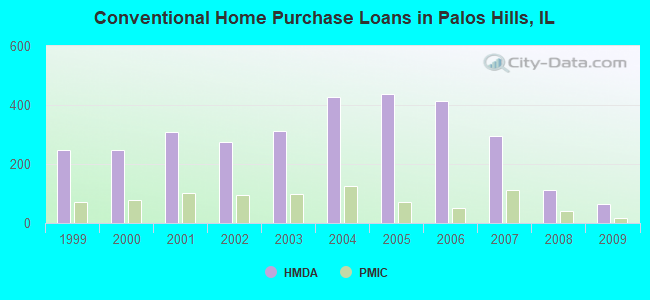
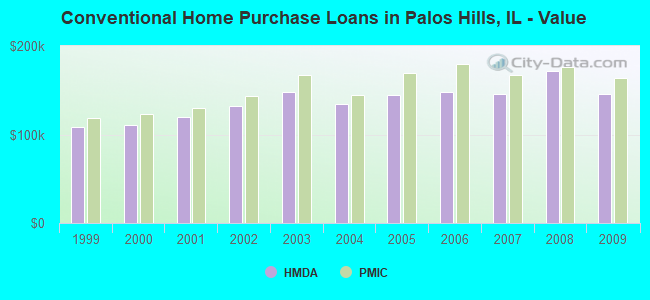
B) Conventional Home Purchase Loans
C) Refinancings
D) Home Improvement Loans
E) Loans on Dwellings For 5+ Families
F) Non-occupant Loans on < 5 Family Dwellings (A B C & D)
G) Loans On Manufactured Home Dwelling (A B C & D)
Number
Average Value
Number
Average Value
Number
Average Value
Number
Average Value
Number
Average Value
Number
Average Value
Number
Average Value
LOANS ORIGINATED
36
$171,672
64
$145,744
300
$171,804
11
$110,444
1
$209,650
7
$112,324
2
$165,745
APPLICATIONS APPROVED, NOT ACCEPTED
4
$173,410
5
$187,708
27
$203,614
1
$5,470
0
$0
0
$0
0
$0
APPLICATIONS DENIED
9
$159,736
13
$188,335
118
$182,118
2
$91,080
0
$0
2
$109,795
1
$5,470
APPLICATIONS WITHDRAWN
6
$156,610
7
$119,913
39
$148,391
0
$0
0
$0
1
$43,760
0
$0
FILES CLOSED FOR INCOMPLETENESS
2
$167,710
4
$209,838
36
$186,641
0
$0
0
$0
0
$0
0
$0
Aggregated Statistics For Year 2008 (Based on 1 full and 2 partial tracts)
A) FHA, FSA/RHS & VA Home Purchase Loans
B) Conventional Home Purchase Loans
C) Refinancings
D) Home Improvement Loans
E) Loans on Dwellings For 5+ Families
F) Non-occupant Loans on < 5 Family Dwellings (A B C & D)
G) Loans On Manufactured Home Dwelling (A B C & D)
Number
Average Value
Number
Average Value
Number
Average Value
Number
Average Value
Number
Average Value
Number
Average Value
Number
Average Value
LOANS ORIGINATED
31
$166,143
111
$171,583
220
$172,677
22
$81,603
2
$5,768,025
17
$193,132
0
$0
APPLICATIONS APPROVED, NOT ACCEPTED
4
$172,860
11
$154,067
33
$180,392
1
$74,620
0
$0
2
$121,090
0
$0
APPLICATIONS DENIED
11
$198,133
33
$172,076
132
$181,490
13
$103,454
1
$128,450
6
$134,402
1
$18,040
APPLICATIONS WITHDRAWN
2
$146,190
14
$139,716
37
$183,996
1
$157,020
0
$0
5
$113,774
0
$0
FILES CLOSED FOR INCOMPLETENESS
2
$90,215
13
$201,333
17
$205,514
1
$75,010
0
$0
0
$0
0
$0
Aggregated Statistics For Year 2007 (Based on 1 full and 2 partial tracts)
A) FHA, FSA/RHS & VA Home Purchase Loans
B) Conventional Home Purchase Loans
C) Refinancings
D) Home Improvement Loans
E) Loans on Dwellings For 5+ Families
F) Non-occupant Loans on < 5 Family Dwellings (A B C & D)
G) Loans On Manufactured Home Dwelling (A B C & D)
Number
Average Value
Number
Average Value
Number
Average Value
Number
Average Value
Number
Average Value
Number
Average Value
Number
Average Value
LOANS ORIGINATED
2
$200,875
296
$145,561
329
$171,439
43
$78,967
6
$994,268
28
$136,467
0
$0
APPLICATIONS APPROVED, NOT ACCEPTED
0
$0
33
$155,267
63
$172,039
14
$43,697
0
$0
5
$181,126
0
$0
APPLICATIONS DENIED
1
$91,280
71
$143,080
167
$203,882
26
$66,688
1
$253,620
15
$146,219
1
$44,270
APPLICATIONS WITHDRAWN
0
$0
33
$172,423
62
$199,080
7
$119,174
0
$0
4
$175,218
0
$0
FILES CLOSED FOR INCOMPLETENESS
0
$0
7
$155,377
25
$253,743
2
$211,740
0
$0
0
$0
0
$0
Aggregated Statistics For Year 2006 (Based on 1 full and 2 partial tracts)
A) FHA, FSA/RHS & VA Home Purchase Loans
B) Conventional Home Purchase Loans
C) Refinancings
D) Home Improvement Loans
E) Loans on Dwellings For 5+ Families
F) Non-occupant Loans on < 5 Family Dwellings (A B C & D)
G) Loans On Manufactured Home Dwelling (A B C & D)
Number
Average Value
Number
Average Value
Number
Average Value
Number
Average Value
Number
Average Value
Number
Average Value
Number
Average Value
LOANS ORIGINATED
5
$127,044
415
$147,539
344
$167,789
51
$96,239
7
$3,415,403
33
$168,405
1
$3,830
APPLICATIONS APPROVED, NOT ACCEPTED
0
$0
33
$127,935
57
$167,802
6
$88,475
0
$0
6
$223,733
0
$0
APPLICATIONS DENIED
1
$184,260
99
$150,788
142
$179,519
24
$78,307
0
$0
5
$95,294
3
$24,560
APPLICATIONS WITHDRAWN
0
$0
42
$128,689
94
$178,486
9
$76,600
1
$142,120
5
$193,946
0
$0
FILES CLOSED FOR INCOMPLETENESS
0
$0
4
$212,020
32
$159,034
1
$19,230
0
$0
0
$0
0
$0
Aggregated Statistics For Year 2005 (Based on 1 full and 2 partial tracts)
A) FHA, FSA/RHS & VA Home Purchase Loans
B) Conventional Home Purchase Loans
C) Refinancings
D) Home Improvement Loans
E) Loans on Dwellings For 5+ Families
F) Non-occupant Loans on < 5 Family Dwellings (A B C & D)
G) Loans On Manufactured Home Dwelling (A B C & D)
Number
Average Value
Number
Average Value
Number
Average Value
Number
Average Value
Number
Average Value
Number
Average Value
Number
Average Value
LOANS ORIGINATED
4
$172,342
437
$145,051
415
$156,877
48
$81,545
4
$315,150
31
$122,449
2
$41,660
APPLICATIONS APPROVED, NOT ACCEPTED
0
$0
45
$165,778
52
$182,438
9
$49,663
0
$0
4
$269,005
0
$0
APPLICATIONS DENIED
0
$0
92
$151,887
154
$177,130
30
$65,095
1
$136,650
14
$118,175
2
$8,470
APPLICATIONS WITHDRAWN
0
$0
42
$150,518
116
$172,508
15
$120,129
1
$528,830
8
$136,586
1
$19,200
FILES CLOSED FOR INCOMPLETENESS
0
$0
9
$134,997
24
$186,760
3
$72,040
0
$0
1
$129,830
0
$0
Aggregated Statistics For Year 2004 (Based on 1 full and 2 partial tracts)
A) FHA, FSA/RHS & VA Home Purchase Loans
B) Conventional Home Purchase Loans
C) Refinancings
D) Home Improvement Loans
E) Loans on Dwellings For 5+ Families
F) Non-occupant Loans on < 5 Family Dwellings (A B C & D)
G) Loans On Manufactured Home Dwelling (A B C & D)
Number
Average Value
Number
Average Value
Number
Average Value
Number
Average Value
Number
Average Value
Number
Average Value
Number
Average Value
LOANS ORIGINATED
8
$159,246
427
$134,371
430
$146,362
48
$59,379
7
$340,550
51
$98,961
2
$47,830
APPLICATIONS APPROVED, NOT ACCEPTED
2
$177,750
55
$143,166
71
$160,723
6
$44,855
0
$0
7
$158,817
0
$0
APPLICATIONS DENIED
4
$147,335
70
$131,824
161
$164,505
23
$38,506
0
$0
9
$115,461
2
$33,615
APPLICATIONS WITHDRAWN
3
$128,150
32
$143,444
125
$163,769
4
$40,872
2
$276,295
7
$174,229
0
$0
FILES CLOSED FOR INCOMPLETENESS
0
$0
7
$126,610
38
$161,823
4
$70,115
0
$0
1
$45,300
0
$0
Aggregated Statistics For Year 2003 (Based on 1 full and 2 partial tracts)
A) FHA, FSA/RHS & VA Home Purchase Loans
B) Conventional Home Purchase Loans
C) Refinancings
D) Home Improvement Loans
E) Loans on Dwellings For 5+ Families
F) Non-occupant Loans on < 5 Family Dwellings (A B C & D)
Number
Average Value
Number
Average Value
Number
Average Value
Number
Average Value
Number
Average Value
Number
Average Value
LOANS ORIGINATED
13
$155,200
312
$148,404
919
$125,378
39
$44,616
14
$785,957
24
$133,730
APPLICATIONS APPROVED, NOT ACCEPTED
2
$158,245
20
$165,046
94
$128,399
5
$31,276
1
$546,600
3
$109,527
APPLICATIONS DENIED
5
$174,398
33
$158,318
199
$141,569
23
$43,842
0
$0
5
$88,536
APPLICATIONS WITHDRAWN
2
$149,275
20
$141,732
142
$147,336
10
$47,562
0
$0
4
$111,898
FILES CLOSED FOR INCOMPLETENESS
1
$219,040
5
$212,832
23
$129,459
1
$35,530
0
$0
0
$0
Aggregated Statistics For Year 2002 (Based on 1 full and 2 partial tracts)
A) FHA, FSA/RHS & VA Home Purchase Loans
B) Conventional Home Purchase Loans
C) Refinancings
D) Home Improvement Loans
E) Loans on Dwellings For 5+ Families
F) Non-occupant Loans on < 5 Family Dwellings (A B C & D)
Number
Average Value
Number
Average Value
Number
Average Value
Number
Average Value
Number
Average Value
Number
Average Value
LOANS ORIGINATED
22
$137,936
275
$132,200
589
$125,296
28
$35,928
3
$308,943
19
$106,340
APPLICATIONS APPROVED, NOT ACCEPTED
1
$113,630
19
$121,541
62
$141,440
4
$21,940
0
$0
1
$7,690
APPLICATIONS DENIED
2
$147,140
24
$152,138
125
$122,412
15
$43,102
0
$0
7
$80,386
APPLICATIONS WITHDRAWN
0
$0
18
$143,257
91
$130,978
2
$25,610
1
$251,840
5
$153,158
FILES CLOSED FOR INCOMPLETENESS
0
$0
9
$124,704
32
$122,150
3
$26,253
0
$0
0
$0
Aggregated Statistics For Year 2001 (Based on 1 full and 2 partial tracts)
A) FHA, FSA/RHS & VA Home Purchase Loans
B) Conventional Home Purchase Loans
C) Refinancings
D) Home Improvement Loans
E) Loans on Dwellings For 5+ Families
F) Non-occupant Loans on < 5 Family Dwellings (A B C & D)
Number
Average Value
Number
Average Value
Number
Average Value
Number
Average Value
Number
Average Value
Number
Average Value
LOANS ORIGINATED
26
$121,419
309
$119,365
476
$123,472
46
$28,870
7
$287,561
16
$99,210
APPLICATIONS APPROVED, NOT ACCEPTED
1
$184,750
17
$124,878
39
$120,258
5
$23,446
1
$142,120
0
$0
APPLICATIONS DENIED
2
$122,565
25
$124,114
116
$126,624
14
$21,403
0
$0
4
$88,778
APPLICATIONS WITHDRAWN
3
$147,667
18
$174,032
86
$126,905
6
$21,950
0
$0
2
$276,410
FILES CLOSED FOR INCOMPLETENESS
2
$111,235
5
$85,936
26
$128,632
1
$27,330
0
$0
1
$112,520
Aggregated Statistics For Year 2000 (Based on 1 full and 2 partial tracts)
A) FHA, FSA/RHS & VA Home Purchase Loans
B) Conventional Home Purchase Loans
C) Refinancings
D) Home Improvement Loans
E) Loans on Dwellings For 5+ Families
F) Non-occupant Loans on < 5 Family Dwellings (A B C & D)
Number
Average Value
Number
Average Value
Number
Average Value
Number
Average Value
Number
Average Value
Number
Average Value
LOANS ORIGINATED
23
$127,308
249
$110,915
115
$94,541
36
$28,641
5
$260,196
8
$69,586
APPLICATIONS APPROVED, NOT ACCEPTED
1
$23,500
15
$97,314
29
$97,726
13
$34,237
0
$0
0
$0
APPLICATIONS DENIED
3
$124,697
26
$101,757
74
$93,677
13
$28,079
0
$0
0
$0
APPLICATIONS WITHDRAWN
2
$122,325
21
$128,375
44
$108,126
6
$46,805
0
$0
1
$120,250
FILES CLOSED FOR INCOMPLETENESS
0
$0
4
$125,502
13
$130,195
2
$33,910
0
$0
0
$0
Aggregated Statistics For Year 1999 (Based on 1 full and 2 partial tracts)
A) FHA, FSA/RHS & VA Home Purchase Loans
B) Conventional Home Purchase Loans
C) Refinancings
D) Home Improvement Loans
E) Loans on Dwellings For 5+ Families
F) Non-occupant Loans on < 5 Family Dwellings (A B C & D)
2002 - 2018 National Fire Incident Reporting System (NFIRS) incidents
According to the data from the years 2002 - 2018 the average number of fires per year is 83. The highest number of fires - 101 took place in 2008, and the least - 32 in 2018. The data has a decreasing trend.
When looking into fire subcategories, the most incidents belonged to: Structure Fires (54.5%), and Outside Fires (27.5%).
Fire incident types reported to NFIRS in Palos Hills, IL


 Recent articles from our blog. Our writers, many of them Ph.D. graduates or candidates, create easy-to-read articles on a wide variety of topics.

 (3.9 miles


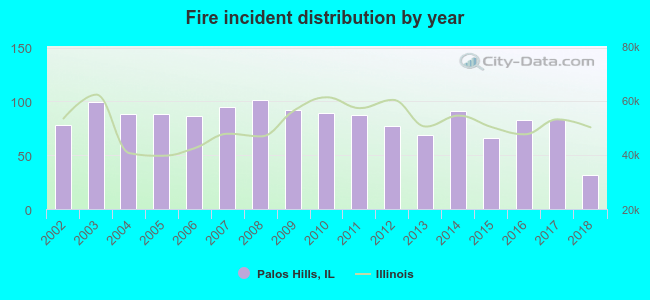 According to the data from the years 2002 - 2018 the average number of fires per year is 83. The highest number of fires - 101 took place in 2008, and the least - 32 in 2018. The data has a decreasing trend.
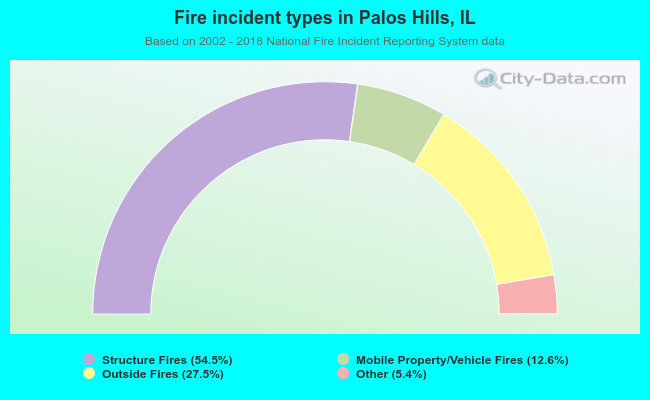 When looking into fire subcategories, the most incidents belonged to: Structure Fires (54.5%), and Outside Fires (27.5%).