Estimated zip code population in 2022: 3,465 Zip code population in 2010: 3,580 Zip code population in 2000: 3,641
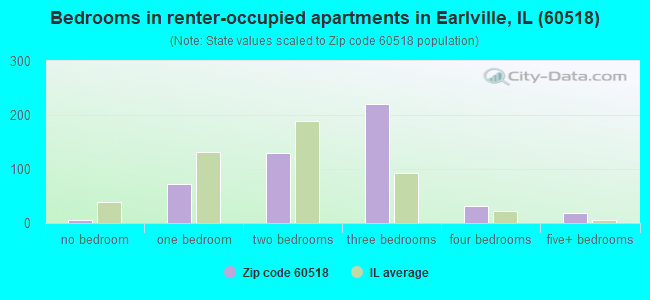
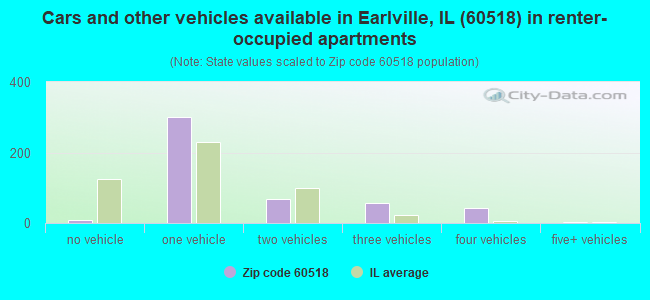
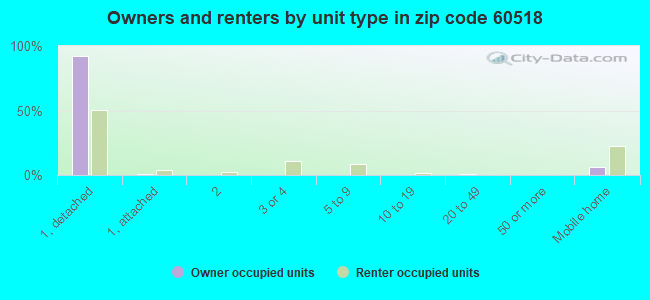
Houses and condos: 1,615 Renter-occupied apartments: 488
% of renters here:
32%
State:
33%
March 2022 cost of living index in zip code 60518: 85.3 (less than average, U.S. average is 100)
Land area: 133.9 sq. mi. Water area: 0.2 sq. mi.
Population density: 26 people per square mile
(very low).
OSM Map
General Map
Google Map
MSN Map
OSM Map
General Map
Google Map
MSN Map
OSM Map
General Map
Google Map
MSN Map
OSM Map
General Map
Google Map
MSN Map
Please wait while loading the map...
Real estate property taxes paid for housing units in 2022:
This zip code:
2.1% ($3,344)
Illinois:
2.0% ($4,912)
Median real estate property taxes paid for housing units with mortgages in 2022: $3,311 (2.1%) Median real estate property taxes paid for housing units with no mortgage in 2022: $3,382 (2.2%)
Business Search- 14 Million verified businesses
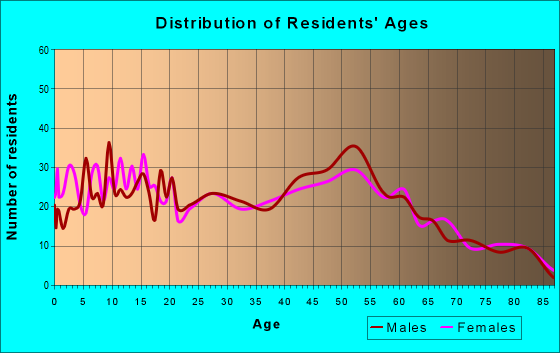
Males: 1,830
(52.8%)
Females: 1,635
(47.2%)
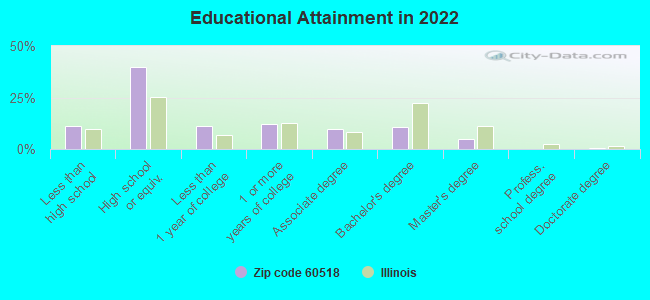
For population 25 years and over in 60518:
High school or higher: 87.4%
Bachelor's degree or higher: 15.6%
Graduate or professional degree: 5.3%
Unemployed: 4.5%
Mean travel time to work (commute): 36.6 minutes
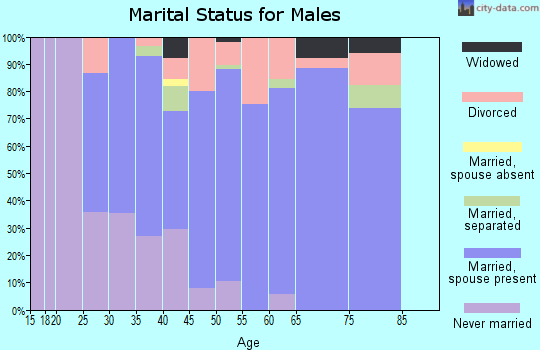
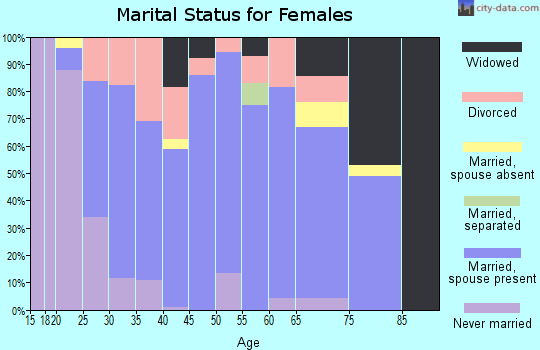
For population 15 years and over in 60518:
Never married: 30.1%
Now married: 51.6%
Separated: 2.5%
Widowed: 5.4%
Divorced: 10.3%
Zip code 60518 compared to state average:
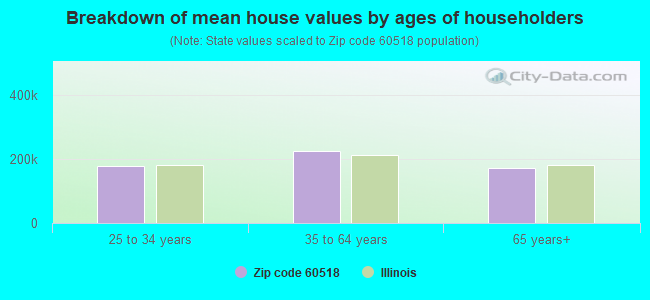
Median house value below state average.
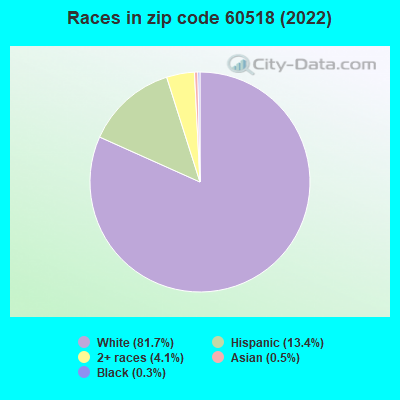
Black race population percentage significantly below state average.
Median age above state average.
Foreign-born population percentage significantly below state average.
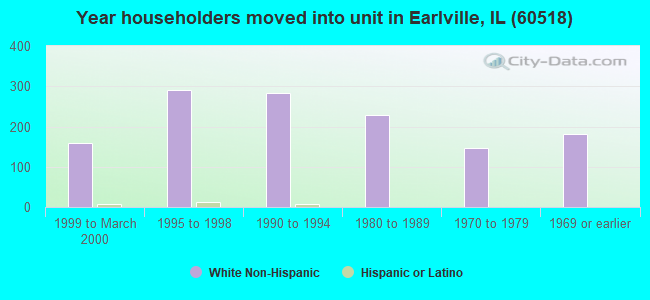
Length of stay since moving in significantly above state average.
Number of college students below state average.
Percentage of population with a bachelor's degree or higher significantly below state average.
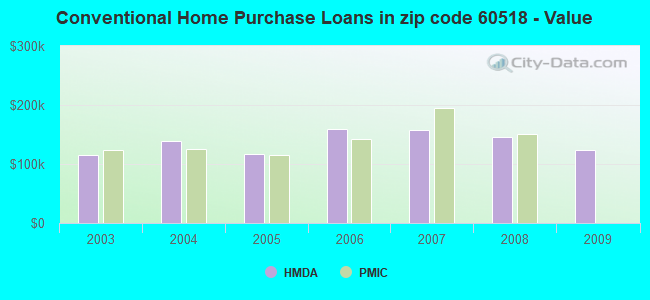
Estimated median house/condo value in 2022: $156,474
60518:
$156,474
Illinois:
$251,600
According to our research of Illinois and other state lists, there were 5 registered sex offenders living in 60518 zip code as of April 27, 2024. The ratio of all residents to sex offenders in zip code 60518 is 679 to 1. The ratio of registered sex offenders to all residents in this zip code is near the state average.
Median resident age:
This zip code:
44.4 years
Illinois median age:
39.1 years
Average household size:
This zip code:
2.2 people
Illinois:
2.4 people
Averages for the 2020 tax year for zip code 60518, filed in 2021:
Average Adjusted Gross Income (AGI) in 2020: $56,790 (Individual Income Tax Returns)
Here:
$56,790
State:
$82,626
Salary/wage: $46,572 (reported on 80.8% of returns)
Here:
$46,572
State:
$66,640
(% of AGI for various income ranges: 1049.2% for AGIs below $25k, 3531.5% for AGIs $25k-50k, 6112.1% for AGIs $50k-75k, 8863.1% for AGIs $75k-100k, 15745.4% for AGIs $100k-200k)
Taxable interest for individuals: $1,108 (reported on 36.5% of returns)
This zip code:
$1,108
Illinois:
$2,376
(% of AGI for various income ranges: 25.7% for AGIs below $25k, 31.5% for AGIs $25k-50k, 29.5% for AGIs $50k-75k, 60.0% for AGIs $75k-100k, 209.2% for AGIs $100k-200k)
Ordinary dividends: $2,685 (reported on 20.4% of returns)
Here:
$2,685
State:
$9,061
(% of AGI for various income ranges: 28.1% for AGIs below $25k, 34.2% for AGIs $25k-50k, 42.6% for AGIs $50k-75k, 72.3% for AGIs $75k-100k, 240.0% for AGIs $100k-200k)
Net capital gain/loss in AGI: +$5,822 (reported on 16.2% of returns)
Here:
+$5,822
State:
+$31,684
(% of AGI for various income ranges: 22.2% for AGIs below $25k, 43.0% for AGIs $25k-50k, 44.2% for AGIs $50k-75k, 200.0% for AGIs $75k-100k, 303.8% for AGIs $100k-200k)
Profit/loss from business: +$10,924 (reported on 12.6% of returns)
Here:
+$10,924
State:
+$12,175
(% of AGI for various income ranges: 111.6% for AGIs below $25k, 117.0% for AGIs $25k-50k, 103.7% for AGIs $50k-75k, 271.5% for AGIs $75k-100k, 726.9% for AGIs $100k-200k)
Taxable individual retirement arrangement distribution: $13,286 (reported on 8.4% of returns)
60518:
$13,286
Illinois:
$21,613
(% of AGI for various income ranges: 56.2% for AGIs below $25k, 68.5% for AGIs $25k-50k, 98.9% for AGIs $50k-75k, 314.6% for AGIs $75k-100k, 637.7% for AGIs $100k-200k)
Total itemized deductions: $23,725 (reported on 4.8% of returns)
Here:
$23,725
State:
$34,948
(% of AGI for various income ranges: 134.1% for AGIs below $25k, 323.2% for AGIs $50k-75k, 606.2% for AGIs $100k-200k)
Charity contributions: $6,660 (reported on 3.0% of returns)
Here:
$6,660
State:
$13,122
(% of AGI for various income ranges: 36.1% for AGIs $25k-50k, 164.6% for AGIs $100k-200k)
Taxes paid: $7,488 (reported on 4.8% of returns)
60518:
$7,488
State:
$8,563
(% of AGI for various income ranges: 25.9% for AGIs below $25k, 135.8% for AGIs $50k-75k, 188.5% for AGIs $100k-200k)
Earned income credit: $1,974 (reported on 13.8% of returns)
Here:
$1,974
State:
$2,311
(% of AGI for various income ranges: 73.2% for AGIs below $25k, 55.5% for AGIs $25k-50k)
Percentage of individuals using paid preparers for their 2020 taxes: 94.6%
Here:
95%
State:
93%
(% for various income ranges: 92.6% for AGIs below $25k, 95.3% for AGIs $25k-50k, 96.0% for AGIs $50k-75k, 94.7% for AGIs $75k-100k, 95.7% for AGIs $100k-200k, 100.0% for AGIs over 200k)
Averages for the 2012 tax year for zip code 60518, filed in 2013:
Average Adjusted Gross Income (AGI) in 2012: $53,980 (Individual Income Tax Returns)
Here:
$53,980
State:
$68,058
Salary/wage: $39,642 (reported on 82.9% of returns)
Here:
$39,642
State:
$55,396
(% of AGI for various income ranges: 72.0% for AGIs below $25k, 75.5% for AGIs $25k-50k, 75.5% for AGIs $50k-75k, 76.4% for AGIs $75k-100k, 57.7% for AGIs $100k-200k, 17.1% for AGIs over 200k)
Taxable interest for individuals: $1,223 (reported on 40.2% of returns)
This zip code:
$1,223
Illinois:
$1,969
(% of AGI for various income ranges: 1.7% for AGIs below $25k, 0.6% for AGIs $25k-50k, 1.2% for AGIs $50k-75k, 0.6% for AGIs $75k-100k, 1.0% for AGIs $100k-200k, 0.8% for AGIs over 200k)
Ordinary dividends: $2,234 (reported on 23.2% of returns)
Here:
$2,234
State:
$7,786
(% of AGI for various income ranges: 0.9% for AGIs below $25k, 0.6% for AGIs $25k-50k, 0.4% for AGIs $50k-75k, 0.3% for AGIs $75k-100k, 1.9% for AGIs $100k-200k, 1.3% for AGIs over 200k)
Net capital gain/loss in AGI: +$9,550 (reported on 12.2% of returns)
Here:
+$9,550
State:
+$22,183
(% of AGI for various income ranges: 0.4% for AGIs below $25k, 1.7% for AGIs $25k-50k, 0.3% for AGIs $50k-75k, 2.5% for AGIs $100k-200k, 8.4% for AGIs over 200k)
Profit/loss from business: +$9,075 (reported on 14.6% of returns)
Here:
+$9,075
State:
+$12,903
(% of AGI for various income ranges: 6.6% for AGIs below $25k, 3.4% for AGIs $25k-50k, 1.1% for AGIs $50k-75k, 1.8% for AGIs $75k-100k, 3.8% for AGIs $100k-200k)
Taxable individual retirement arrangement distribution: $11,144 (reported on 11.0% of returns)
60518:
$11,144
Illinois:
$17,929
(% of AGI for various income ranges: 4.2% for AGIs below $25k, 1.9% for AGIs $25k-50k, 1.8% for AGIs $50k-75k, 1.5% for AGIs $75k-100k, 4.7% for AGIs $100k-200k)
Self-employment retirement plans: $23,400 (reported on 1.2% of returns)
60518:
$23,400
Illinois:
$24,666
Total itemized deductions: $20,100 (25% of AGI, reported on 32.3% of returns)
Here:
$20,100
State:
$26,433
Here:
24.6% of AGI
State:
19.2% of AGI
(% of AGI for various income ranges: 10.0% for AGIs below $25k, 13.3% for AGIs $25k-50k, 12.4% for AGIs $50k-75k, 12.8% for AGIs $75k-100k, 13.8% for AGIs $100k-200k, 8.6% for AGIs over 200k)
Charity contributions: $2,256 (reported on 20.7% of returns)
Here:
$2,256
State:
$4,525
(% of AGI for various income ranges: 0.6% for AGIs below $25k, 0.6% for AGIs $25k-50k, 1.0% for AGIs $50k-75k, 1.0% for AGIs $75k-100k, 1.2% for AGIs $100k-200k, 0.5% for AGIs over 200k)
Taxes paid: $8,062 (reported on 32.3% of returns)
60518:
$8,062
State:
$11,968
(% of AGI for various income ranges: 3.0% for AGIs below $25k, 4.0% for AGIs $25k-50k, 5.0% for AGIs $50k-75k, 5.6% for AGIs $75k-100k, 5.7% for AGIs $100k-200k, 4.4% for AGIs over 200k)
Earned income credit: $1,900 (reported on 17.1% of returns)
Here:
$1,900
State:
$2,349
(% of AGI for various income ranges: 5.7% for AGIs below $25k, 0.9% for AGIs $25k-50k)
Percentage of individuals using paid preparers for their 2012 taxes: 59.1%
Here:
59%
State:
57%
(% for various income ranges: 47.5% for AGIs below $25k, 58.5% for AGIs $25k-50k, 64.0% for AGIs $50k-75k, 66.7% for AGIs $75k-100k, 80.0% for AGIs $100k-200k, 100.0% for AGIs over 200k)
Averages for the 2004 tax year for zip code 60518, filed in 2005:
Average Adjusted Gross Income (AGI) in 2004: $43,355 (Individual Income Tax Returns)
Here:
$43,355
State:
$54,625
Salary/wage: $35,755 (reported on 84.8% of returns)
Here:
$35,755
State:
$46,811
(% of AGI for various income ranges: 150.6% for AGIs below $10k, 71.2% for AGIs $10k-25k, 75.5% for AGIs $25k-50k, 82.9% for AGIs $50k-75k, 82.6% for AGIs $75k-100k, 36.9% for AGIs over 100k)
Taxable interest for individuals: $1,467 (reported on 49.6% of returns)
This zip code:
$1,467
Illinois:
$2,101
(% of AGI for various income ranges: 12.0% for AGIs below $10k, 2.9% for AGIs $10k-25k, 2.1% for AGIs $25k-50k, 1.1% for AGIs $50k-75k, 0.8% for AGIs $75k-100k, 1.6% for AGIs over 100k)
Taxable dividends: $1,798 (reported on 25.8% of returns)
Here:
$1,798
State:
$4,306
(% of AGI for various income ranges: 4.2% for AGIs below $10k, 0.8% for AGIs $10k-25k, 0.7% for AGIs $25k-50k, 0.5% for AGIs $50k-75k, 0.8% for AGIs $75k-100k, 2.1% for AGIs over 100k)
Net capital gain/loss: +$13,389 (reported on 16.1% of returns)
Here:
+$13,389
State:
+$17,321
(% of AGI for various income ranges: 1.9% for AGIs below $10k, 0.0% for AGIs $10k-25k, 1.0% for AGIs $25k-50k, 0.7% for AGIs $50k-75k, 1.0% for AGIs $75k-100k, 17.7% for AGIs over 100k)
Profit/loss from business: +$8,441 (reported on 16.0% of returns)
Here:
+$8,441
State:
+$11,771
(% of AGI for various income ranges: 8.4% for AGIs below $10k, 4.8% for AGIs $10k-25k, 2.4% for AGIs $25k-50k, 2.0% for AGIs $50k-75k, -0.0% for AGIs $75k-100k, 6.2% for AGIs over 100k)
Profit/loss from farming: +$5,338 (reported on 8.5% of returns)
Here:
+$5,338
State:
+$2,327
(% of AGI for various income ranges: -21.1% for AGIs below $10k, 0.0% for AGIs $10k-25k, 1.3% for AGIs $25k-50k, 2.7% for AGIs $50k-75k, 2.9% for AGIs $75k-100k, -0.6% for AGIs over 100k)
IRA payment deduction: $2,667 (reported on 2.4% of returns)
60518:
$2,667
Illinois:
$3,087
Self-employed pension: $4,500 (reported on 0.7% of returns)
Here:
$4,500
Illinois:
$16,965
Total itemized deductions: $15,701 (22% of AGI, reported on 33.6% of returns)
Here:
$15,701
State:
$20,239
Here:
22.4% of AGI
State:
19.5% of AGI
(% of AGI for various income ranges: 37.0% for AGIs below $10k, 11.0% for AGIs $10k-25k, 13.2% for AGIs $25k-50k, 13.5% for AGIs $50k-75k, 14.1% for AGIs $75k-100k, 7.4% for AGIs over 100k)
Charity contributions deductions: $2,135 (3% of AGI, reported on 25.4% of returns)
Here:
$2,135
State:
$3,719
Here:
3.2% of AGI
State:
3.4% of AGI
(% of AGI for various income ranges: 0.7% for AGIs below $10k, 0.7% for AGIs $10k-25k, 1.3% for AGIs $25k-50k, 1.2% for AGIs $50k-75k, 1.1% for AGIs $75k-100k, 1.6% for AGIs over 100k)
Total tax: $5,812 (reported on 74.4% of returns)
60518:
$5,812
State:
$9,882
(% of AGI for various income ranges: 4.1% for AGIs below $10k, 4.5% for AGIs $10k-25k, 6.4% for AGIs $25k-50k, 8.7% for AGIs $50k-75k, 10.4% for AGIs $75k-100k, 16.4% for AGIs over 100k)
Earned income credit: $1,531 (reported on 12.8% of returns)
Here:
$1,531
State:
$1,788
Percentage of individuals using paid preparers for their 2004 taxes: 66.6%
Here:
67%
State:
61%
(% for various income ranges: 58.8% for AGIs below $10k, 64.6% for AGIs $10k-25k, 71.6% for AGIs $25k-50k, 68.4% for AGIs $50k-75k, 66.9% for AGIs $75k-100k, 74.7% for AGIs over 100k)
Likely homosexual households (counted as self-reported same-sex unmarried-partner households)
Lesbian couples: 0.4% of all households
Gay men: 0.4% of all households
Household received Food Stamps/SNAP in the past 12 months: 224 Household did not receive Food Stamps/SNAP in the past 12 months: 1,314
Women who had a birth in the past 12 months: 45 (45 now married, 0 unmarried) Women who did not have a birth in the past 12 months: 672 (261 now married, 411 unmarried)
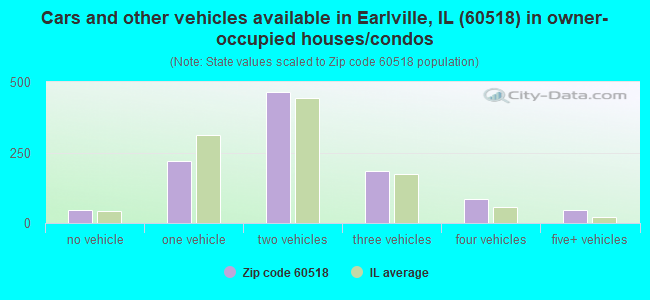
Housing units in zip code 60518 with a mortgage: 564 (30 second mortgage, 24 both second mortgage and home equity loan) Houses without a mortgage: 35
Median monthly owner costs for units with a mortgage: $1,269 Median monthly owner costs for units without a mortgage: $670
Residents with income below the poverty level in 2022:
This zip code:
17.2%
Whole state:
11.9%
Residents with income below 50% of the poverty level in 2022:
This zip code:
7.4%
Whole state:
5.7%
Median number of rooms in houses and condos:
Here:
6.6
State:
6.4
Median number of rooms in apartments:
Here:
5.0
State:
4.1
Notable locations in this zip code not listed on our city pages
Notable locations in zip code 60518: Johnson Farm (A), Serena Fire Protection District Harding Station (B), Earlville Fire Protection District (C). Display/hide their locations on the map
Cemeteries: Cottage Hill Cemetery (1), East Paw Paw Cemetery (2), Carter Cemetery (3), Old Stevens Cemetery (4), South Paw Paw Cemetery (5), Saint Theresa Cemetery (6), Gouldtown Cemetery (7). Display/hide their locations on the map
320 married couples with children.
228 single-parent households (58 men, 170 women).
92.0% of residents of 60518 zip code speak English at home.
6.4% of residents speak Spanish at home (58% very well, 22% well, 20% not well).
0.9% of residents speak other Indo-European language at home (86% very well, 14% not well).
0.2% of residents speak Asian or Pacific Island language at home (100% very well).
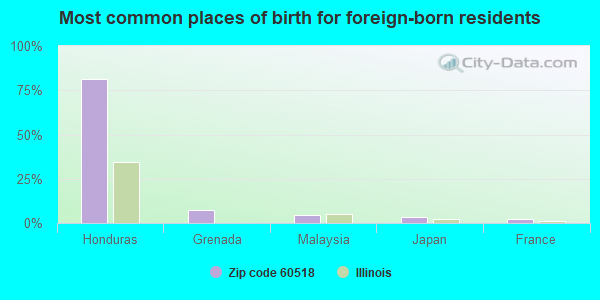
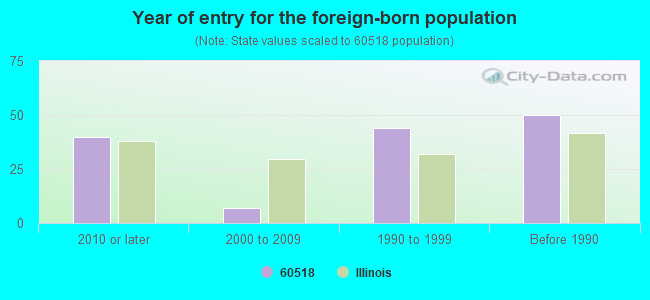
Foreign born population: 140 (4.0%) (38.8% of them are naturalized citizens)
This zip code:
4.0%
Whole state:
14.4%
81%Honduras
7%Grenada
4%Malaysia
4%Japan
2%France
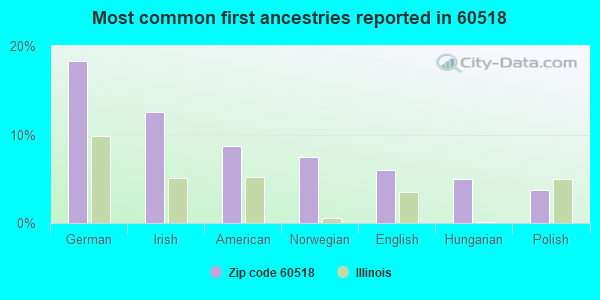
18%German
13%Irish
9%American
7%Norwegian
6%English
5%Hungarian
4%Polish
Year of entry for the foreign-born population
402010 or later
72000 to 2009
441990 to 1999
50Before 1990
Facilities with environmental interests located in this zip code:
LIK-WID-FLO INC (US HIGHWAY 34 in EARLVILLE, IL)
STATE MASTER (Illinois EPA Project) - AIR PROGRAM AIR MINOR (AIRS/AFS) COMPLIANCE ACTIVITY (Tracking inspections of insecticide, fungicide, and rodenticide, and toxic substances) Business SIC classification: FARM SUPPLIES
MULLINS GRAIN CO. (2386 SUYDAM ROAD in EARLVILLE, IL)
STATE MASTER (Illinois EPA Project) - AIR PROGRAM AIR MINOR (AIRS/AFS) CRITERIA AND HAZARDOUS AIR POLLUTANT INVENTORY (Inventory of air pollution sources) Business SIC classification: GRAIN AND FIELD BEANS Alternative names: ROLLO ELEVATOR INCORPORATED
LASALLE COUNTY FARM SUPPLY CO (CITY OF in EARLVILLE, IL)
STATE MASTER (Illinois EPA Project) - AIR PROGRAM AIR MINOR (AIRS/AFS) Business SIC classification: FARM SUPPLIES
HARDING GRADE SCHOOL (1643 N 40TH RD in EARLVILLE, IL)
(Geographic Names Information System) (National Center for Education Statistics) - STATE ID-3505000202002 Organizations: COMMUNITY UNIT SCH DIST 2 (SCHOOL DISTRICT)
PLANO CUSTOM MOLDING (E 12TH RD in EARLVILLE, IL)
STATE MASTER (Illinois EPA Project) - HAZARDOUS WASTE PROGRAM Conditionally Exempt Small Quantity Generators, less than 100 kg/month of hazardous waste (Resource Conservation and Recovery Act (tracking hazardous waste)) - notification
MARATHON ELECTRIC CO (OLD HWY 34 in EARLVILLE, IL)
AIR MINOR (AIRS/AFS) (Resource Conservation and Recovery Act (tracking hazardous waste)) Business SIC classification: MOTORS AND GENERATORS Alternative names: MARATHON ELECTRIC MFG CORP
AMOCO FERTILIZER PLANT (EAST WATER ST in EARLVILLE, IL)
(Resource Conservation and Recovery Act (tracking hazardous waste))
LASALLE COUNTY FARM SUPPLY CO (RTE 34 in EARLVILLE, IL)
(Resource Conservation and Recovery Act (tracking hazardous waste))
PLANO MOLDING CO-EARLVILLE (EAST 12TH ROAD in EARLVILLE, IL)
National Pollutant Discharge Elimination System NON-MAJOR (Tracking pollutant discharge elimination systems) - permit Organizations: PLANO MOLDING COMPANY (CONTACT/OWNER)
LONIE WILLIAM M (CORNER EAST 12TH AND NORTH 42ND STREETS in EARLVILLE, IL)
National Pollutant Discharge Elimination System NON-MAJOR (Tracking pollutant discharge elimination systems) - permit Organizations: LONIE?WILLIAM M. (CONTACT/OWNER)
Alternative names: LONIE?WILLIAM M.
COOK STORAGE SHED?ELMER (BOX 679 in EARLVILLE, IL)
National Pollutant Discharge Elimination System NON-MAJOR (Tracking pollutant discharge elimination systems) - permit Organizations: COOK?ELMER (CONTACT/OWNER)
Alternative names: COOK, ELMER STORAGE SHED
IDOT (BRG 050-0190 in EARLVILLE, IL)
Small Quantity Generators, between 100 kg and 1000 kg of hazardous waste/month (Resource Conservation and Recovery Act (tracking hazardous waste)) - notification
LIK-WID FLO INC (PO BOX 370 in EARLSVILLE, IL)
COMPLIANCE ACTIVITY (Tracking inspections of insecticide, fungicide, and rodenticide, and toxic substances)
Housing units lacking complete plumbing facilities: 1.7% Housing units lacking complete kitchen facilities: 1.3%
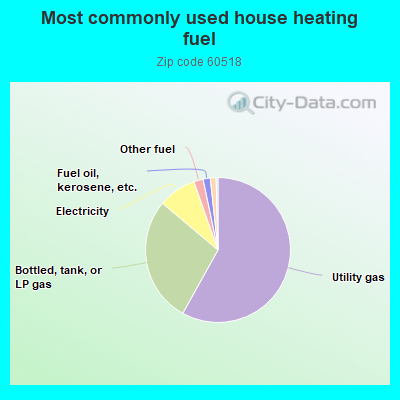
58.2%Utility gas
28.1%Bottled, tank, or LP gas
8.5%Electricity
2.1%Other fuel
1.6%Fuel oil, kerosene, etc.
1.3%Wood
Population in 1990: 2,305. Population change in the 1990s: +1,336 (+58.0%).
Place of birth for U.S.-born residents:
This state: 2,892
Northeast: 19
Midwest: 222
South: 57
West: 124
65% of the 60518 zip code residents lived in the same house 5 years ago. Out of people who lived in different houses, 48% lived in this county. Out of people who lived in different counties, 50% lived in Illinois.
89% of the 60518 zip code residents lived in the same house 1 year ago. Out of people who lived in different houses, 48% moved from this county. Out of people who lived in different houses, 45% moved from different county within same state. Out of people who lived in different houses, 6% moved from different state.
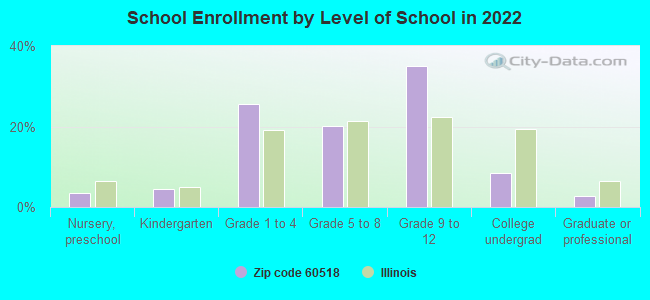
Private vs. public school enrollment:
Students in private schools in grades 1 to 8 (elementary and middle school): 12
Here:
5.0%
Illinois:
13.3%
Students in private schools in grades 9 to 12 (high school):
Here:
0.0%
Illinois:
9.9%
Students in private undergraduate colleges: 3
Here:
8.0%
Illinois:
27.4%
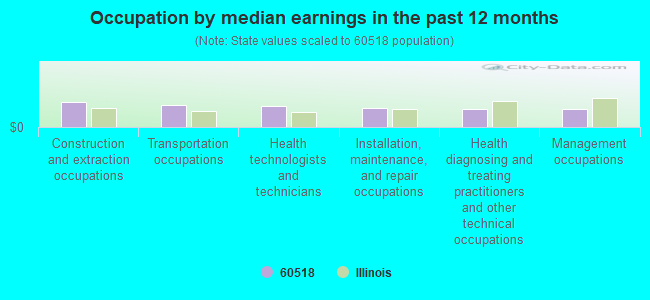
Occupation by median earnings in the past 12 months ($)
73,218Construction and extraction occupations
65,412Transportation occupations
62,416Health technologists and technicians
57,341Installation, maintenance, and repair occupations
54,594Health diagnosing and treating practitioners and other technical occupations
53,495Management occupations
Top industries in this zip code by the number of employees in 2005:
Other Services (except Public Administration): Religious Organizations (10-19 employees: 1 establishment, 5-9 employees: 1 establishment, 1-4 employees: 5 establishments)
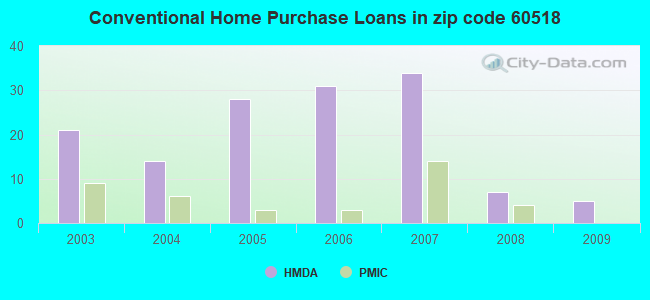
Detailed PMIC statistics for the following Tracts:0018.00
2002 - 2018 National Fire Incident Reporting System (NFIRS) incidents
According to the data from the years 2002 - 2018 the average number of fire incidents per year is 21. The highest number of reported fires - 41 took place in 2007, and the least - 2 in 2004. The data has a decreasing trend.
When looking into fire subcategories, the most incidents belonged to: Outside Fires (44.1%), and Structure Fires (36.0%).
Fire incident types reported to NFIRS in Zip Code 60518
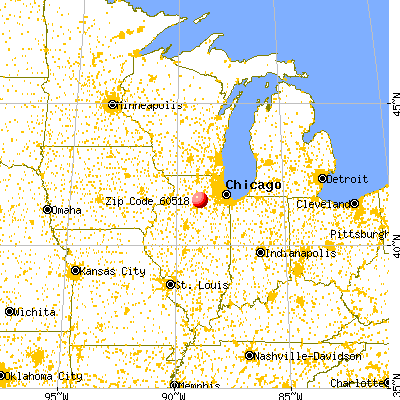


 Nearest zip codes: 61353, 60531, 61342, 60550, 61318, 60530.
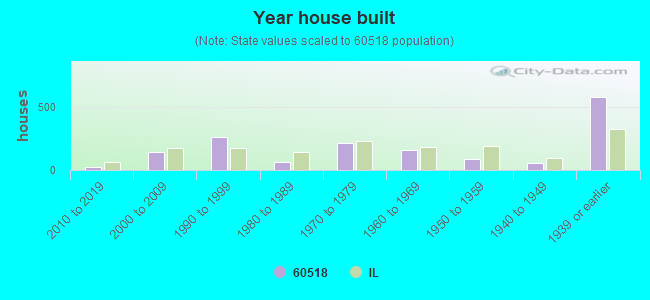


 According to the data from the years 2002 - 2018 the average number of fire incidents per year is 21. The highest number of reported fires - 41 took place in 2007, and the least - 2 in 2004. The data has a decreasing trend.
 When looking into fire subcategories, the most incidents belonged to: Outside Fires (44.1%), and Structure Fires (36.0%).