Estimated zip code population in 2022: 6,681 Zip code population in 2010: 7,124 Zip code population in 2000: 6,944
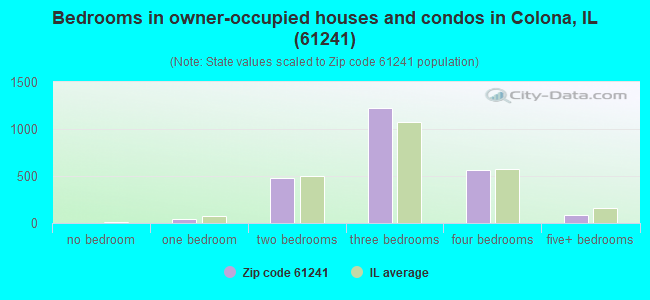
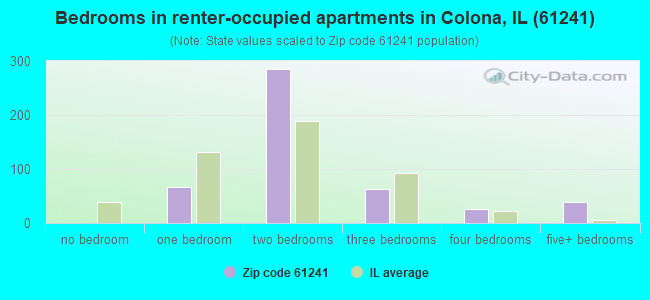
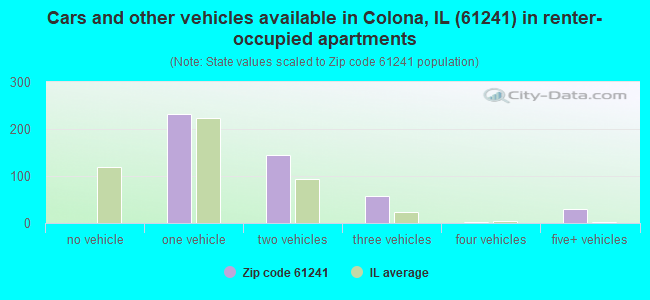
Houses and condos: 3,092 Renter-occupied apartments: 476
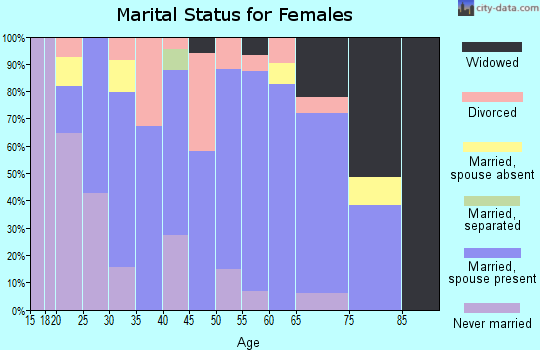
% of renters here:
17%
State:
33%
March 2022 cost of living index in zip code 61241: 84.7 (less than average, U.S. average is 100)
Land area: 18.0 sq. mi. Water area: 1.1 sq. mi.
Population density: 370 people per square mile
(very low).
OSM Map
General Map
Google Map
MSN Map
OSM Map
General Map
Google Map
MSN Map
OSM Map
General Map
Google Map
MSN Map
OSM Map
General Map
Google Map
MSN Map
Please wait while loading the map...
Real estate property taxes paid for housing units in 2022:
This zip code:
2.0% ($3,311)
Illinois:
2.0% ($4,912)
Median real estate property taxes paid for housing units with mortgages in 2022: $3,311 (2.0%) Median real estate property taxes paid for housing units with no mortgage in 2022: $3,295 (2.0%)
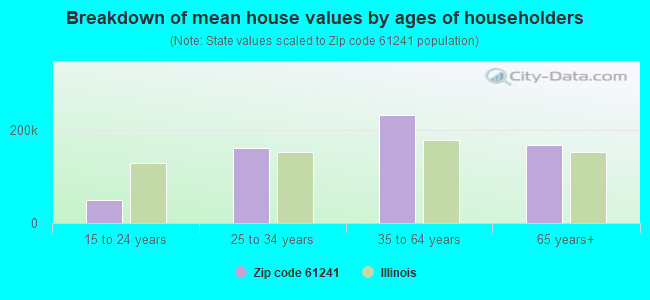
Estimated median house/condo value in 2022: $164,471
61241:
$164,471
Illinois:
$251,600
According to our research of Illinois and other state lists, there were 10 registered sex offenders living in 61241 zip code as of April 27, 2024. The ratio of all residents to sex offenders in zip code 61241 is 687 to 1. The ratio of registered sex offenders to all residents in this zip code is near the state average.
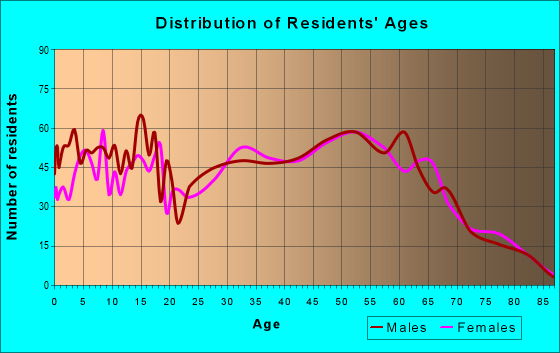
Median resident age:
This zip code:
43.8 years
Illinois median age:
39.1 years
Average household size:
This zip code:
2.3 people
Illinois:
2.4 people
Averages for the 2020 tax year for zip code 61241, filed in 2021:
Average Adjusted Gross Income (AGI) in 2020: $62,719 (Individual Income Tax Returns)
Here:
$62,719
State:
$82,626
Salary/wage: $53,490 (reported on 82.7% of returns)
Here:
$53,490
State:
$66,640
(% of AGI for various income ranges: 998.6% for AGIs below $25k, 3200.4% for AGIs $25k-50k, 5805.8% for AGIs $50k-75k, 7999.4% for AGIs $75k-100k, 15085.1% for AGIs $100k-200k)
Taxable interest for individuals: $751 (reported on 33.0% of returns)
This zip code:
$751
Illinois:
$2,376
(% of AGI for various income ranges: 17.4% for AGIs below $25k, 18.3% for AGIs $25k-50k, 27.9% for AGIs $50k-75k, 56.2% for AGIs $75k-100k, 61.1% for AGIs $100k-200k)
Ordinary dividends: $2,555 (reported on 15.2% of returns)
Here:
$2,555
State:
$9,061
(% of AGI for various income ranges: 19.6% for AGIs below $25k, 21.7% for AGIs $25k-50k, 30.0% for AGIs $50k-75k, 103.2% for AGIs $75k-100k, 89.1% for AGIs $100k-200k)
Net capital gain/loss in AGI: +$5,580 (reported on 12.2% of returns)
Here:
+$5,580
State:
+$31,684
(% of AGI for various income ranges: 3.5% for AGIs below $25k, 19.7% for AGIs $25k-50k, 42.1% for AGIs $50k-75k, 57.4% for AGIs $75k-100k, 318.3% for AGIs $100k-200k)
Profit/loss from business: +$8,557 (reported on 11.0% of returns)
Here:
+$8,557
State:
+$12,175
(% of AGI for various income ranges: 51.1% for AGIs below $25k, 95.4% for AGIs $25k-50k, 131.9% for AGIs $50k-75k, 127.1% for AGIs $75k-100k, 320.3% for AGIs $100k-200k)
Taxable individual retirement arrangement distribution: $12,358 (reported on 9.2% of returns)
61241:
$12,358
Illinois:
$21,613
(% of AGI for various income ranges: 72.3% for AGIs below $25k, 90.7% for AGIs $25k-50k, 112.1% for AGIs $50k-75k, 204.7% for AGIs $75k-100k, 423.7% for AGIs $100k-200k)
Total itemized deductions: $23,327 (reported on 3.3% of returns)
Here:
$23,327
State:
$34,948
(% of AGI for various income ranges: 120.3% for AGIs $25k-50k, 187.1% for AGIs $75k-100k, 310.9% for AGIs $100k-200k)
Charity contributions: $8,086 (reported on 2.1% of returns)
Here:
$8,086
State:
$13,122
(% of AGI for various income ranges: 13.7% for AGIs $25k-50k, 51.8% for AGIs $75k-100k, 84.0% for AGIs $100k-200k)
Taxes paid: $6,773 (reported on 3.3% of returns)
61241:
$6,773
State:
$8,563
(% of AGI for various income ranges: 31.7% for AGIs $25k-50k, 59.4% for AGIs $75k-100k, 91.7% for AGIs $100k-200k)
Earned income credit: $2,172 (reported on 12.8% of returns)
Here:
$2,172
State:
$2,311
(% of AGI for various income ranges: 69.6% for AGIs below $25k, 59.9% for AGIs $25k-50k)
Percentage of individuals using paid preparers for their 2020 taxes: 94.3%
Here:
94%
State:
93%
(% for various income ranges: 92.6% for AGIs below $25k, 96.4% for AGIs $25k-50k, 94.5% for AGIs $50k-75k, 95.3% for AGIs $75k-100k, 94.3% for AGIs $100k-200k, 83.3% for AGIs over 200k)
Averages for the 2012 tax year for zip code 61241, filed in 2013:
Average Adjusted Gross Income (AGI) in 2012: $51,229 (Individual Income Tax Returns)
Here:
$51,229
State:
$68,058
Salary/wage: $43,456 (reported on 86.3% of returns)
Here:
$43,456
State:
$55,396
(% of AGI for various income ranges: 73.4% for AGIs below $25k, 72.3% for AGIs $25k-50k, 77.8% for AGIs $50k-75k, 81.8% for AGIs $75k-100k, 80.8% for AGIs $100k-200k, 23.1% for AGIs over 200k)
Taxable interest for individuals: $625 (reported on 36.3% of returns)
This zip code:
$625
Illinois:
$1,969
(% of AGI for various income ranges: 1.2% for AGIs below $25k, 0.5% for AGIs $25k-50k, 0.3% for AGIs $50k-75k, 0.4% for AGIs $75k-100k, 0.4% for AGIs $100k-200k, 0.4% for AGIs over 200k)
Ordinary dividends: $1,339 (reported on 14.9% of returns)
Here:
$1,339
State:
$7,786
(% of AGI for various income ranges: 0.4% for AGIs below $25k, 0.4% for AGIs $25k-50k, 0.4% for AGIs $50k-75k, 0.4% for AGIs $75k-100k, 0.5% for AGIs $100k-200k)
Net capital gain/loss in AGI: +$5,120 (reported on 8.8% of returns)
Here:
+$5,120
State:
+$22,183
(% of AGI for various income ranges: 0.2% for AGIs $75k-100k, 3.6% for AGIs $100k-200k)
Profit/loss from business: +$7,767 (reported on 11.4% of returns)
Here:
+$7,767
State:
+$12,903
(% of AGI for various income ranges: 3.5% for AGIs below $25k, 2.6% for AGIs $25k-50k, 1.6% for AGIs $50k-75k, 1.6% for AGIs $75k-100k, 1.4% for AGIs $100k-200k)
Taxable individual retirement arrangement distribution: $9,360 (reported on 8.8% of returns)
61241:
$9,360
Illinois:
$17,929
(% of AGI for various income ranges: 1.9% for AGIs below $25k, 1.6% for AGIs $25k-50k, 2.1% for AGIs $50k-75k, 2.0% for AGIs $75k-100k, 1.3% for AGIs $100k-200k)
Total itemized deductions: $17,388 (18% of AGI, reported on 26.0% of returns)
Here:
$17,388
State:
$26,433
Here:
18.1% of AGI
State:
19.2% of AGI
(% of AGI for various income ranges: 4.3% for AGIs below $25k, 6.9% for AGIs $25k-50k, 8.7% for AGIs $50k-75k, 10.8% for AGIs $75k-100k, 12.1% for AGIs $100k-200k, 4.4% for AGIs over 200k)
Charity contributions: $3,039 (reported on 17.3% of returns)
Here:
$3,039
State:
$4,525
(% of AGI for various income ranges: 0.6% for AGIs $25k-50k, 0.7% for AGIs $50k-75k, 1.3% for AGIs $75k-100k, 1.9% for AGIs $100k-200k, 0.6% for AGIs over 200k)
Taxes paid: $7,084 (reported on 26.0% of returns)
61241:
$7,084
State:
$11,968
(% of AGI for various income ranges: 1.0% for AGIs below $25k, 2.1% for AGIs $25k-50k, 3.2% for AGIs $50k-75k, 4.4% for AGIs $75k-100k, 5.5% for AGIs $100k-200k, 3.0% for AGIs over 200k)
Earned income credit: $2,196 (reported on 15.8% of returns)
Here:
$2,196
State:
$2,349
(% of AGI for various income ranges: 5.6% for AGIs below $25k, 1.0% for AGIs $25k-50k)
Percentage of individuals using paid preparers for their 2012 taxes: 56.4%
Here:
56%
State:
57%
(% for various income ranges: 48.4% for AGIs below $25k, 59.8% for AGIs $25k-50k, 60.0% for AGIs $50k-75k, 62.5% for AGIs $75k-100k, 63.6% for AGIs $100k-200k, 66.7% for AGIs over 200k)
Averages for the 2004 tax year for zip code 61241, filed in 2005:
Average Adjusted Gross Income (AGI) in 2004: $40,269 (Individual Income Tax Returns)
Here:
$40,269
State:
$54,625
Salary/wage: $36,884 (reported on 88.5% of returns)
Here:
$36,884
State:
$46,811
(% of AGI for various income ranges: 119.2% for AGIs below $10k, 73.3% for AGIs $10k-25k, 79.9% for AGIs $25k-50k, 84.1% for AGIs $50k-75k, 86.8% for AGIs $75k-100k, 72.4% for AGIs over 100k)
Taxable interest for individuals: $686 (reported on 46.4% of returns)
This zip code:
$686
Illinois:
$2,101
(% of AGI for various income ranges: 4.4% for AGIs below $10k, 2.1% for AGIs $10k-25k, 0.9% for AGIs $25k-50k, 0.3% for AGIs $50k-75k, 0.4% for AGIs $75k-100k, 0.8% for AGIs over 100k)
Taxable dividends: $1,000 (reported on 17.8% of returns)
Here:
$1,000
State:
$4,306
(% of AGI for various income ranges: 2.2% for AGIs below $10k, 0.9% for AGIs $10k-25k, 0.3% for AGIs $25k-50k, 0.3% for AGIs $50k-75k, 0.1% for AGIs $75k-100k, 0.7% for AGIs over 100k)
Net capital gain/loss: +$5,543 (reported on 12.4% of returns)
Here:
+$5,543
State:
+$17,321
(% of AGI for various income ranges: -0.7% for AGIs below $10k, 0.1% for AGIs $10k-25k, 0.4% for AGIs $25k-50k, 0.2% for AGIs $50k-75k, 0.6% for AGIs $75k-100k, 8.3% for AGIs over 100k)
Profit/loss from business: +$6,264 (reported on 13.1% of returns)
Here:
+$6,264
State:
+$11,771
(% of AGI for various income ranges: 1.7% for AGIs below $10k, 3.2% for AGIs $10k-25k, 2.3% for AGIs $25k-50k, 1.8% for AGIs $50k-75k, 1.8% for AGIs $75k-100k, 1.6% for AGIs over 100k)
IRA payment deduction: $2,508 (reported on 1.8% of returns)
61241:
$2,508
Illinois:
$3,087
Self-employed pension: $4,167 (reported on 0.4% of returns)
Here:
$4,167
Illinois:
$16,965
Total itemized deductions: $13,668 (19% of AGI, reported on 25.2% of returns)
Here:
$13,668
State:
$20,239
Here:
19.3% of AGI
State:
19.5% of AGI
(% of AGI for various income ranges: 5.6% for AGIs below $10k, 4.7% for AGIs $10k-25k, 7.2% for AGIs $25k-50k, 10.0% for AGIs $50k-75k, 10.6% for AGIs $75k-100k, 8.2% for AGIs over 100k)
Charity contributions deductions: $2,104 (3% of AGI, reported on 19.8% of returns)
Here:
$2,104
State:
$3,719
Here:
2.8% of AGI
State:
3.4% of AGI
(% of AGI for various income ranges: 0.4% for AGIs $10k-25k, 0.8% for AGIs $25k-50k, 0.9% for AGIs $50k-75k, 1.4% for AGIs $75k-100k, 1.6% for AGIs over 100k)
Total tax: $4,872 (reported on 77.3% of returns)
61241:
$4,872
State:
$9,882
(% of AGI for various income ranges: 2.7% for AGIs below $10k, 3.8% for AGIs $10k-25k, 6.6% for AGIs $25k-50k, 8.4% for AGIs $50k-75k, 10.9% for AGIs $75k-100k, 16.5% for AGIs over 100k)
Earned income credit: $1,651 (reported on 14.0% of returns)
Here:
$1,651
State:
$1,788
Percentage of individuals using paid preparers for their 2004 taxes: 54.4%
Here:
54%
State:
61%
(% for various income ranges: 43.3% for AGIs below $10k, 55.0% for AGIs $10k-25k, 60.4% for AGIs $25k-50k, 56.2% for AGIs $50k-75k, 52.1% for AGIs $75k-100k, 60.2% for AGIs over 100k)
Likely homosexual households (counted as self-reported same-sex unmarried-partner households)
Lesbian couples: 0.3% of all households
Gay men: 0.0% of all households
Household received Food Stamps/SNAP in the past 12 months: 251 Household did not receive Food Stamps/SNAP in the past 12 months: 2,601
Women who had a birth in the past 12 months: 48 (47 now married, 0 unmarried) Women who did not have a birth in the past 12 months: 1,590 (619 now married, 970 unmarried)
Housing units in zip code 61241 with a mortgage: 1,419 (71 second mortgage, 55 both second mortgage and home equity loan) Houses without a mortgage: 4
Median monthly owner costs for units with a mortgage: $1,147 Median monthly owner costs for units without a mortgage: $584
Residents with income below the poverty level in 2022:
This zip code:
5.5%
Whole state:
11.9%
Residents with income below 50% of the poverty level in 2022:
This zip code:
4.1%
Whole state:
5.7%
Median number of rooms in houses and condos:
Here:
6.2
State:
6.4
Median number of rooms in apartments:
Here:
4.3
State:
4.1
Notable locations in this zip code not listed on our city pages
Notable locations in zip code 61241: Twin Rivers District Public Library (A), Henry County Emergency Medical Service (B), Quad City Helicopter Emergency Medical Service - Med Force (C), Colona Fire Department (D), Colona Community Fire Protection District (E). Display/hide their locations on the map
Churches in zip code 61241 include: Cleveland Assembly of God Church (A), First Freewill Baptist Church (B), Church of God (C), Calvary Tabernacle (D), Church of the Nazarene (E), Baptist Temple (F), First Baptist Church (G), United Church (H). Display/hide their locations on the map
Size of family households: 879 2-persons, 679 3-persons, 209 4-persons, 70 5-persons, 45 6-persons, 24 7-or-more-persons
Size of nonfamily households: 815 1-person, 150 2-persons
752 married couples with children.
287 single-parent households (132 men, 155 women).
98.4% of residents of 61241 zip code speak English at home.
0.8% of residents speak Spanish at home (100% very well).
0.3% of residents speak other Indo-European language at home (100% very well).
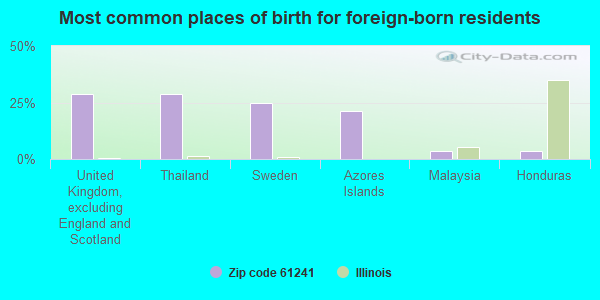
Foreign born population: 28 (0.4%) (71.6% of them are naturalized citizens)
This zip code:
0.4%
Whole state:
14.4%
29%United Kingdom, excluding England and Scotland
29%Thailand
25%Sweden
21%Azores Islands
4%Malaysia
4%Honduras
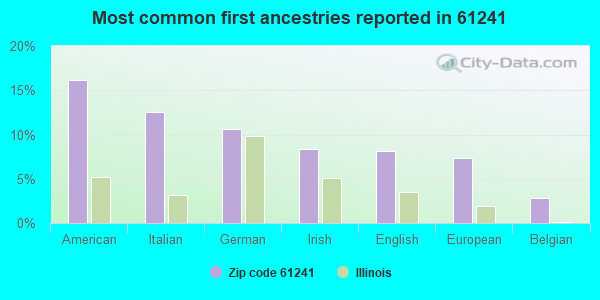
16%American
13%Italian
11%German
8%Irish
8%English
7%European
3%Belgian
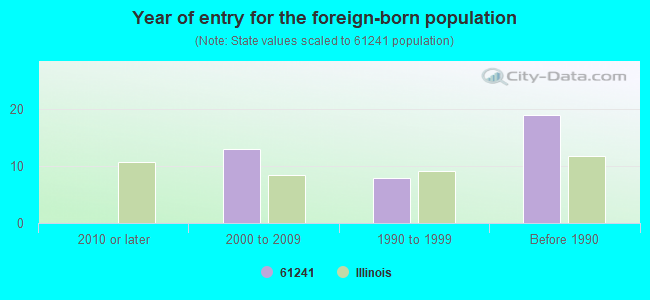
Year of entry for the foreign-born population
02010 or later
132000 to 2009
81990 to 1999
19Before 1990
Major facilities with environmental interests located in this zip code:
MEYER OIL CO (1320 CLEVELAND RD in COLONA, IL)
STATE MASTER (Illinois EPA Project) - AIR PROGRAM STATE MASTER (Illinois EPA Project) - SOLID WASTE PROGRAM AIR MINOR (AIRS/AFS) CRITERIA AND HAZARDOUS AIR POLLUTANT INVENTORY (Inventory of air pollution sources) Business SIC classification: PETROLEUM BULK STATIONS AND TERMINALS Alternative names: MEYER OIL CO DX TRAVEL MART, MEYER OIL CO. DX TRAVEL MART, TRILEAF - ENVIRONMANAGEMENT
RIVERSTONE GROUP, INC (1001 N. BROADWAY in CLEVELAND, IL)
STATE MASTER (Illinois EPA Project) - AIR PROGRAM STATE MASTER (Illinois EPA Project) - SOLID WASTE PROGRAM AIR MINOR (AIRS/AFS) CRITERIA AND HAZARDOUS AIR POLLUTANT INVENTORY (Inventory of air pollution sources) Business SIC classification: CRUSHED AND BROKEN LIMESTONE Alternative names: MOLINE CONSUMERS COMPANY
MCCARTHY IMPROVEMENT CO (RURAL ROUTE 1, BOX 70 in COLONA, IL)
STATE MASTER (Illinois EPA Project) - AIR PROGRAM, AIR MINOR (AIRS/AFS) CRITERIA AND HAZARDOUS AIR POLLUTANT INVENTORY (Inventory of air pollution sources) Business SIC classification: ASPHALT PAVING MIXTURES AND BLOCKS Business NAICS classification: ASPHALT PAVING MIXTURE AND BLOCK MANUFACTURING. Alternative names: MCCARTHY IMPROVEMENT COMPANY UNDER ID 073812
ROCK RIVER ARMS INC (1042 CLEVELAND RD in COLONA, IL)
STATE MASTER (Illinois EPA Project) - AIR PROGRAM, HAZARDOUS WASTE PROGRAM AIR MINOR (AIRS/AFS) Small Quantity Generators, between 100 kg and 1000 kg of hazardous waste/month (Resource Conservation and Recovery Act (tracking hazardous waste)) Business SIC classification: SMALL ARMS Organizations: CHUCK LARSON (CONTACT/OPERATOR)
CMI PLANT (US RT 6 in COLONA, IL)
STATE MASTER (Illinois EPA Project) - AIR PROGRAM AIR MINOR (AIRS/AFS) CRITERIA AND HAZARDOUS AIR POLLUTANT INVENTORY (Inventory of air pollution sources) Business SIC classification: ASPHALT PAVING MIXTURES AND BLOCKS Alternative names: D & J LEASING, D & J LEASING- CMI DRUM PLANT
MARK S POTTER SR (4799 U.S. ROUTE 6 in COLONA, IL)
STATE MASTER (Illinois EPA Project) - AIR PROGRAM AIR MINOR (AIRS/AFS) Business SIC classification: NONCLASSIFIABLE ESTABLISHMENTS
MOLINE CONSUMERS CO-MCMAHON PLANT #13 (R R #1 in CLEVELAND, IL)
STATE MASTER (Illinois EPA Project) - AIR PROGRAM AIR MINOR (AIRS/AFS) Business SIC classification: CRUSHED AND BROKEN LIMESTONE Alternative names: MOLINE CONSUMERS COMPANY
MONTGOMERY ELEV CO (RR 2 in COLONA, IL)
STATE MASTER (Illinois EPA Project) - AIR PROGRAM AIR MINOR (AIRS/AFS) Business SIC classification: CONVEYORS AND CONVEYING EQUIPMENT Alternative names: MONTGOMERY ELEV CO-SAME AS 073-807-AAD
OAKWOOD COUNTRY CLUB (SECTION 19, T17N, R1E, 4TH PM in COLONA, IL)
STATE MASTER (Illinois EPA Project) - National Pollutant Discharge Elimination System Permit National Pollutant Discharge Elimination System NON-MAJOR (Tracking pollutant discharge elimination systems) - permit Business SIC classification: MEMBERSHIP SPORTS AND RECREATION CLUBS Alternative names: OAKWOOD COUNTRY CLUB-STP
OBERLAENDER SAND CO (R R #2 in COLONA, IL)
STATE MASTER (Illinois EPA Project) - AIR PROGRAM AIR MINOR (AIRS/AFS) Business SIC classification: LUMBER AND OTHER BUILDING MATERIALS DEALERS Alternative names: OBERLAENDER SAND COMPANY
PRECISION AUTO BODY (RTE 84 in COLONA, IL)
STATE MASTER (Illinois EPA Project) - HAZARDOUS WASTE PROGRAM Small Quantity Generators, between 100 kg and 1000 kg of hazardous waste/month (Resource Conservation and Recovery Act (tracking hazardous waste)) - notification Organizations: HULL MICHAEL (CONTACT/OWNER)
RIVERSTONE GROUP-INC-CLEVELAND (CLEVELAND(MC31) RR 1 BOX 148 in COLONA, IL)
STATE MASTER (Illinois EPA Project) - National Pollutant Discharge Elimination System Permit National Pollutant Discharge Elimination System NON-MAJOR (Tracking pollutant discharge elimination systems) - permit Business SIC classification: CRUSHED AND BROKEN LIMESTONE Alternative names: CLEVELAND QUARRY (MC31), MOLINE CONSUMERS COMPANY, RIVERSTONE GROUP INC
COLONA GRADE SCHOOL (700 1ST ST in COLONA, IL)
(Geographic Names Information System) (National Center for Education Statistics) - STATE ID-2803719002001 Organizations: COLONA SCHOOL DISTRICT 190 (SCHOOL DISTRICT)
Housing units lacking complete plumbing facilities: 3.7% Housing units lacking complete kitchen facilities: 3.9%
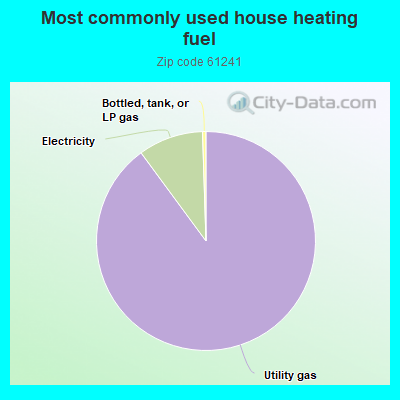
90.0%Utility gas
9.6%Electricity
0.5%Bottled, tank, or LP gas
Population in 1990: 7,809.
Place of birth for U.S.-born residents:
This state: 4,479
Northeast: 134
Midwest: 1,468
South: 281
West: 273
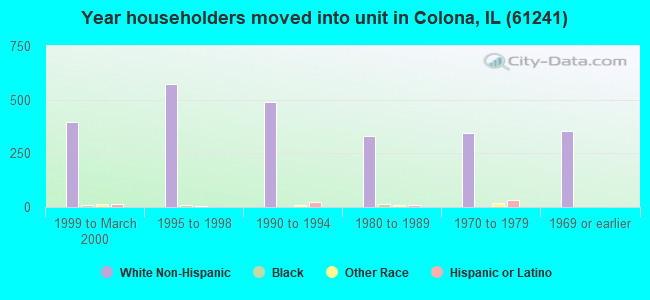
63% of the 61241 zip code residents lived in the same house 5 years ago. Out of people who lived in different houses, 33% lived in this county. Out of people who lived in different counties, 50% lived in Illinois.
94% of the 61241 zip code residents lived in the same house 1 year ago. Out of people who lived in different houses, 52% moved from this county. Out of people who lived in different houses, 42% moved from different county within same state. Out of people who lived in different houses, 0% moved from different state. Out of people who lived in different houses, 7% moved from abroad.
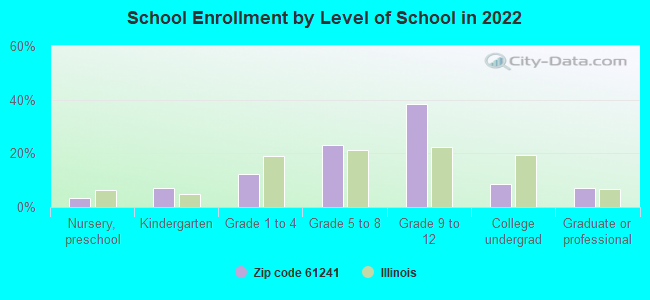
Private vs. public school enrollment:
Students in private schools in grades 1 to 8 (elementary and middle school): 72
Here:
14.9%
Illinois:
13.3%
Students in private schools in grades 9 to 12 (high school): 66
Here:
12.6%
Illinois:
9.9%
Students in private undergraduate colleges:
Here:
0.0%
Illinois:
27.4%
Occupation by median earnings in the past 12 months ($)
68,301Architecture and engineering occupations
64,057Construction and extraction occupations
59,815Health diagnosing and treating practitioners and other technical occupations
53,992Management occupations
53,585Computer and mathematical occupations
53,012Transportation occupations
Top industries in this zip code by the number of employees in 2005:
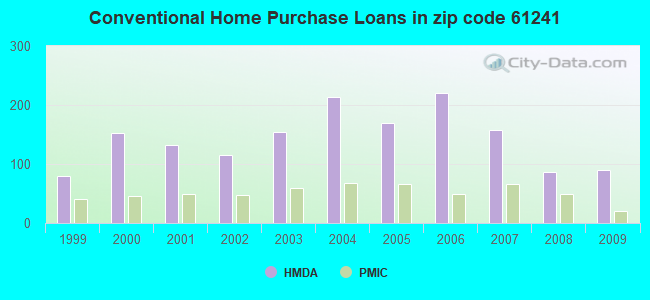
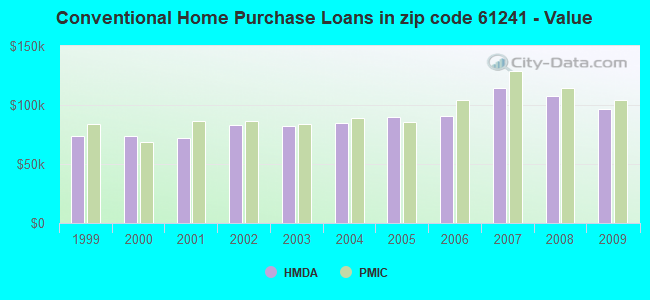
Detailed PMIC statistics for the following Tracts:0301.00
, 0302.03
2002 - 2018 National Fire Incident Reporting System (NFIRS) incidents
Based on the data from the years 2002 - 2018 the average number of fires per year is 32. The highest number of reported fire incidents - 82 took place in 2015, and the least - 3 in 2002. The data has a growing trend.
When looking into fire subcategories, the most incidents belonged to: Outside Fires (38.6%), and Structure Fires (33.2%).
Fire incident types reported to NFIRS in Zip Code 61241
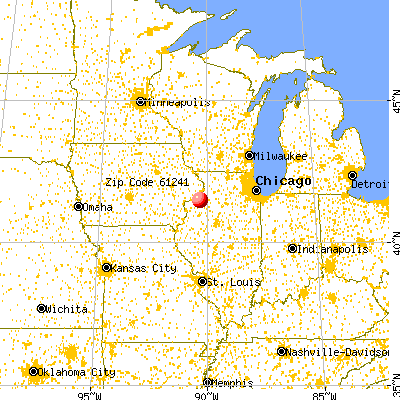


 Nearest zip codes: 61236, 61239, 61244, 61282, 61278, 61256.


 Based on the data from the years 2002 - 2018 the average number of fires per year is 32. The highest number of reported fire incidents - 82 took place in 2015, and the least - 3 in 2002. The data has a growing trend.
 When looking into fire subcategories, the most incidents belonged to: Outside Fires (38.6%), and Structure Fires (33.2%).