Estimated zip code population in 2022: 2,937 Zip code population in 2010: 3,355 Zip code population in 2000: 3,518
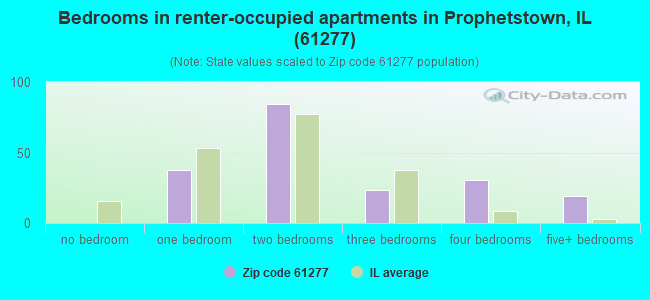
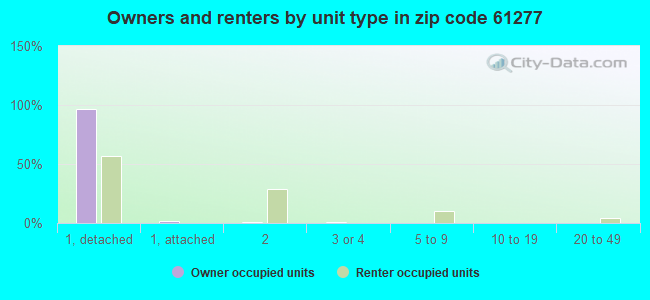
Houses and condos: 1,339 Renter-occupied apartments: 195
% of renters here:
17%
State:
33%
March 2022 cost of living index in zip code 61277: 84.0 (less than average, U.S. average is 100)
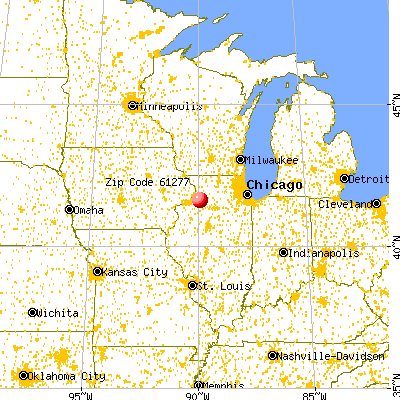
Land area: 126.6 sq. mi. Water area: 0.9 sq. mi.
Population density: 23 people per square mile
(very low).
OSM Map
General Map
Google Map
MSN Map
OSM Map
General Map
Google Map
MSN Map
OSM Map
General Map
Google Map
MSN Map
OSM Map
General Map
Google Map
MSN Map
Please wait while loading the map...
Real estate property taxes paid for housing units in 2022:
This zip code:
1.9% ($2,464)
Illinois:
2.0% ($4,912)
Median real estate property taxes paid for housing units with mortgages in 2022: $2,317 (1.7%) Median real estate property taxes paid for housing units with no mortgage in 2022: $2,622 (2.0%)
Averages for the 2020 tax year for zip code 61277, filed in 2021:
Average Adjusted Gross Income (AGI) in 2020: $61,488 (Individual Income Tax Returns)
Here:
$61,488
State:
$82,626
Salary/wage: $46,402 (reported on 77.9% of returns)
Here:
$46,402
State:
$66,640
(% of AGI for various income ranges: 1166.7% for AGIs below $25k, 3259.0% for AGIs $25k-50k, 6116.7% for AGIs $50k-75k, 9104.2% for AGIs $75k-100k, 12989.2% for AGIs $100k-200k)
Taxable interest for individuals: $2,147 (reported on 41.6% of returns)
This zip code:
$2,147
Illinois:
$2,376
(% of AGI for various income ranges: 39.1% for AGIs below $25k, 30.0% for AGIs $25k-50k, 164.4% for AGIs $50k-75k, 125.8% for AGIs $75k-100k, 211.5% for AGIs $100k-200k)
Ordinary dividends: $6,244 (reported on 23.4% of returns)
Here:
$6,244
State:
$9,061
(% of AGI for various income ranges: 44.8% for AGIs below $25k, 49.7% for AGIs $25k-50k, 157.8% for AGIs $50k-75k, 182.5% for AGIs $75k-100k, 495.4% for AGIs $100k-200k)
Net capital gain/loss in AGI: +$9,737 (reported on 17.5% of returns)
Here:
+$9,737
State:
+$31,684
(% of AGI for various income ranges: 2.7% for AGIs below $25k, 27.7% for AGIs $25k-50k, 77.2% for AGIs $50k-75k, 125.0% for AGIs $75k-100k, 524.6% for AGIs $100k-200k)
Profit/loss from business: +$9,268 (reported on 12.3% of returns)
Here:
+$9,268
State:
+$12,175
(% of AGI for various income ranges: 39.4% for AGIs below $25k, 63.0% for AGIs $25k-50k, 53.9% for AGIs $50k-75k, 181.7% for AGIs $75k-100k, 435.4% for AGIs $100k-200k)
Taxable individual retirement arrangement distribution: $13,678 (reported on 11.7% of returns)
61277:
$13,678
Illinois:
$21,613
(% of AGI for various income ranges: 57.6% for AGIs below $25k, 129.3% for AGIs $25k-50k, 251.7% for AGIs $50k-75k, 295.8% for AGIs $75k-100k, 827.7% for AGIs $100k-200k)
Total itemized deductions: $34,300 (reported on 2.6% of returns)
Here:
$34,300
State:
$34,948
(% of AGI for various income ranges: 186.4% for AGIs below $25k, 582.3% for AGIs $100k-200k)
Charity contributions: $6,333 (reported on 1.9% of returns)
Here:
$6,333
State:
$13,122
(% of AGI for various income ranges: 158.3% for AGIs $75k-100k)
Taxes paid: $5,540 (reported on 3.2% of returns)
61277:
$5,540
State:
$8,563
(% of AGI for various income ranges: 24.2% for AGIs below $25k, 151.5% for AGIs $100k-200k)
Earned income credit: $2,216 (reported on 12.3% of returns)
Here:
$2,216
State:
$2,311
(% of AGI for various income ranges: 63.3% for AGIs below $25k, 70.7% for AGIs $25k-50k)
Percentage of individuals using paid preparers for their 2020 taxes: 94.2%
Here:
94%
State:
93%
(% for various income ranges: 93.5% for AGIs below $25k, 94.6% for AGIs $25k-50k, 96.2% for AGIs $50k-75k, 94.4% for AGIs $75k-100k, 90.9% for AGIs $100k-200k, 100.0% for AGIs over 200k)
Averages for the 2012 tax year for zip code 61277, filed in 2013:
Average Adjusted Gross Income (AGI) in 2012: $57,727 (Individual Income Tax Returns)
Here:
$57,727
State:
$68,058
Salary/wage: $40,475 (reported on 80.3% of returns)
Here:
$40,475
State:
$55,396
(% of AGI for various income ranges: 63.6% for AGIs below $25k, 76.1% for AGIs $25k-50k, 73.0% for AGIs $50k-75k, 69.8% for AGIs $75k-100k, 57.3% for AGIs $100k-200k, 21.1% for AGIs over 200k)
Taxable interest for individuals: $2,055 (reported on 42.0% of returns)
This zip code:
$2,055
Illinois:
$1,969
(% of AGI for various income ranges: 2.5% for AGIs below $25k, 1.4% for AGIs $25k-50k, 1.0% for AGIs $50k-75k, 1.6% for AGIs $75k-100k, 1.3% for AGIs $100k-200k, 1.7% for AGIs over 200k)
Ordinary dividends: $4,408 (reported on 23.6% of returns)
Here:
$4,408
State:
$7,786
(% of AGI for various income ranges: 2.2% for AGIs below $25k, 1.0% for AGIs $25k-50k, 1.0% for AGIs $50k-75k, 1.1% for AGIs $75k-100k, 1.2% for AGIs $100k-200k, 3.6% for AGIs over 200k)
Net capital gain/loss in AGI: +$12,242 (reported on 15.3% of returns)
Here:
+$12,242
State:
+$22,183
(% of AGI for various income ranges: 0.3% for AGIs $50k-75k, 0.5% for AGIs $75k-100k, 0.4% for AGIs $100k-200k, 12.4% for AGIs over 200k)
Profit/loss from business: +$5,900 (reported on 12.7% of returns)
Here:
+$5,900
State:
+$12,903
(% of AGI for various income ranges: 3.3% for AGIs below $25k, 1.3% for AGIs $25k-50k, 1.5% for AGIs $50k-75k, 2.3% for AGIs $75k-100k, 1.1% for AGIs $100k-200k)
Taxable individual retirement arrangement distribution: $8,020 (reported on 12.7% of returns)
61277:
$8,020
Illinois:
$17,929
(% of AGI for various income ranges: 3.1% for AGIs below $25k, 1.9% for AGIs $25k-50k, 1.5% for AGIs $50k-75k, 2.4% for AGIs $75k-100k, 3.0% for AGIs $100k-200k)
Total itemized deductions: $18,639 (17% of AGI, reported on 22.9% of returns)
Here:
$18,639
State:
$26,433
Here:
16.7% of AGI
State:
19.2% of AGI
(% of AGI for various income ranges: 9.3% for AGIs below $25k, 8.7% for AGIs $25k-50k, 7.8% for AGIs $50k-75k, 7.2% for AGIs $75k-100k, 8.6% for AGIs $100k-200k, 4.9% for AGIs over 200k)
Charity contributions: $4,172 (reported on 15.9% of returns)
Here:
$4,172
State:
$4,525
(% of AGI for various income ranges: 1.1% for AGIs $25k-50k, 0.9% for AGIs $50k-75k, 1.1% for AGIs $75k-100k, 1.9% for AGIs $100k-200k, 1.1% for AGIs over 200k)
Taxes paid: $7,414 (reported on 22.3% of returns)
61277:
$7,414
State:
$11,968
(% of AGI for various income ranges: 1.3% for AGIs below $25k, 2.0% for AGIs $25k-50k, 2.5% for AGIs $50k-75k, 2.9% for AGIs $75k-100k, 3.8% for AGIs $100k-200k, 3.2% for AGIs over 200k)
Earned income credit: $1,996 (reported on 14.6% of returns)
Here:
$1,996
State:
$2,349
(% of AGI for various income ranges: 4.7% for AGIs below $25k, 1.0% for AGIs $25k-50k)
Percentage of individuals using paid preparers for their 2012 taxes: 61.8%
Here:
62%
State:
57%
(% for various income ranges: 53.3% for AGIs below $25k, 58.3% for AGIs $25k-50k, 66.7% for AGIs $50k-75k, 76.5% for AGIs $75k-100k, 66.7% for AGIs $100k-200k, 100.0% for AGIs over 200k)
Averages for the 2004 tax year for zip code 61277, filed in 2005:
Average Adjusted Gross Income (AGI) in 2004: $38,452 (Individual Income Tax Returns)
Here:
$38,452
State:
$54,625
Salary/wage: $31,891 (reported on 80.0% of returns)
Here:
$31,891
State:
$46,811
(% of AGI for various income ranges: 74.7% for AGIs below $10k, 62.9% for AGIs $10k-25k, 74.2% for AGIs $25k-50k, 73.9% for AGIs $50k-75k, 68.8% for AGIs $75k-100k, 45.9% for AGIs over 100k)
Taxable interest for individuals: $2,134 (reported on 57.7% of returns)
This zip code:
$2,134
Illinois:
$2,101
(% of AGI for various income ranges: 11.1% for AGIs below $10k, 4.3% for AGIs $10k-25k, 2.7% for AGIs $25k-50k, 2.9% for AGIs $50k-75k, 2.7% for AGIs $75k-100k, 3.1% for AGIs over 100k)
Taxable dividends: $2,607 (reported on 29.4% of returns)
Here:
$2,607
State:
$4,306
(% of AGI for various income ranges: 3.8% for AGIs below $10k, 2.6% for AGIs $10k-25k, 1.0% for AGIs $25k-50k, 1.4% for AGIs $50k-75k, 1.4% for AGIs $75k-100k, 3.8% for AGIs over 100k)
Net capital gain/loss: +$3,175 (reported on 20.6% of returns)
Here:
+$3,175
State:
+$17,321
(% of AGI for various income ranges: -4.8% for AGIs below $10k, 0.4% for AGIs $10k-25k, 0.8% for AGIs $25k-50k, 0.5% for AGIs $50k-75k, 1.5% for AGIs $75k-100k, 5.9% for AGIs over 100k)
Profit/loss from business: +$4,405 (reported on 14.3% of returns)
Here:
+$4,405
State:
+$11,771
(% of AGI for various income ranges: 3.9% for AGIs below $10k, 3.7% for AGIs $10k-25k, 1.1% for AGIs $25k-50k, 1.0% for AGIs $50k-75k, 0.8% for AGIs $75k-100k, 2.4% for AGIs over 100k)
Profit/loss from farming: +$12,811 (reported on 8.5% of returns)
Here:
+$12,811
State:
+$2,327
(% of AGI for various income ranges: -15.9% for AGIs below $10k, 1.9% for AGIs $25k-50k, 2.3% for AGIs $50k-75k, 8.1% for AGIs $75k-100k, 4.5% for AGIs over 100k)
IRA payment deduction: $3,138 (reported on 3.7% of returns)
61277:
$3,138
Illinois:
$3,087
Total itemized deductions: $16,898 (26% of AGI, reported on 18.9% of returns)
Here:
$16,898
State:
$20,239
Here:
25.7% of AGI
State:
19.5% of AGI
(% of AGI for various income ranges: 15.4% for AGIs below $10k, 7.5% for AGIs $10k-25k, 9.6% for AGIs $25k-50k, 8.1% for AGIs $50k-75k, 8.6% for AGIs $75k-100k, 6.4% for AGIs over 100k)
Charity contributions deductions: $2,889 (4% of AGI, reported on 14.5% of returns)
Here:
$2,889
State:
$3,719
Here:
4.0% of AGI
State:
3.4% of AGI
(% of AGI for various income ranges: 0.7% for AGIs $10k-25k, 0.9% for AGIs $25k-50k, 0.9% for AGIs $50k-75k, 1.7% for AGIs $75k-100k, 1.5% for AGIs over 100k)
Total tax: $5,152 (reported on 73.8% of returns)
61277:
$5,152
State:
$9,882
(% of AGI for various income ranges: 1.7% for AGIs below $10k, 4.4% for AGIs $10k-25k, 6.3% for AGIs $25k-50k, 8.5% for AGIs $50k-75k, 11.6% for AGIs $75k-100k, 18.8% for AGIs over 100k)
Earned income credit: $1,366 (reported on 12.3% of returns)
Here:
$1,366
State:
$1,788
Percentage of individuals using paid preparers for their 2004 taxes: 70.5%
Here:
71%
State:
61%
(% for various income ranges: 62.7% for AGIs below $10k, 69.8% for AGIs $10k-25k, 69.7% for AGIs $25k-50k, 78.4% for AGIs $50k-75k, 79.8% for AGIs $75k-100k, 73.1% for AGIs over 100k)
Household received Food Stamps/SNAP in the past 12 months: 82 Household did not receive Food Stamps/SNAP in the past 12 months: 1,052
Women who did not have a birth in the past 12 months: 581 (211 now married, 371 unmarried)
Housing units in zip code 61277 with a mortgage: 489 (67 second mortgage, 52 both second mortgage and home equity loan) Median monthly owner costs for units with a mortgage: $1,208 Median monthly owner costs for units without a mortgage: $608
Residents with income below the poverty level in 2022:
This zip code:
7.9%
Whole state:
11.9%
Residents with income below 50% of the poverty level in 2022:
This zip code:
4.1%
Whole state:
5.7%
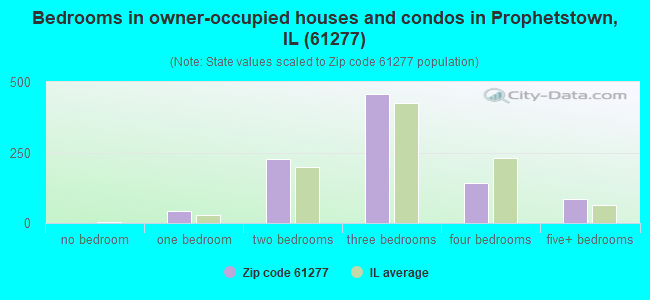
Median number of rooms in houses and condos:
Here:
6.8
State:
6.4
Median number of rooms in apartments:
Here:
5.2
State:
4.1
Notable locations in this zip code not listed on our city pages
Notable locations in zip code 61277: Prophet Hills Country Club (A), River View Picnic Area (B), Prophetstown Ambulance Service (C), Prophetstown Fire Protection District (D). Display/hide their locations on the map
Churches in zip code 61277 include: Advent Christian Church (A), First Congregational Church (B), First Lutheran Church (C), Leon United Methodist Church (D), Saint Catherines Catholic Church (E), Saint Marys Church (F), Loraine United Methodist Church (G). Display/hide their locations on the map
Cemeteries: Kemmis Cemetery (1), Loraine Cemetery (2), Leon Methodist Cemetery (3), Saint Marys Cemetery (4), Goble Cemetery (5), Washington Road Cemetery (6), Shady Town Cemetery (7). Display/hide their locations on the map
Streams, rivers, and creeks: Coon Creek (A), Ellsworth Creek (B), Walker Slough (C), Keefer Branch (D), Portland Creek (E), Hackberry Slough (F), Paddock Slough (G). Display/hide their locations on the map
In group quarters: 164 (-1 institutionalized population)
Size of family households: 371 2-persons, 82 3-persons, 72 4-persons, 68 5-persons, 65 6-persons, 2 7-or-more-persons
Size of nonfamily households: 380 1-person, 105 2-persons
517 married couples with children.
85 single-parent households (85 women).
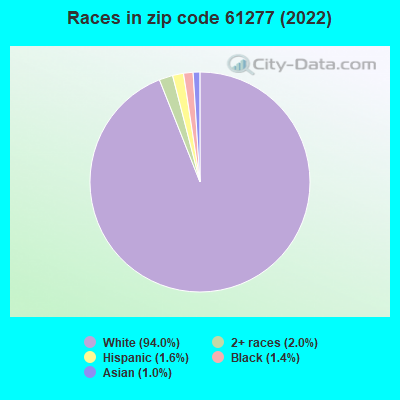
95.1% of residents of 61277 zip code speak English at home.
0.5% of residents speak Spanish at home (71% very well, 29% not well).
4.4% of residents speak other Indo-European language at home (75% very well, 12% well, 13% not well).
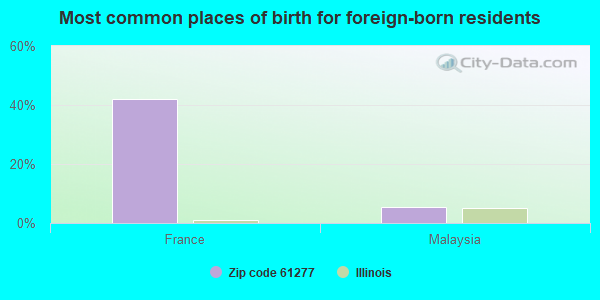
Foreign born population: 19 (0.7%) (100.0% of them are naturalized citizens)
This zip code:
0.7%
Whole state:
14.4%
42%France
5%Malaysia
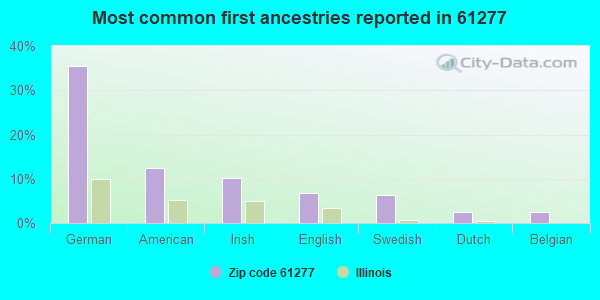
35%German
13%American
10%Irish
7%English
6%Swedish
3%Dutch
2%Belgian
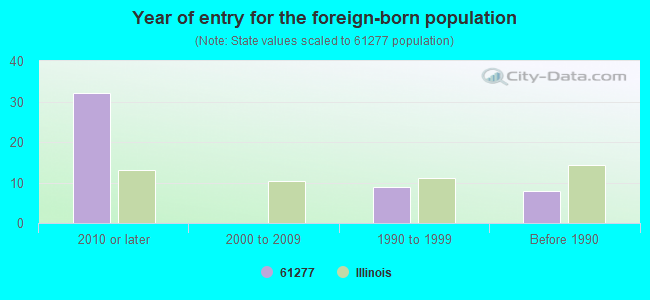
Year of entry for the foreign-born population
322010 or later
02000 to 2009
91990 to 1999
8Before 1990
Major facilities with environmental interests located in this zip code:
PENBERTHY (320 LOCUST ST. in PROPHETSTOWN, IL)
STATE MASTER (Illinois EPA Project) - SOLID WASTE PROGRAM, HAZARDOUS WASTE PROGRAM, AIR PROGRAM, National Pollutant Discharge Elimination System Permit AIR MINOR (AIRS/AFS) CRITERIA AND HAZARDOUS AIR POLLUTANT INVENTORY (Inventory of air pollution sources) National Pollutant Discharge Elimination System NON-MAJOR (Tracking pollutant discharge elimination systems) - permit Small Quantity Generators, between 100 kg and 1000 kg of hazardous waste/month (Resource Conservation and Recovery Act (tracking hazardous waste)) - notification TRI REPORTER (Tracking of toxic chemicals releasing facilities) Business SIC classification: VALVES AND PIPE FITTINGS; PUMPS AND PUMPING EQUIPMENT; INDUSTRIAL INSTRUMENTS FOR MEASUREMENT, DISPLAY, AND CONTROL OF PROCESS VARIABLES; AND RELATED PRODUCTS Business NAICS classification: INSTRUMENTS AND RELATED PRODUCTS MANUFACTURING FOR MEASURING, DISPLAYING, AND CONTROLLING INDUSTRIAL PROCESS VARIABLES. Organizations: LEN WRIGHT (CONTACT/OPERATOR)
, PENBERTHY, INC. (CONTACT/OWNER)
, TYCO VALVES & CONTROLS LP (CONTACT/OWNER)
Alternative names: TYCO VALVES & CONTROLS, TYCO VALVES & CONTROLS/B MILLS, TYCO VALVES & CONTROLS L.P., TYCO VALVES & CONTROLS LP
PROPHETSTOWN STP (6259 LYNDON ROAD in PROPHETSTOWN, IL)
STATE MASTER (Illinois EPA Project) - National Pollutant Discharge Elimination System Permit National Pollutant Discharge Elimination System NON-MAJOR (Tracking pollutant discharge elimination systems) - permit National Pollutant Discharge Elimination System NON-MAJOR (Tracking pollutant discharge elimination systems) - permit Business SIC classification: SEWERAGE SYSTEMS Alternative names: PROPHETSON WWTF, PROPHETSTOWN STP, CITY OF
ROCK RIVER LUMBER & GRAIN CO (6796 BISHOP ROAD in PROPHETSTOWN, IL)
STATE MASTER (Illinois EPA Project) - AIR PROGRAM AIR MINOR (AIRS/AFS) CRITERIA AND HAZARDOUS AIR POLLUTANT INVENTORY (Inventory of air pollution sources) Business SIC classification: GRAIN AND FIELD BEANS
PROPHETSTOWN EQUIPMENT INC (200 N ST in PROPHETSTOWN, IL)
STATE MASTER (Illinois EPA Project) - SOLID WASTE PROGRAM (Resource Conservation and Recovery Act (tracking hazardous waste)) Alternative names: PROPHETSTOWN EQUIP INC
QUALITY READY MIX CONCRETE CO (W END OF W THIRD in PROPHETSTOWN, IL)
STATE MASTER (Illinois EPA Project) - AIR PROGRAM AIR MINOR (AIRS/AFS) CRITERIA AND HAZARDOUS AIR POLLUTANT INVENTORY (Inventory of air pollution sources) Business SIC classification: READY-MIXED CONCRETE Business NAICS classification: READY-MIX CONCRETE MANUFACTURING.
ROCK RIVER LUMBER & GRAIN CO (MILL RD in PROPHETSTOWN, IL)
STATE MASTER (Illinois EPA Project) - AIR PROGRAM AIR MINOR (AIRS/AFS) CRITERIA AND HAZARDOUS AIR POLLUTANT INVENTORY (Inventory of air pollution sources) Business SIC classification: READY-MIXED CONCRETE
GTE NORTH INC (300 SHORT ST in PROPHETSTOWN, IL)
STATE MASTER (Illinois EPA Project) - HAZARDOUS WASTE PROGRAM Conditionally Exempt Small Quantity Generators, less than 100 kg/month of hazardous waste (Resource Conservation and Recovery Act (tracking hazardous waste)) - notification TRANSPORTER (Resource Conservation and Recovery Act (tracking hazardous waste)) - notification Organizations: G T E NORTH INC (CONTACT/OWNER)
Alternative names: G T E NORTH INC
MCNEILL TWINS OIL CO (415 LOCUST STREET in PROPHETSTOWN, IL)
STATE MASTER (Illinois EPA Project) - AIR PROGRAM AIR MINOR (AIRS/AFS) Business SIC classification: PETROLEUM BULK STATIONS AND TERMINALS
PROPHETSTOWN AUTO BODY (605 GROVE ST in PROPHETSTOWN, IL)
STATE MASTER (Illinois EPA Project) - HAZARDOUS WASTE PROGRAM Conditionally Exempt Small Quantity Generators, less than 100 kg/month of hazardous waste (Resource Conservation and Recovery Act (tracking hazardous waste)) - notification Organizations: STEWART LARRY (CONTACT/OWNER)
PROPHETSTOWN THERMOGAS (RT. 78 in PROPHETSTOWN, IL)
STATE MASTER (Illinois EPA Project) - AIR PROGRAM AIR MINOR (AIRS/AFS) Business SIC classification: LIQUEFIED PETROLEUM GAS (BOTTLED GAS) DEALERS
PROPHETSTOWN HIGH SCHOOL (310 W RIVERSIDE DR in PROPHETSTOWN, IL)
(Geographic Names Information System) (National Center for Education Statistics) - STATE ID-5509800300001 Organizations: PROPHETSTOWN-LYNDON-TAMPICO CUSD3 (SCHOOL DISTRICT)
PROPHETSTOWN STATE PARK (RIVERSIDE DRIVE in PROPHETSTOWN, IL)
STATE MASTER (Illinois EPA Project) - HAZARDOUS WASTE PROGRAM Conditionally Exempt Small Quantity Generators, less than 100 kg/month of hazardous waste (Resource Conservation and Recovery Act (tracking hazardous waste)) - notification Organizations: STATE OF IL DEPT OF NATURAL RESOURCES (CONTACT/OWNER)
PROPHETSTOWN ELEM SCHOOL (301 W 3RD ST in PROPHETSTOWN, IL)
(National Center for Education Statistics) - STATE ID-5509800302006 Organizations: PROPHETSTOWN-LYNDON-TAMPICO CUSD3 (SCHOOL DISTRICT)
Housing units lacking complete plumbing facilities: 1.1% Housing units lacking complete kitchen facilities: 1.7%
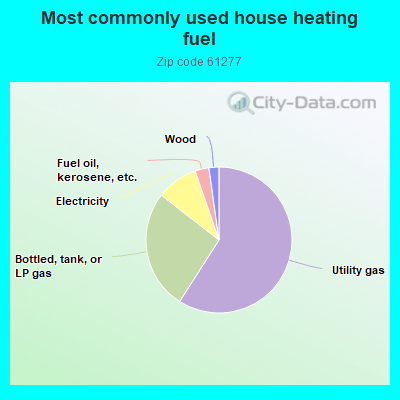
59.2%Utility gas
26.5%Bottled, tank, or LP gas
9.2%Electricity
3.1%Fuel oil, kerosene, etc.
2.2%Wood
Population in 1990: 3,736.
Place of birth for U.S.-born residents:
This state: 2,248
Northeast: 23
Midwest: 411
South: 112
West: 88
67% of the 61277 zip code residents lived in the same house 5 years ago. Out of people who lived in different houses, 70% lived in this county. Out of people who lived in different counties, 50% lived in Illinois.
88% of the 61277 zip code residents lived in the same house 1 year ago. Out of people who lived in different houses, 25% moved from this county. Out of people who lived in different houses, 24% moved from different county within same state. Out of people who lived in different houses, 56% moved from different state.
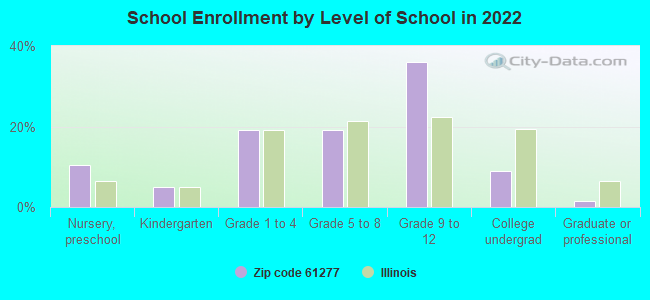
Private vs. public school enrollment:
Students in private schools in grades 1 to 8 (elementary and middle school): 63
Here:
26.3%
Illinois:
13.3%
Students in private schools in grades 9 to 12 (high school): 17
Here:
7.6%
Illinois:
9.9%
Students in private undergraduate colleges: 5
Here:
9.5%
Illinois:
27.4%
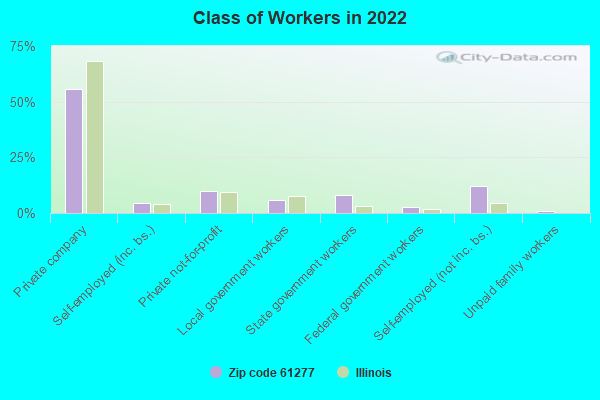
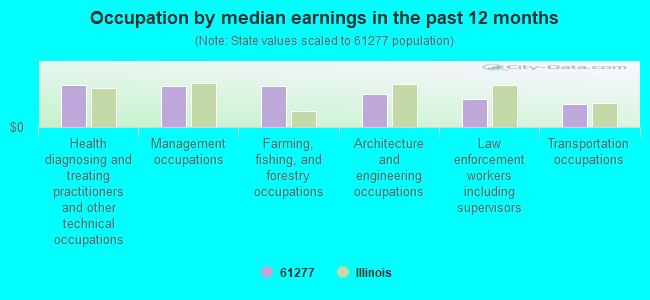
Occupation by median earnings in the past 12 months ($)
115,056Health diagnosing and treating practitioners and other technical occupations
112,016Management occupations
110,457Farming, fishing, and forestry occupations
89,604Architecture and engineering occupations
75,562Law enforcement workers including supervisors
62,540Transportation occupations
Companies with federal contracts located in this zip code:
TYCO VALVES & CONTROLS LP - PR (320 LOCUST ST in PROPHETSTOWN, IL; small business) : $451,721 in 12 contractsfrom 2001 to 2006
Contracts for Valves, Nonpowered, Aircraft Launching Equipment, Liquid and Gas Flow, Liquid Level, and Mechanical Motion Measuring Instruments, Nuclear Reactors by NASA, Navy, Defense Logistics Agency Signed by year:2000: $0; 2001: $71,192; 2002: $82,731; 2003: $241,034; 2004: $18,813; 2005: $10,249; 2006: $27,702.
Biggest contracts:
$87,727 with NASA for Valves, Nonpowered. Taking place in MS. Signed on 2003-03-31. Completion date: 2003-12-15.
$71,192 with Navy for Aircraft Launching Equipment. Signed on 2001-09-25. Completion date: 2001-12-07.
$62,458 with Navy for Liquid and Gas Flow, Liquid Level, and Mechanical Motion Measuring Instruments. Signed on 2003-03-25. Completion date: 2003-09-30.
$53,669, same as above.Signed on 2003-12-16. Completion date: 2004-06-18.
EAGLE & DAUGHTER CONSTRUCTION (604 BUTTERCUP LANE in PROPHETSTOWN, IL; small business) : $21,591 in 7 contractsin 2004
Contracts for Construction of Structures and Facilities -- Miscellaneous Buildings, Construction of Structures and Facilities -- Recreational Buildings by Army, U.S. Army Corps of Engineers - civil program financing only Signed by year:2000: $0; 2001: $0; 2002: $0; 2003: $0; 2004: $21,591; 2005: $0; 2006: $0.
Biggest contracts:
$93,900 with Army for Construction of Structures and Facilities -- Miscellaneous Buildings. Taking place in TX. Signed on 2004-06-01. Completion date: 2004-08-30.
$93,900 with U.S. Army Corps of Engineers - civil program financing only for Construction of Structures and Facilities -- Miscellaneous Buildings. Taking place in TX. Signed on 2004-06-01. Completion date: 2004-08-30.
$21,391 with Army for Construction of Structures and Facilities -- Recreational Buildings. Taking place in TX. Signed on 2004-02-03. Completion date: 2003-12-17.
$100, same as above.Signed on 2004-05-06. Completion date: 2003-12-17.
HOUZENGA, CHARLOTTE R (13113 HOWARD RD in PROPHETSTOWN, IL; small business)
$10,830 with Army for Custodial Janitorial Services. Signed on 2006-03-16. Completion date: 2006-01-18.
Top industries in this zip code by the number of employees in 2005:
Health Care and Social Assistance: Nursing Care Facilities (100-249 employees: 1 establishment, 50-99 employees: 1 establishment)
Accommodation and Food Services: Snack and Nonalcoholic Beverage Bars (20-49: 1)
Finance and Insurance: Commercial Banking (20-49: 1)
Health Care and Social Assistance: Residential Mental Retardation Facilities (20-49: 1)
People in group quarters in 2010:
145 people in nursing facilities/skilled-nursing facilities
16 people in group homes intended for adults
People in group quarters in 2000:
79 people in other nonhousehold living situations
73 people in nursing homes
5 people in homes for the mentally retarded
Home Mortgage Disclosure Act Aggregated Statistics For Year 2009 (Based on 2 partial tracts)
A) FHA, FSA/RHS & VA Home Purchase Loans
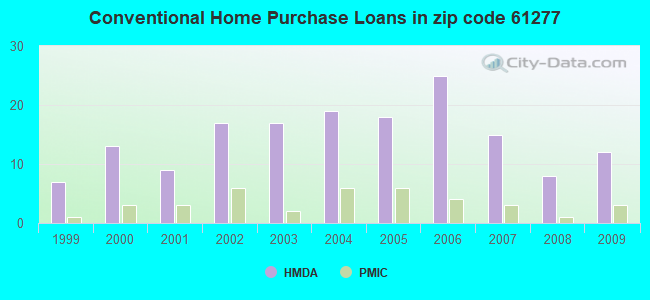
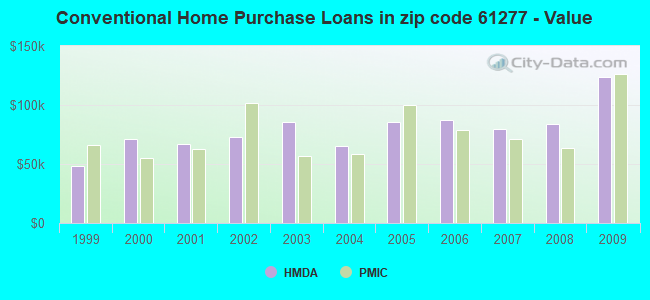
B) Conventional Home Purchase Loans
C) Refinancings
D) Home Improvement Loans
F) Non-occupant Loans on < 5 Family Dwellings (A B C & D)
Number
Average Value
Number
Average Value
Number
Average Value
Number
Average Value
Number
Average Value
LOANS ORIGINATED
4
$100,068
12
$123,558
39
$97,317
7
$59,956
3
$98,137
APPLICATIONS APPROVED, NOT ACCEPTED
0
$0
1
$40,720
2
$87,385
1
$40,090
1
$40,720
APPLICATIONS DENIED
3
$96,467
6
$87,592
7
$101,297
0
$0
0
$0
APPLICATIONS WITHDRAWN
0
$0
1
$60,130
11
$106,944
1
$59,510
0
$0
FILES CLOSED FOR INCOMPLETENESS
1
$36,330
0
$0
1
$126,530
1
$11,900
0
$0
Aggregated Statistics For Year 2008 (Based on 2 partial tracts)
A) FHA, FSA/RHS & VA Home Purchase Loans
B) Conventional Home Purchase Loans
C) Refinancings
D) Home Improvement Loans
F) Non-occupant Loans on < 5 Family Dwellings (A B C & D)
G) Loans On Manufactured Home Dwelling (A B C & D)
Number
Average Value
Number
Average Value
Number
Average Value
Number
Average Value
Number
Average Value
Number
Average Value
LOANS ORIGINATED
4
$90,985
8
$84,172
28
$88,882
4
$36,488
4
$63,580
1
$30,070
APPLICATIONS APPROVED, NOT ACCEPTED
1
$46,350
1
$80,180
2
$99,600
2
$35,080
0
$0
0
$0
APPLICATIONS DENIED
3
$82,477
1
$16,910
10
$143,446
4
$71,098
0
$0
1
$58,260
APPLICATIONS WITHDRAWN
0
$0
1
$16,910
4
$59,195
1
$105,860
0
$0
1
$16,910
FILES CLOSED FOR INCOMPLETENESS
0
$0
0
$0
3
$77,463
1
$22,550
0
$0
0
$0
Aggregated Statistics For Year 2007 (Based on 2 partial tracts)
A) FHA, FSA/RHS & VA Home Purchase Loans
B) Conventional Home Purchase Loans
C) Refinancings
D) Home Improvement Loans
E) Loans on Dwellings For 5+ Families
F) Non-occupant Loans on < 5 Family Dwellings (A B C & D)
G) Loans On Manufactured Home Dwelling (A B C & D)
Number
Average Value
Number
Average Value
Number
Average Value
Number
Average Value
Number
Average Value
Number
Average Value
Number
Average Value
LOANS ORIGINATED
3
$92,080
15
$79,595
24
$89,001
6
$43,013
1
$68,900
3
$37,377
1
$62,010
APPLICATIONS APPROVED, NOT ACCEPTED
0
$0
1
$48,860
8
$108,368
3
$34,660
0
$0
1
$87,700
0
$0
APPLICATIONS DENIED
1
$57,630
1
$59,510
9
$68,626
5
$38,460
0
$0
0
$0
1
$15,660
APPLICATIONS WITHDRAWN
0
$0
0
$0
3
$99,390
0
$0
0
$0
1
$25,680
0
$0
FILES CLOSED FOR INCOMPLETENESS
0
$0
0
$0
0
$0
0
$0
0
$0
0
$0
0
$0
Aggregated Statistics For Year 2006 (Based on 2 partial tracts)
A) FHA, FSA/RHS & VA Home Purchase Loans
B) Conventional Home Purchase Loans
C) Refinancings
D) Home Improvement Loans
F) Non-occupant Loans on < 5 Family Dwellings (A B C & D)
G) Loans On Manufactured Home Dwelling (A B C & D)
Number
Average Value
Number
Average Value
Number
Average Value
Number
Average Value
Number
Average Value
Number
Average Value
LOANS ORIGINATED
3
$62,640
25
$87,596
21
$69,829
9
$29,789
6
$62,327
1
$10,020
APPLICATIONS APPROVED, NOT ACCEPTED
0
$0
2
$93,960
6
$73,288
0
$0
1
$45,100
0
$0
APPLICATIONS DENIED
0
$0
3
$78,090
15
$99,807
6
$33,825
3
$152,007
0
$0
APPLICATIONS WITHDRAWN
0
$0
1
$50,110
6
$80,075
1
$13,780
1
$112,750
0
$0
FILES CLOSED FOR INCOMPLETENESS
0
$0
0
$0
1
$137,810
0
$0
0
$0
0
$0
Aggregated Statistics For Year 2005 (Based on 2 partial tracts)
A) FHA, FSA/RHS & VA Home Purchase Loans
B) Conventional Home Purchase Loans
C) Refinancings
D) Home Improvement Loans
F) Non-occupant Loans on < 5 Family Dwellings (A B C & D)
G) Loans On Manufactured Home Dwelling (A B C & D)
Number
Average Value
Number
Average Value
Number
Average Value
Number
Average Value
Number
Average Value
Number
Average Value
LOANS ORIGINATED
1
$49,490
18
$85,399
31
$110,065
8
$36,018
4
$80,022
1
$11,280
APPLICATIONS APPROVED, NOT ACCEPTED
1
$68,900
1
$101,480
4
$117,292
1
$34,450
0
$0
0
$0
APPLICATIONS DENIED
1
$52,620
2
$50,425
8
$80,962
9
$27,979
1
$73,920
1
$10,020
APPLICATIONS WITHDRAWN
0
$0
2
$73,915
9
$100,224
1
$103,980
0
$0
0
$0
FILES CLOSED FOR INCOMPLETENESS
0
$0
1
$48,860
1
$131,540
0
$0
0
$0
0
$0
Aggregated Statistics For Year 2004 (Based on 2 partial tracts)
A) FHA, FSA/RHS & VA Home Purchase Loans
B) Conventional Home Purchase Loans
C) Refinancings
D) Home Improvement Loans
F) Non-occupant Loans on < 5 Family Dwellings (A B C & D)
G) Loans On Manufactured Home Dwelling (A B C & D)
Number
Average Value
Number
Average Value
Number
Average Value
Number
Average Value
Number
Average Value
Number
Average Value
LOANS ORIGINATED
0
$0
19
$65,146
35
$71,839
9
$16,426
3
$76,003
1
$6,260
APPLICATIONS APPROVED, NOT ACCEPTED
0
$0
1
$28,810
3
$72,037
0
$0
0
$0
0
$0
APPLICATIONS DENIED
1
$49,490
8
$46,040
12
$89,941
6
$31,738
1
$110,250
3
$14,200
APPLICATIONS WITHDRAWN
0
$0
2
$71,410
9
$94,378
1
$23,180
0
$0
0
$0
FILES CLOSED FOR INCOMPLETENESS
0
$0
1
$98,970
3
$83,310
1
$43,220
0
$0
0
$0
Aggregated Statistics For Year 2003 (Based on 2 partial tracts)
A) FHA, FSA/RHS & VA Home Purchase Loans
B) Conventional Home Purchase Loans
C) Refinancings
D) Home Improvement Loans
F) Non-occupant Loans on < 5 Family Dwellings (A B C & D)
Number
Average Value
Number
Average Value
Number
Average Value
Number
Average Value
Number
Average Value
LOANS ORIGINATED
3
$71,410
17
$85,964
70
$75,750
12
$20,671
4
$66,398
APPLICATIONS APPROVED, NOT ACCEPTED
0
$0
0
$0
4
$96,310
0
$0
0
$0
APPLICATIONS DENIED
1
$59,510
0
$0
18
$77,499
4
$27,405
0
$0
APPLICATIONS WITHDRAWN
0
$0
2
$38,835
9
$74,890
1
$1,880
1
$33,830
FILES CLOSED FOR INCOMPLETENESS
0
$0
0
$0
1
$41,340
1
$12,530
0
$0
Aggregated Statistics For Year 2002 (Based on 2 partial tracts)
A) FHA, FSA/RHS & VA Home Purchase Loans
B) Conventional Home Purchase Loans
C) Refinancings
D) Home Improvement Loans
F) Non-occupant Loans on < 5 Family Dwellings (A B C & D)
Number
Average Value
Number
Average Value
Number
Average Value
Number
Average Value
Number
Average Value
LOANS ORIGINATED
2
$69,215
17
$72,699
54
$86,768
7
$31,589
6
$41,133
APPLICATIONS APPROVED, NOT ACCEPTED
0
$0
1
$24,430
3
$59,717
1
$33,200
0
$0
APPLICATIONS DENIED
1
$49,490
4
$30,068
16
$81,941
2
$25,055
1
$3,130
APPLICATIONS WITHDRAWN
0
$0
1
$78,930
4
$108,210
1
$15,660
0
$0
FILES CLOSED FOR INCOMPLETENESS
0
$0
0
$0
0
$0
0
$0
0
$0
Aggregated Statistics For Year 2001 (Based on 2 partial tracts)
A) FHA, FSA/RHS & VA Home Purchase Loans
B) Conventional Home Purchase Loans
C) Refinancings
D) Home Improvement Loans
F) Non-occupant Loans on < 5 Family Dwellings (A B C & D)
Number
Average Value
Number
Average Value
Number
Average Value
Number
Average Value
Number
Average Value
LOANS ORIGINATED
3
$64,937
9
$66,886
40
$68,293
8
$11,431
2
$42,595
APPLICATIONS APPROVED, NOT ACCEPTED
0
$0
1
$31,320
1
$127,160
1
$9,400
0
$0
APPLICATIONS DENIED
1
$15,660
3
$50,113
11
$60,818
4
$11,588
0
$0
APPLICATIONS WITHDRAWN
0
$0
2
$104,920
8
$47,059
0
$0
0
$0
FILES CLOSED FOR INCOMPLETENESS
0
$0
0
$0
0
$0
0
$0
0
$0
Aggregated Statistics For Year 2000 (Based on 2 partial tracts)
A) FHA, FSA/RHS & VA Home Purchase Loans
B) Conventional Home Purchase Loans
C) Refinancings
D) Home Improvement Loans
F) Non-occupant Loans on < 5 Family Dwellings (A B C & D)
Number
Average Value
Number
Average Value
Number
Average Value
Number
Average Value
Number
Average Value
LOANS ORIGINATED
2
$53,555
13
$71,217
18
$59,229
14
$18,926
3
$34,033
APPLICATIONS APPROVED, NOT ACCEPTED
0
$0
1
$30,690
4
$55,122
3
$34,660
0
$0
APPLICATIONS DENIED
0
$0
4
$64,362
11
$50,625
6
$9,918
1
$113,380
APPLICATIONS WITHDRAWN
1
$81,430
3
$56,583
3
$77,673
3
$38,420
1
$46,350
FILES CLOSED FOR INCOMPLETENESS
0
$0
0
$0
1
$41,970
0
$0
0
$0
Aggregated Statistics For Year 1999 (Based on 1 partial tract)
A) FHA, FSA/RHS & VA Home Purchase Loans
B) Conventional Home Purchase Loans
C) Refinancings
D) Home Improvement Loans
F) Non-occupant Loans on < 5 Family Dwellings (A B C & D)
Detailed PMIC statistics for the following Tracts:0304.00
2002 - 2018 National Fire Incident Reporting System (NFIRS) incidents
Based on the data from the years 2002 - 2018 the average number of fire incidents per year is 21. The highest number of fire incidents - 35 took place in 2012, and the least - 0 in 2004. The data has a dropping trend.
When looking into fire subcategories, the most reports belonged to: Structure Fires (45.0%), and Outside Fires (42.7%).
Fire incident types reported to NFIRS in Zip Code 61277


 Nearest zip codes: 61258, 61261, 61283, 61251, 61250, 61234.


 Based on the data from the years 2002 - 2018 the average number of fire incidents per year is 21. The highest number of fire incidents - 35 took place in 2012, and the least - 0 in 2004. The data has a dropping trend.
 When looking into fire subcategories, the most reports belonged to: Structure Fires (45.0%), and Outside Fires (42.7%).