Estimated zip code population in 2022: 11,384 Zip code population in 2010: 9,021 Zip code population in 2000: 5,477
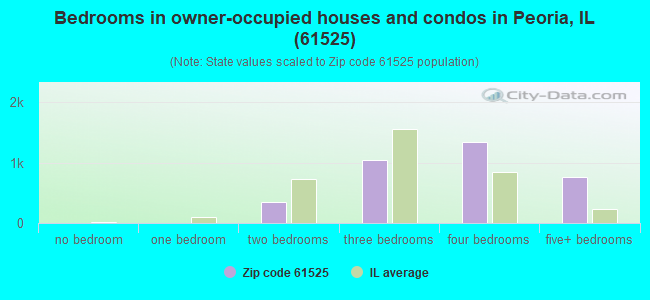
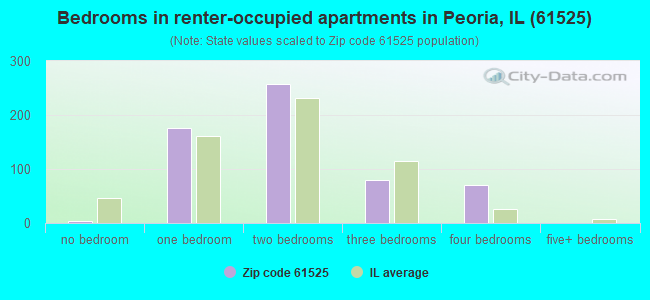
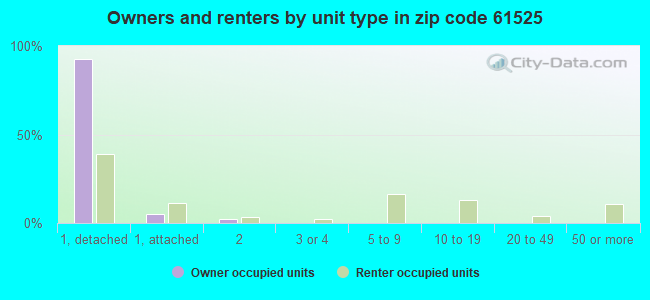
Houses and condos: 4,291 Renter-occupied apartments: 593
% of renters here:
15%
State:
33%
March 2022 cost of living index in zip code 61525: 84.4 (less than average, U.S. average is 100)
Land area: 31.3 sq. mi. Water area: 0.0 sq. mi.
Population density: 363 people per square mile
(very low).
OSM Map
General Map
Google Map
MSN Map
OSM Map
General Map
Google Map
MSN Map
OSM Map
General Map
Google Map
MSN Map
OSM Map
General Map
Google Map
MSN Map
Please wait while loading the map...
Real estate property taxes paid for housing units in 2022:
This zip code:
2.2% ($7,089)
Illinois:
2.0% ($4,912)
Median real estate property taxes paid for housing units with mortgages in 2022: $7,514 (2.1%) Median real estate property taxes paid for housing units with no mortgage in 2022: $5,521 (2.1%)
Business Search- 14 Million verified businesses
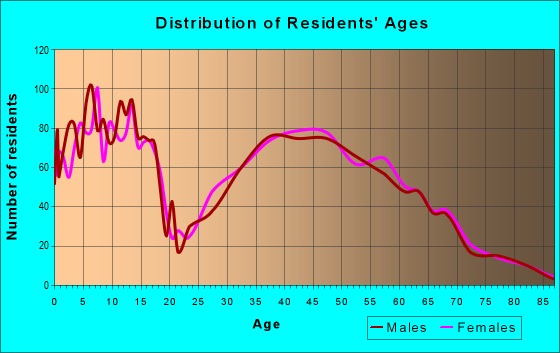
Males: 5,662
(49.7%)
Females: 5,721
(50.3%)
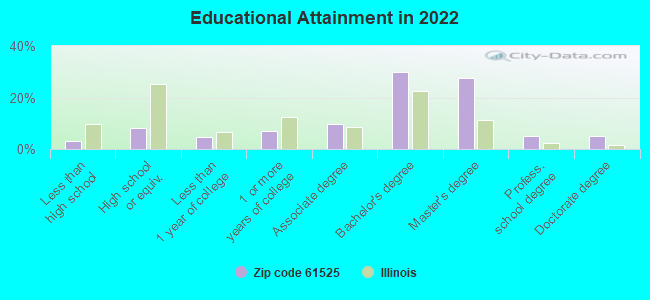
For population 25 years and over in 61525:
High school or higher: 98.2%
Bachelor's degree or higher: 68.2%
Graduate or professional degree: 38.0%
Unemployed: 2.5%
Mean travel time to work (commute): 18.5 minutes
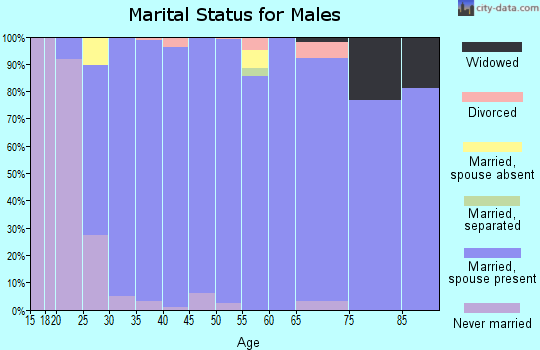
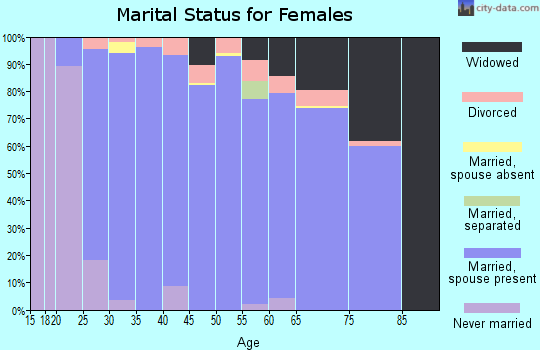
For population 15 years and over in 61525:
Never married: 20.8%
Now married: 68.9%
Separated: 0.5%
Widowed: 4.5%
Divorced: 5.4%
Zip code 61525 compared to state average:
Median household income above state average.
Unemployed percentage below state average.
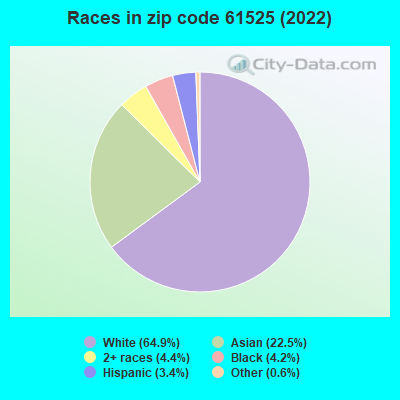
Black race population percentage significantly below state average.
Hispanic race population percentage significantly below state average.
Renting percentage significantly below state average.
Number of rooms per house above state average.
House age significantly below state average.
Percentage of population with a bachelor's degree or higher above state average.
Estimated median house/condo value in 2022: $327,575
61525:
$327,575
Illinois:
$251,600
According to our research of Illinois and other state lists, there were 4 registered sex offenders living in 61525 zip code as of April 26, 2024. The ratio of all residents to sex offenders in zip code 61525 is 2,350 to 1. The ratio of registered sex offenders to all residents in this zip code is much lower than the state average.
Median resident age:
This zip code:
35.5 years
Illinois median age:
39.1 years
Average household size:
This zip code:
2.8 people
Illinois:
2.4 people
Averages for the 2020 tax year for zip code 61525, filed in 2021:
Average Adjusted Gross Income (AGI) in 2020: $154,193 (Individual Income Tax Returns)
Here:
$154,193
State:
$82,626
Salary/wage: $121,674 (reported on 84.6% of returns)
Here:
$121,674
State:
$66,640
(% of AGI for various income ranges: 1181.2% for AGIs below $25k, 3377.8% for AGIs $25k-50k, 5842.2% for AGIs $50k-75k, 8662.1% for AGIs $75k-100k, 16416.4% for AGIs $100k-200k, 73998.2% for AGIs over 200k)
Taxable interest for individuals: $1,548 (reported on 64.8% of returns)
This zip code:
$1,548
Illinois:
$2,376
(% of AGI for various income ranges: 27.5% for AGIs below $25k, 52.4% for AGIs $25k-50k, 76.9% for AGIs $50k-75k, 80.9% for AGIs $75k-100k, 139.9% for AGIs $100k-200k, 707.9% for AGIs over 200k)
Ordinary dividends: $8,385 (reported on 42.2% of returns)
Here:
$8,385
State:
$9,061
(% of AGI for various income ranges: 58.8% for AGIs below $25k, 106.1% for AGIs $25k-50k, 115.8% for AGIs $50k-75k, 199.4% for AGIs $75k-100k, 390.2% for AGIs $100k-200k, 3129.5% for AGIs over 200k)
Net capital gain/loss in AGI: +$26,798 (reported on 38.0% of returns)
Here:
+$26,798
State:
+$31,684
(% of AGI for various income ranges: 34.7% for AGIs below $25k, 65.1% for AGIs $25k-50k, 115.6% for AGIs $50k-75k, 152.4% for AGIs $75k-100k, 405.6% for AGIs $100k-200k, 11862.6% for AGIs over 200k)
Profit/loss from business: +$19,780 (reported on 13.3% of returns)
Here:
+$19,780
State:
+$12,175
(% of AGI for various income ranges: 48.0% for AGIs below $25k, 67.3% for AGIs $25k-50k, 195.0% for AGIs $50k-75k, 249.4% for AGIs $75k-100k, 366.9% for AGIs $100k-200k, 1953.9% for AGIs over 200k)
Taxable individual retirement arrangement distribution: $30,873 (reported on 12.5% of returns)
61525:
$30,873
Illinois:
$21,613
(% of AGI for various income ranges: 56.7% for AGIs below $25k, 172.4% for AGIs $25k-50k, 259.7% for AGIs $50k-75k, 405.2% for AGIs $75k-100k, 589.4% for AGIs $100k-200k, 2668.7% for AGIs over 200k)
Self-employed (Keogh) retirement plans: $28,260 (reported on 1.0% of returns)
61525:
$28,260
Illinois:
$30,962
(% of AGI for various income ranges: 371.8% for AGIs over 200k)
Total itemized deductions: $36,064 (reported on 13.3% of returns)
Here:
$36,064
State:
$34,948
(% of AGI for various income ranges: 135.2% for AGIs below $25k, 186.1% for AGIs $50k-75k, 488.5% for AGIs $75k-100k, 589.4% for AGIs $100k-200k, 3946.6% for AGIs over 200k)
Charity contributions: $17,675 (reported on 11.1% of returns)
Here:
$17,675
State:
$13,122
(% of AGI for various income ranges: 6.2% for AGIs below $25k, 17.2% for AGIs $50k-75k, 106.7% for AGIs $75k-100k, 197.0% for AGIs $100k-200k, 1941.1% for AGIs over 200k)
Taxes paid: $9,165 (reported on 13.1% of returns)
61525:
$9,165
State:
$8,563
(% of AGI for various income ranges: 25.5% for AGIs below $25k, 55.6% for AGIs $50k-75k, 137.9% for AGIs $75k-100k, 193.3% for AGIs $100k-200k, 863.9% for AGIs over 200k)
Earned income credit: $1,965 (reported on 5.3% of returns)
Here:
$1,965
State:
$2,311
(% of AGI for various income ranges: 42.7% for AGIs below $25k, 58.0% for AGIs $25k-50k)
Percentage of individuals using paid preparers for their 2020 taxes: 93.7%
Here:
94%
State:
93%
(% for various income ranges: 91.3% for AGIs below $25k, 92.5% for AGIs $25k-50k, 93.9% for AGIs $50k-75k, 93.5% for AGIs $75k-100k, 94.6% for AGIs $100k-200k, 95.9% for AGIs over 200k)
Averages for the 2012 tax year for zip code 61525, filed in 2013:
Average Adjusted Gross Income (AGI) in 2012: $135,803 (Individual Income Tax Returns)
Here:
$135,803
State:
$68,058
Salary/wage: $117,579 (reported on 88.5% of returns)
Here:
$117,579
State:
$55,396
(% of AGI for various income ranges: 73.5% for AGIs below $25k, 72.3% for AGIs $25k-50k, 70.3% for AGIs $50k-75k, 79.7% for AGIs $75k-100k, 81.9% for AGIs $100k-200k, 74.0% for AGIs over 200k)
Taxable interest for individuals: $1,254 (reported on 66.1% of returns)
This zip code:
$1,254
Illinois:
$1,969
(% of AGI for various income ranges: 1.8% for AGIs below $25k, 0.9% for AGIs $25k-50k, 0.8% for AGIs $50k-75k, 0.6% for AGIs $75k-100k, 0.5% for AGIs $100k-200k, 0.6% for AGIs over 200k)
Ordinary dividends: $8,211 (reported on 41.6% of returns)
Here:
$8,211
State:
$7,786
(% of AGI for various income ranges: 2.9% for AGIs below $25k, 3.0% for AGIs $25k-50k, 2.0% for AGIs $50k-75k, 1.2% for AGIs $75k-100k, 1.5% for AGIs $100k-200k, 3.2% for AGIs over 200k)
Net capital gain/loss in AGI: +$9,140 (reported on 33.3% of returns)
Here:
+$9,140
State:
+$22,183
(% of AGI for various income ranges: 0.2% for AGIs below $25k, 0.5% for AGIs $25k-50k, 0.7% for AGIs $50k-75k, 0.4% for AGIs $75k-100k, 1.1% for AGIs $100k-200k, 3.4% for AGIs over 200k)
Profit/loss from business: +$22,939 (reported on 11.5% of returns)
Here:
+$22,939
State:
+$12,903
(% of AGI for various income ranges: 4.6% for AGIs below $25k, 3.0% for AGIs $25k-50k, 2.9% for AGIs $50k-75k, 2.1% for AGIs $75k-100k, 1.6% for AGIs $100k-200k, 1.9% for AGIs over 200k)
Taxable individual retirement arrangement distribution: $21,941 (reported on 12.7% of returns)
61525:
$21,941
Illinois:
$17,929
(% of AGI for various income ranges: 4.1% for AGIs below $25k, 3.3% for AGIs $25k-50k, 3.8% for AGIs $50k-75k, 1.6% for AGIs $75k-100k, 2.0% for AGIs $100k-200k, 1.8% for AGIs over 200k)
Self-employment retirement plans: $19,500 (reported on 1.4% of returns)
61525:
$19,500
Illinois:
$24,666
(% of AGI for various income ranges: 1.0% for AGIs $75k-100k, 0.2% for AGIs over 200k)
Total itemized deductions: $31,340 (15% of AGI, reported on 55.9% of returns)
Here:
$31,340
State:
$26,433
Here:
15.0% of AGI
State:
19.2% of AGI
(% of AGI for various income ranges: 10.5% for AGIs below $25k, 11.8% for AGIs $25k-50k, 12.6% for AGIs $50k-75k, 14.5% for AGIs $75k-100k, 14.6% for AGIs $100k-200k, 11.9% for AGIs over 200k)
Charity contributions: $6,528 (reported on 48.6% of returns)
Here:
$6,528
State:
$4,525
(% of AGI for various income ranges: 1.0% for AGIs below $25k, 1.9% for AGIs $25k-50k, 1.6% for AGIs $50k-75k, 1.8% for AGIs $75k-100k, 2.3% for AGIs $100k-200k, 2.6% for AGIs over 200k)
Taxes paid: $16,272 (reported on 55.9% of returns)
61525:
$16,272
State:
$11,968
(% of AGI for various income ranges: 3.0% for AGIs below $25k, 4.0% for AGIs $25k-50k, 5.1% for AGIs $50k-75k, 6.4% for AGIs $75k-100k, 7.4% for AGIs $100k-200k, 6.8% for AGIs over 200k)
Earned income credit: $1,910 (reported on 4.5% of returns)
Here:
$1,910
State:
$2,349
(% of AGI for various income ranges: 2.7% for AGIs below $25k, 0.7% for AGIs $25k-50k)
Percentage of individuals using paid preparers for their 2012 taxes: 50.5%
Here:
50%
State:
57%
(% for various income ranges: 45.1% for AGIs below $25k, 48.9% for AGIs $25k-50k, 59.1% for AGIs $50k-75k, 49.0% for AGIs $75k-100k, 44.6% for AGIs $100k-200k, 65.7% for AGIs over 200k)
Averages for the 2004 tax year for zip code 61525, filed in 2005:
Average Adjusted Gross Income (AGI) in 2004: $92,871 (Individual Income Tax Returns)
Here:
$92,871
State:
$54,625
Salary/wage: $82,178 (reported on 87.1% of returns)
Here:
$82,178
State:
$46,811
(% of AGI for various income ranges: 107.9% for AGIs below $10k, 71.4% for AGIs $10k-25k, 74.8% for AGIs $25k-50k, 79.2% for AGIs $50k-75k, 83.4% for AGIs $75k-100k, 75.5% for AGIs over 100k)
Taxable interest for individuals: $1,711 (reported on 69.9% of returns)
This zip code:
$1,711
Illinois:
$2,101
(% of AGI for various income ranges: 6.8% for AGIs below $10k, 3.7% for AGIs $10k-25k, 2.3% for AGIs $25k-50k, 1.5% for AGIs $50k-75k, 1.2% for AGIs $75k-100k, 1.1% for AGIs over 100k)
Taxable dividends: $3,323 (reported on 46.2% of returns)
Here:
$3,323
State:
$4,306
(% of AGI for various income ranges: 7.4% for AGIs below $10k, 1.9% for AGIs $10k-25k, 2.2% for AGIs $25k-50k, 1.2% for AGIs $50k-75k, 1.0% for AGIs $75k-100k, 1.7% for AGIs over 100k)
Net capital gain/loss: +$8,890 (reported on 36.6% of returns)
Here:
+$8,890
State:
+$17,321
(% of AGI for various income ranges: -4.0% for AGIs below $10k, 0.5% for AGIs $10k-25k, -0.1% for AGIs $25k-50k, 0.5% for AGIs $50k-75k, 0.9% for AGIs $75k-100k, 4.9% for AGIs over 100k)
Profit/loss from business: +$21,665 (reported on 13.3% of returns)
Here:
+$21,665
State:
+$11,771
(% of AGI for various income ranges: 7.2% for AGIs below $10k, 4.3% for AGIs $10k-25k, 4.1% for AGIs $25k-50k, 2.4% for AGIs $50k-75k, 2.8% for AGIs $75k-100k, 3.1% for AGIs over 100k)
IRA payment deduction: $3,264 (reported on 3.0% of returns)
61525:
$3,264
Illinois:
$3,087
(% of AGI for various income ranges: 1.7% for AGIs below $10k, 0.4% for AGIs $25k-50k, 0.2% for AGIs $50k-75k, 0.1% for AGIs $75k-100k, 0.0% for AGIs over 100k)
Self-employed pension: $16,500 (reported on 1.5% of returns)
Here:
$16,500
Illinois:
$16,965
Total itemized deductions: $21,471 (14% of AGI, reported on 49.3% of returns)
Here:
$21,471
State:
$20,239
Here:
14.2% of AGI
State:
19.5% of AGI
(% of AGI for various income ranges: 7.3% for AGIs below $10k, 12.4% for AGIs $10k-25k, 11.4% for AGIs $25k-50k, 12.8% for AGIs $50k-75k, 14.9% for AGIs $75k-100k, 10.5% for AGIs over 100k)
Charity contributions deductions: $4,935 (3% of AGI, reported on 45.3% of returns)
Here:
$4,935
State:
$3,719
Here:
3.1% of AGI
State:
3.4% of AGI
(% of AGI for various income ranges: 0.5% for AGIs below $10k, 1.4% for AGIs $10k-25k, 1.6% for AGIs $25k-50k, 2.1% for AGIs $50k-75k, 2.3% for AGIs $75k-100k, 2.6% for AGIs over 100k)
Total tax: $19,668 (reported on 82.7% of returns)
61525:
$19,668
State:
$9,882
(% of AGI for various income ranges: 2.6% for AGIs below $10k, 4.9% for AGIs $10k-25k, 7.6% for AGIs $25k-50k, 9.3% for AGIs $50k-75k, 10.4% for AGIs $75k-100k, 21.5% for AGIs over 100k)
Earned income credit: $1,549 (reported on 3.8% of returns)
Here:
$1,549
State:
$1,788
Percentage of individuals using paid preparers for their 2004 taxes: 51.5%
Here:
52%
State:
61%
(% for various income ranges: 42.8% for AGIs below $10k, 56.4% for AGIs $10k-25k, 53.5% for AGIs $25k-50k, 52.4% for AGIs $50k-75k, 49.7% for AGIs $75k-100k, 55.4% for AGIs over 100k)
Household received Food Stamps/SNAP in the past 12 months: 168 Household did not receive Food Stamps/SNAP in the past 12 months: 3,843
Women who had a birth in the past 12 months: 145 (139 now married, 5 unmarried) Women who did not have a birth in the past 12 months: 2,538 (1,624 now married, 891 unmarried)
Housing units in zip code 61525 with a mortgage: 2,499 (68 second mortgage, 2 home equity loan, 66 both second mortgage and home equity loan) Houses without a mortgage: 24
Median monthly owner costs for units with a mortgage: $2,400 Median monthly owner costs for units without a mortgage: $881
Residents with income below the poverty level in 2022:
This zip code:
2.7%
Whole state:
11.9%
Residents with income below 50% of the poverty level in 2022:
This zip code:
0.7%
Whole state:
5.7%
Median number of rooms in houses and condos:
Here:
8.0
State:
6.4
Median number of rooms in apartments:
Here:
4.8
State:
4.1
Notable locations in this zip code not listed on our city pages
Notable locations in zip code 61525: Radnor Grange Hall (A), Dunlap Public Library (B), Dunlap Fire Protection District (C), Dunlap Fire Protection District Station 2 (D). Display/hide their locations on the map
Parks in zip code 61525 include: Hickory Grove Park (1), North Park (2), Leslie Rutherford Park (3), Glen Oak Park (4). Display/hide their locations on the map
Size of family households: 1,157 2-persons, 674 3-persons, 1,050 4-persons, 246 5-persons, 38 6-persons, 37 7-or-more-persons
Size of nonfamily households: 771 1-person, 53 2-persons, 2 4-persons
2,977 married couples with children.
613 single-parent households (317 men, 296 women).
73.6% of residents of 61525 zip code speak English at home.
2.1% of residents speak Spanish at home (94% very well, 1% well, 5% not well).
10.0% of residents speak other Indo-European language at home (92% very well, 3% well, 5% not at all).
11.7% of residents speak Asian or Pacific Island language at home (78% very well, 12% well, 10% not well).
2.3% of residents speak other language at home (68% very well, 24% well, 9% not well).
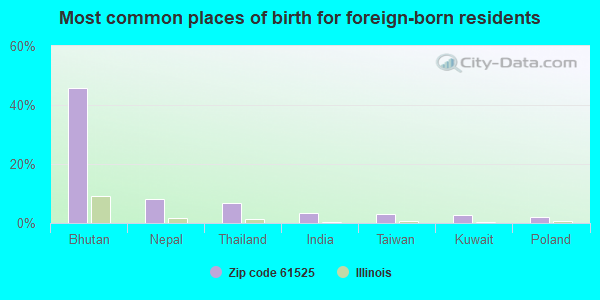
Foreign born population: 2,198 (19.3%) (54.1% of them are naturalized citizens)
This zip code:
19.3%
Whole state:
14.4%
46%Bhutan
8%Nepal
7%Thailand
3%India
3%Taiwan
3%Kuwait
2%Poland
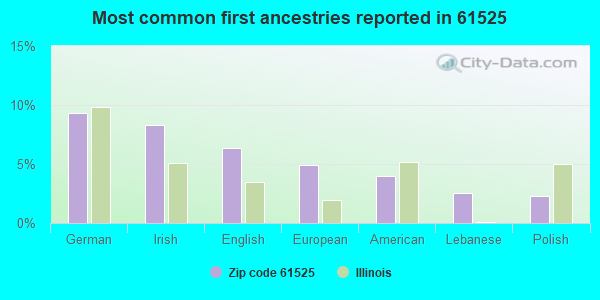
9%German
8%Irish
6%English
5%European
4%American
3%Lebanese
2%Polish
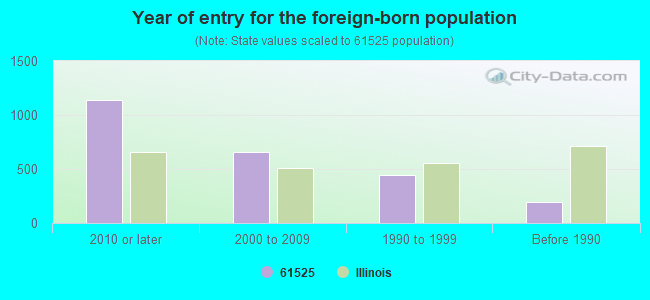
Year of entry for the foreign-born population
1,1352010 or later
6612000 to 2009
4401990 to 1999
194Before 1990
Facilities with environmental interests located in this zip code:
MEDINA UTILITIES-EAST STP (WONDERVIEW DRIVE in DUNLAP, IL)
STATE MASTER (Illinois EPA Project) - National Pollutant Discharge Elimination System Permit National Pollutant Discharge Elimination System NON-MAJOR (Tracking pollutant discharge elimination systems) - permit National Pollutant Discharge Elimination System NON-MAJOR (Tracking pollutant discharge elimination systems) - permit Business SIC classification: SEWERAGE SYSTEMS Alternative names: MEDINA UTILITIES, INC. - EAST
MONICA ELEVATOR CO (300 1ST ST in DUNLAP, IL)
STATE MASTER (Illinois EPA Project) - AIR PROGRAM AIR MINOR (AIRS/AFS) CRITERIA AND HAZARDOUS AIR POLLUTANT INVENTORY (Inventory of air pollution sources) Business SIC classification: GRAIN AND FIELD BEANS Alternative names: ARCHER DANIELS MIDLAND TABOR GRAIN COMPANY, ARCHER DANIELS MIDLAND TABOR GRAIN COMPANY
GREENVIEW CO (2700 W CEDAR HILLS in DUNLAP, IL)
STATE MASTER (Illinois EPA Project) - SOLID WASTE PROGRAM, HAZARDOUS WASTE PROGRAM Small Quantity Generators, between 100 kg and 1000 kg of hazardous waste/month (Resource Conservation and Recovery Act (tracking hazardous waste)) - notification Conditionally Exempt Small Quantity Generators, less than 100 kg/month of hazardous waste (Resource Conservation and Recovery Act (tracking hazardous waste)) - notification Organizations: HOERR THOMAS (CONTACT/OWNER)
, HOERR TOM SR (CONTACT/OWNER)
Alternative names: GREEN VIEW COMPANIES
CONVENIENT EXPRESS INC (13821 RTE 91 in DUNLAP, IL)
STATE MASTER (Illinois EPA Project) - SOLID WASTE PROGRAM, HAZARDOUS WASTE PROGRAM Large Quantity Generators, more that 1000 kg of hazardous waste/month (Resource Conservation and Recovery Act (tracking hazardous waste)) - notification
KENNY LEWIS ANTIQUES (ROUTE 91, 4TH ST in DUNLAP, IL)
STATE MASTER (Illinois EPA Project) - AIR PROGRAM AIR MINOR (AIRS/AFS) Business SIC classification: NONCLASSIFIABLE ESTABLISHMENTS
PEORIA COUNTY SERVICE CO (2ND ST in DUNLAP, IL)
STATE MASTER (Illinois EPA Project) - AIR PROGRAM AIR MINOR (AIRS/AFS) Business SIC classification: FARM SUPPLIES
PEORIA COUNTY OF (15047 EVANSMILL RD in DUNLAP, IL)
STATE MASTER (Illinois EPA Project) - HAZARDOUS WASTE PROGRAM Conditionally Exempt Small Quantity Generators, less than 100 kg/month of hazardous waste (Resource Conservation and Recovery Act (tracking hazardous waste)) - notification Organizations: COUNTY OF PEORIA (CONTACT/OWNER)
AMOCO FERTILIZER PLANT (NORTH E PART OF TOWN in DUNLAP, IL)
(Resource Conservation and Recovery Act (tracking hazardous waste))
KRAFT FERTILIZER INCORPORATED (7001 PARK SCHOOL ROAD in DUNLAP, IL)
ENFORCEMENT/COMPLIANCE ACTIVITY (Integrated Compliance Information System)
Housing units lacking complete plumbing facilities: 1.2% Housing units lacking complete kitchen facilities: 1.2%
76.6%Utility gas
15.3%Electricity
7.6%Bottled, tank, or LP gas
Population in 1990: 4,669. Population change in the 1990s: +808 (+17.3%).
Place of birth for U.S.-born residents:
This state: 6,793
Northeast: 275
Midwest: 1,002
South: 619
West: 366
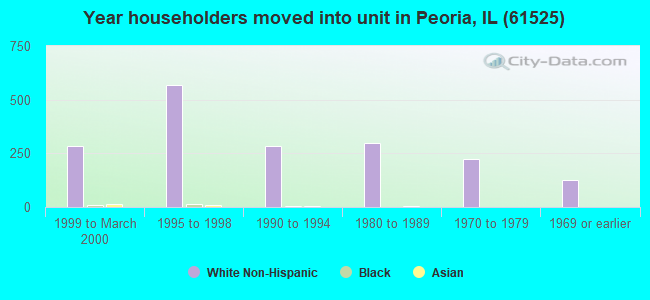
55% of the 61525 zip code residents lived in the same house 5 years ago. Out of people who lived in different houses, 53% lived in this county. Out of people who lived in different counties, 50% lived in Illinois.
87% of the 61525 zip code residents lived in the same house 1 year ago. Out of people who lived in different houses, 60% moved from this county. Out of people who lived in different houses, 17% moved from different county within same state. Out of people who lived in different houses, 16% moved from different state. Out of people who lived in different houses, 7% moved from abroad.
Private vs. public school enrollment:
Students in private schools in grades 1 to 8 (elementary and middle school): 213
Here:
13.2%
Illinois:
13.3%
Students in private schools in grades 9 to 12 (high school): 66
Here:
9.2%
Illinois:
9.9%
Students in private undergraduate colleges: 28
Here:
9.7%
Illinois:
27.4%
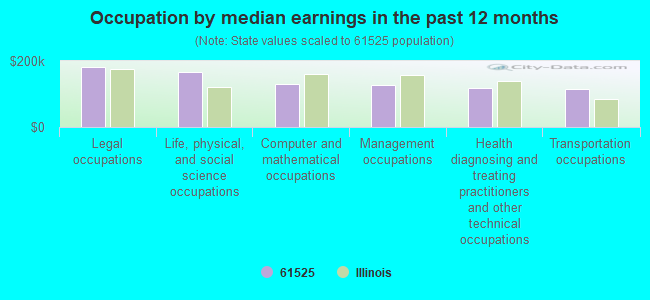
Occupation by median earnings in the past 12 months ($)
180,877Legal occupations
166,410Life, physical, and social science occupations
131,804Computer and mathematical occupations
125,959Management occupations
118,949Health diagnosing and treating practitioners and other technical occupations
114,217Transportation occupations
Companies with federal contracts located in this zip code:
HOPPER, JAMES J (12213 N WOODCREST DR APT in DUNLAP, IL; small business) : $130,260 in 3 contractsfrom 2003 to 2004
$70,200 with Army for Other Medical Services. Taking place in GA. Signed on 2004-03-11. Completion date: 2004-04-02.
$65,000, same as above.Signed on 2003-11-06. Completion date: 2004-04-02.
-$4,940, same as above.Signed on 2004-09-29. Completion date: 2004-04-02.
COMMERCIAL MECHANICAL INC (50 FIRST ST in DUNLAP, IL) 60 employees, $21000000 revenue
$31,000 with Agricultural Research Service (disused code) for Maintenance, Repair or Alteration of Real Property -- Government-Owned Government-Operated (GOGO) R&D Facilities. Signed on 2000-04-15. Completion date: 2000-04-15.
Top industries in this zip code by the number of employees in 2005:
2002 - 2018 National Fire Incident Reporting System (NFIRS) incidents
According to the data from the years 2002 - 2018 the average number of fire incidents per year is 19. The highest number of fires - 55 took place in 2018, and the least - 0 in 2003. The data has an increasing trend.
When looking into fire subcategories, the most incidents belonged to: Outside Fires (49.2%), and Structure Fires (36.1%).
Fire incident types reported to NFIRS in Zip Code 61525
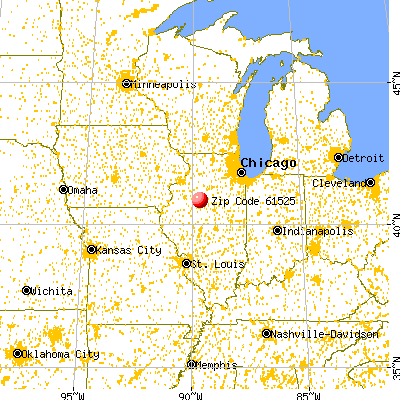


 Nearest zip codes: 61528, 61526, 61552, 61614, 61615, 61559.
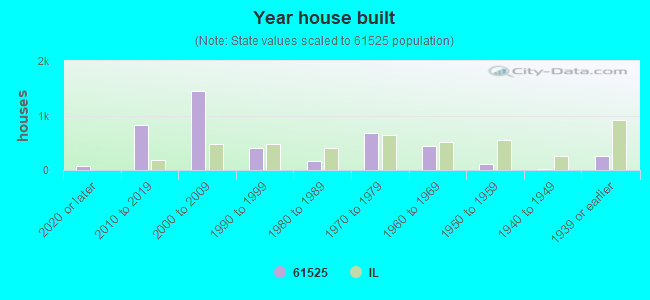


 According to the data from the years 2002 - 2018 the average number of fire incidents per year is 19. The highest number of fires - 55 took place in 2018, and the least - 0 in 2003. The data has an increasing trend.
 When looking into fire subcategories, the most incidents belonged to: Outside Fires (49.2%), and Structure Fires (36.1%).