Estimated zip code population in 2022: 972 Zip code population in 2010: 860 Zip code population in 2000: 597
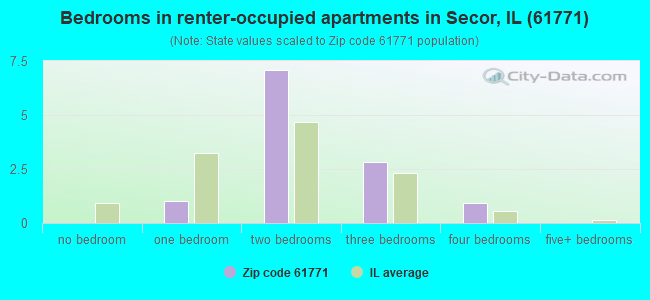
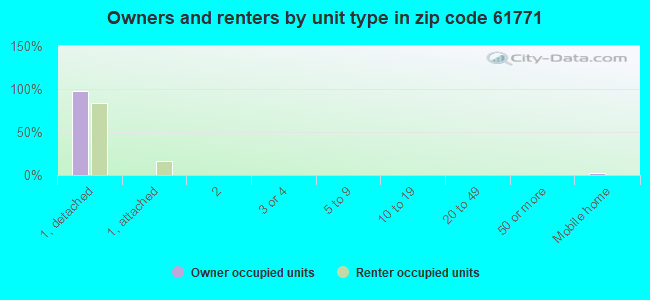
Houses and condos: 388 Renter-occupied apartments: 12
% of renters here:
4%
State:
33%
March 2022 cost of living index in zip code 61771: 85.8 (less than average, U.S. average is 100)
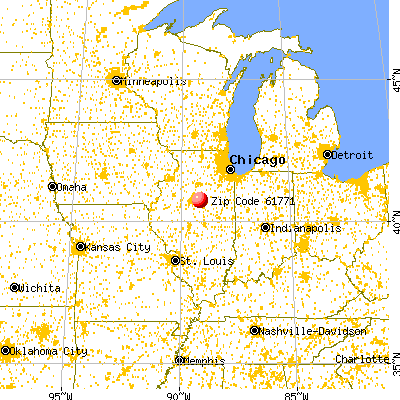
Land area: 23.0 sq. mi. Water area: 0.0 sq. mi.
Population density: 42 people per square mile
(very low).
OSM Map
General Map
Google Map
MSN Map
OSM Map
General Map
Google Map
MSN Map
OSM Map
General Map
Google Map
MSN Map
OSM Map
General Map
Google Map
MSN Map
Please wait while loading the map...
Real estate property taxes paid for housing units in 2022:
This zip code:
2.2% ($5,625)
Illinois:
2.0% ($4,912)
Median real estate property taxes paid for housing units with mortgages in 2022: $7,271 (1.9%) Median real estate property taxes paid for housing units with no mortgage in 2022: $3,977 (2.4%)
Averages for the 2020 tax year for zip code 61771, filed in 2021:
Average Adjusted Gross Income (AGI) in 2020: $72,117 (Individual Income Tax Returns)
Here:
$72,117
State:
$82,626
Salary/wage: $55,517 (reported on 87.2% of returns)
Here:
$55,517
State:
$66,640
(% of AGI for various income ranges: 1250.0% for AGIs below $25k, 3820.0% for AGIs $25k-50k, 6008.0% for AGIs $50k-75k, 8933.3% for AGIs $75k-100k, 13293.3% for AGIs $100k-200k)
Taxable interest for individuals: $800 (reported on 46.8% of returns)
This zip code:
$800
Illinois:
$2,376
(% of AGI for various income ranges: 12.2% for AGIs below $25k, 11.4% for AGIs $25k-50k, 36.0% for AGIs $50k-75k, 133.3% for AGIs $75k-100k, 63.3% for AGIs $100k-200k)
Ordinary dividends: $1,782 (reported on 23.4% of returns)
Here:
$1,782
State:
$9,061
(% of AGI for various income ranges: 17.8% for AGIs below $25k, 74.0% for AGIs $50k-75k, 238.3% for AGIs $100k-200k)
Net capital gain/loss in AGI: +$4,262 (reported on 17.0% of returns)
Here:
+$4,262
State:
+$31,684
(% of AGI for various income ranges: 110.0% for AGIs $50k-75k, 476.7% for AGIs $100k-200k)
Profit/loss from business: +$15,583 (reported on 12.8% of returns)
Here:
+$15,583
State:
+$12,175
(% of AGI for various income ranges: 142.2% for AGIs below $25k, 432.0% for AGIs $50k-75k, 985.0% for AGIs $100k-200k)
Taxable individual retirement arrangement distribution: $14,925 (reported on 8.5% of returns)
61771:
$14,925
Illinois:
$21,613
(% of AGI for various income ranges: 298.9% for AGIs below $25k, 1093.3% for AGIs $75k-100k)
Total itemized deductions: $27,950 (reported on 4.3% of returns)
Here:
$27,950
State:
$34,948
(% of AGI for various income ranges: 1863.3% for AGIs $75k-100k)
Taxes paid: $9,850 (reported on 4.3% of returns)
61771:
$9,850
State:
$8,563
(% of AGI for various income ranges: 656.7% for AGIs $75k-100k)
Earned income credit: $1,680 (reported on 10.6% of returns)
Here:
$1,680
State:
$2,311
(% of AGI for various income ranges: 18.9% for AGIs below $25k, 95.7% for AGIs $25k-50k)
Percentage of individuals using paid preparers for their 2020 taxes: 91.5%
Here:
91%
State:
93%
(% for various income ranges: 85.7% for AGIs below $25k, 90.0% for AGIs $25k-50k, 85.7% for AGIs $50k-75k, 100.0% for AGIs $75k-100k, 100.0% for AGIs $100k-200k, 100.0% for AGIs over 200k)
Averages for the 2012 tax year for zip code 61771, filed in 2013:
Average Adjusted Gross Income (AGI) in 2012: $61,723 (Individual Income Tax Returns)
Here:
$61,723
State:
$68,058
Salary/wage: $54,061 (reported on 81.8% of returns)
Here:
$54,061
State:
$55,396
(% of AGI for various income ranges: 73.2% for AGIs below $25k, 79.5% for AGIs $25k-50k, 85.1% for AGIs $50k-75k, 77.7% for AGIs $75k-100k, 105.8% for AGIs $100k-200k)
Taxable interest for individuals: $376 (reported on 47.7% of returns)
This zip code:
$376
Illinois:
$1,969
(% of AGI for various income ranges: 0.3% for AGIs below $25k, 0.2% for AGIs $25k-50k, 0.2% for AGIs $50k-75k, 0.4% for AGIs $75k-100k, 0.5% for AGIs $100k-200k)
Ordinary dividends: $1,762 (reported on 18.2% of returns)
Here:
$1,762
State:
$7,786
Net capital gain/loss in AGI: +$12,829 (reported on 15.9% of returns)
Here:
+$12,829
State:
+$22,183
Profit/loss from business: +$8,150 (reported on 13.6% of returns)
Here:
+$8,150
State:
+$12,903
Taxable individual retirement arrangement distribution: $6,933 (reported on 6.8% of returns)
61771:
$6,933
Illinois:
$17,929
Total itemized deductions: $21,450 (19% of AGI, reported on 31.8% of returns)
Here:
$21,450
State:
$26,433
Here:
19.1% of AGI
State:
19.2% of AGI
(% of AGI for various income ranges: 7.0% for AGIs $25k-50k, 10.0% for AGIs $50k-75k, 12.5% for AGIs $75k-100k, 23.3% for AGIs $100k-200k)
Charity contributions: $6,491 (reported on 25.0% of returns)
Here:
$6,491
State:
$4,525
(% of AGI for various income ranges: 2.4% for AGIs $25k-50k, 2.6% for AGIs $75k-100k, 7.0% for AGIs $100k-200k)
Taxes paid: $9,243 (reported on 31.8% of returns)
61771:
$9,243
State:
$11,968
(% of AGI for various income ranges: 2.5% for AGIs $25k-50k, 3.7% for AGIs $50k-75k, 5.5% for AGIs $75k-100k, 10.6% for AGIs $100k-200k)
Earned income credit: $2,140 (reported on 11.4% of returns)
Here:
$2,140
State:
$2,349
(% of AGI for various income ranges: 3.8% for AGIs below $25k, 1.2% for AGIs $25k-50k)
Percentage of individuals using paid preparers for their 2012 taxes: 59.1%
Here:
59%
State:
57%
(% for various income ranges: 53.8% for AGIs below $25k, 70.0% for AGIs $25k-50k, 62.5% for AGIs $50k-75k, 60.0% for AGIs $75k-100k, 66.7% for AGIs $100k-200k)
Averages for the 2004 tax year for zip code 61771, filed in 2005:
Average Adjusted Gross Income (AGI) in 2004: $42,069 (Individual Income Tax Returns)
Here:
$42,069
State:
$54,625
Salary/wage: $39,084 (reported on 85.0% of returns)
Here:
$39,084
State:
$46,811
(% of AGI for various income ranges: 113.4% for AGIs below $10k, 69.3% for AGIs $10k-25k, 74.6% for AGIs $25k-50k, 88.0% for AGIs $50k-75k, 83.1% for AGIs $75k-100k, 71.2% for AGIs over 100k)
Taxable interest for individuals: $878 (reported on 49.3% of returns)
This zip code:
$878
Illinois:
$2,101
(% of AGI for various income ranges: 4.0% for AGIs below $10k, 1.9% for AGIs $10k-25k, 1.9% for AGIs $25k-50k, 0.4% for AGIs $50k-75k, 0.8% for AGIs $75k-100k, 0.6% for AGIs over 100k)
Taxable dividends: $867 (reported on 20.1% of returns)
Here:
$867
State:
$4,306
(% of AGI for various income ranges: 1.6% for AGIs below $10k, 0.2% for AGIs $10k-25k, 0.3% for AGIs $25k-50k, 0.2% for AGIs $50k-75k, 0.2% for AGIs $75k-100k, 0.8% for AGIs over 100k)
Net capital gain/loss: +$6,672 (reported on 12.9% of returns)
Here:
+$6,672
State:
+$17,321
(% of AGI for various income ranges: 1.2% for AGIs below $10k, 1.4% for AGIs $10k-25k, 1.1% for AGIs $50k-75k, 9.3% for AGIs $75k-100k)
Profit/loss from business: +$5,279 (reported on 13.6% of returns)
Here:
+$5,279
State:
+$11,771
IRA payment deduction: $2,083 (reported on 2.7% of returns)
61771:
$2,083
Illinois:
$3,087
Total itemized deductions: $16,974 (22% of AGI, reported on 26.1% of returns)
Here:
$16,974
State:
$20,239
Here:
22.3% of AGI
State:
19.5% of AGI
(% of AGI for various income ranges: 22.4% for AGIs $10k-25k, 10.2% for AGIs $25k-50k, 8.1% for AGIs $50k-75k, 11.5% for AGIs $75k-100k, 9.6% for AGIs over 100k)
Charity contributions deductions: $3,151 (4% of AGI, reported on 20.8% of returns)
Here:
$3,151
State:
$3,719
Here:
3.8% of AGI
State:
3.4% of AGI
(% of AGI for various income ranges: 1.7% for AGIs $25k-50k, 1.1% for AGIs $50k-75k, 2.6% for AGIs $75k-100k, 1.9% for AGIs over 100k)
Total tax: $5,925 (reported on 74.8% of returns)
61771:
$5,925
State:
$9,882
(% of AGI for various income ranges: 1.6% for AGIs below $10k, 5.1% for AGIs $10k-25k, 7.1% for AGIs $25k-50k, 7.5% for AGIs $50k-75k, 10.5% for AGIs $75k-100k, 18.4% for AGIs over 100k)
Earned income credit: $1,621 (reported on 12.9% of returns)
Here:
$1,621
State:
$1,788
Percentage of individuals using paid preparers for their 2004 taxes: 64.1%
Here:
64%
State:
61%
(% for various income ranges: 57.8% for AGIs below $10k, 69.4% for AGIs $10k-25k, 71.4% for AGIs $25k-50k, 58.7% for AGIs $50k-75k, 65.8% for AGIs $75k-100k, 56.7% for AGIs over 100k)
Household received Food Stamps/SNAP in the past 12 months: 11 Household did not receive Food Stamps/SNAP in the past 12 months: 298
Women who had a birth in the past 12 months: 8 (8 now married, 0 unmarried) Women who did not have a birth in the past 12 months: 197 (107 now married, 88 unmarried)
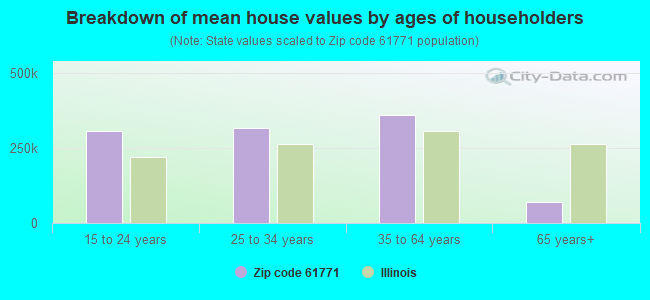
Housing units in zip code 61771 with a mortgage: 212 (8 second mortgage, 4 both second mortgage and home equity loan) Median monthly owner costs for units with a mortgage: $1,928 Median monthly owner costs for units without a mortgage: $645
Residents with income below the poverty level in 2022:
This zip code:
2.5%
Whole state:
11.9%
Residents with income below 50% of the poverty level in 2022:
This zip code:
2.2%
Whole state:
5.7%
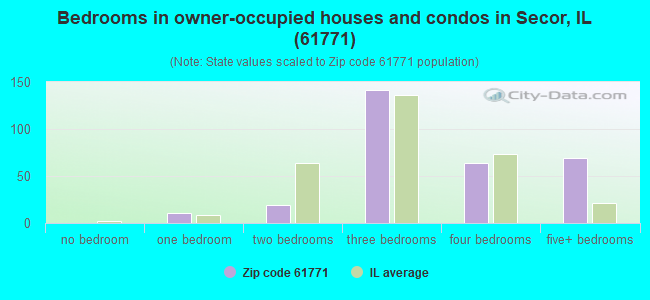
Median number of rooms in houses and condos:
Here:
7.8
State:
6.4
Median number of rooms in apartments:
Here:
4.7
State:
4.1
Notable locations in this zip code not listed on our city pages
Churches in zip code 61771 include: Saint Johns Lutheran Church (A), Secor Church of Christ (B), Secor United Methodist Church (C). Display/hide their locations on the map
Size of family households: 105 2-persons, 46 3-persons, 63 4-persons, 15 5-persons, 28 6-persons, 5 7-or-more-persons
Size of nonfamily households: 42 1-person, 4 2-persons
329 married couples with children.
2 single-parent households (2 men).
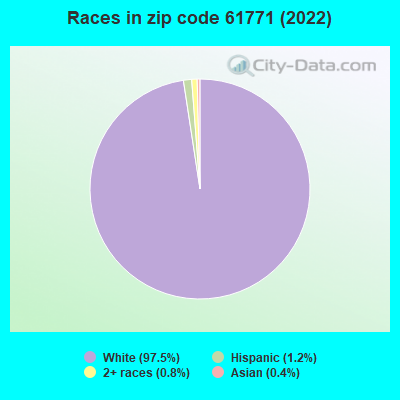
97.2% of residents of 61771 zip code speak English at home.
0.8% of residents speak Spanish at home (43% very well, 57% well).
1.1% of residents speak other Indo-European language at home (10% very well, 90% well).
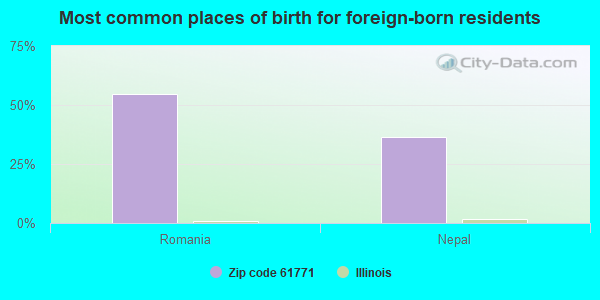
Foreign born population: 11 (1.1%) (81.9% of them are naturalized citizens)
This zip code:
1.1%
Whole state:
14.4%
55%Romania
36%Nepal
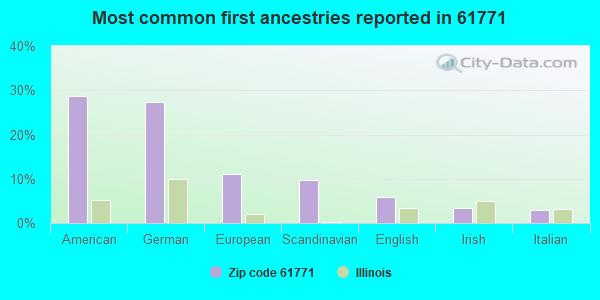
29%American
27%German
11%European
10%Scandinavian
6%English
3%Irish
3%Italian
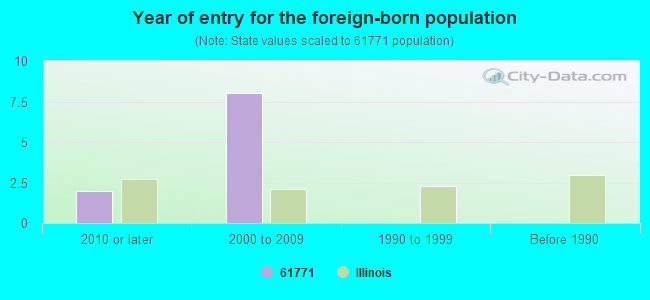
Year of entry for the foreign-born population
22010 or later
82000 to 2009
01990 to 1999
0Before 1990
Facilities with environmental interests located in this zip code:
AMIGONI CONSTRUCTION-SECOR (R. R. #1 in SECOR, IL)
STATE MASTER (Illinois EPA Project) - National Pollutant Discharge Elimination System Permit National Pollutant Discharge Elimination System NON-MAJOR (Tracking pollutant discharge elimination systems) - permit Business SIC classification: CONSTRUCTION SAND AND GRAVEL
GRAINLAND COOPERATIVE (BOX 79 in SECOR, IL)
AIR MINOR (AIRS/AFS) CRITERIA AND HAZARDOUS AIR POLLUTANT INVENTORY (Inventory of air pollution sources) Business SIC classification: GRAIN AND FIELD BEANS Alternative names: SECOR ELEVATOR CO
ILDOT BRG 102 0008 (US 24 OVER PANTHER CREEK in SECOR, IL)
HAZARDOUS WASTE BIENNIAL REPORTER (Resource Conservation and Recovery Act (tracking hazardous waste)) Small Quantity Generators, between 100 kg and 1000 kg of hazardous waste/month (Resource Conservation and Recovery Act (tracking hazardous waste)) - notification
Housing units lacking complete plumbing facilities: 6.7% Housing units lacking complete kitchen facilities: 8.1%
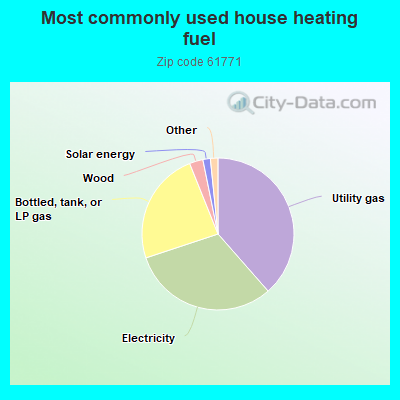
38.7%Utility gas
31.5%Electricity
24.1%Bottled, tank, or LP gas
2.9%Wood
1.6%Solar energy
1.0%Fuel oil, kerosene, etc.
0.7%No fuel used
Population in 1990: 952.
Place of birth for U.S.-born residents:
This state: 895
Northeast: 5
Midwest: 32
South: 14
West: 9
65% of the 61771 zip code residents lived in the same house 5 years ago. Out of people who lived in different houses, 58% lived in this county. Out of people who lived in different counties, 50% lived in Illinois.
97% of the 61771 zip code residents lived in the same house 1 year ago. Out of people who lived in different houses, 67% moved from this county. Out of people who lived in different houses, 6% moved from different county within same state. Out of people who lived in different houses, 22% moved from different state.
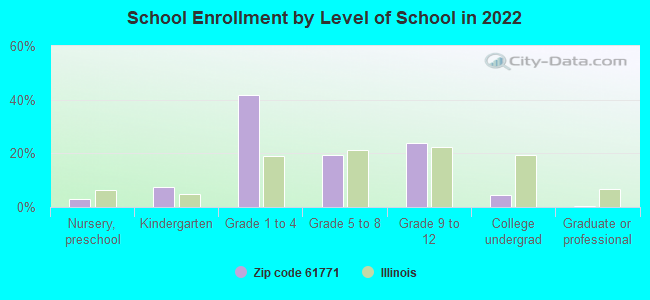
Private vs. public school enrollment:
Students in private schools in grades 1 to 8 (elementary and middle school): 12
Here:
6.2%
Illinois:
13.3%
Students in private schools in grades 9 to 12 (high school):
Here:
1.2%
Illinois:
9.9%
Students in private undergraduate colleges:
Here:
0.0%
Illinois:
27.4%
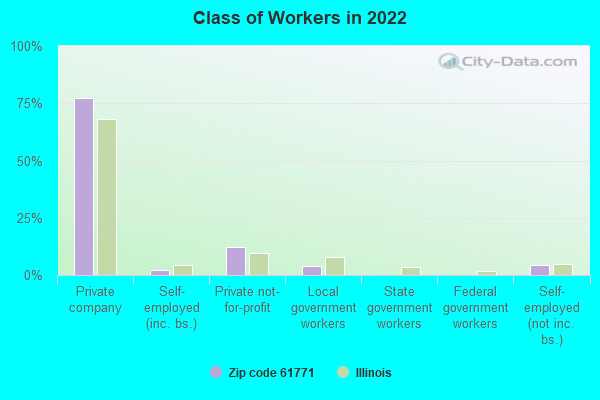
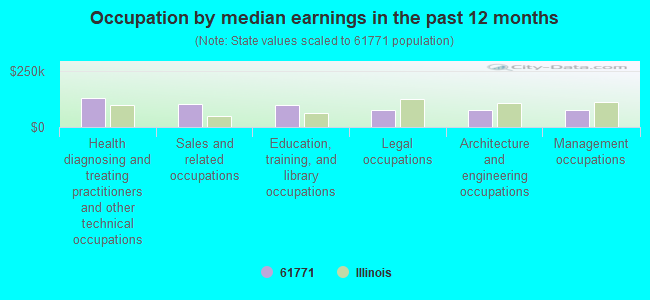
Occupation by median earnings in the past 12 months ($)
131,338Health diagnosing and treating practitioners and other technical occupations
101,801Sales and related occupations
96,502Education, training, and library occupations
77,509Legal occupations
75,722Architecture and engineering occupations
75,395Management occupations
Top industries in this zip code by the number of employees in 2005:
Arts, Entertainment, and Recreation: Golf Courses and Country Clubs (10-19 employees: 1 establishment)
Finance and Insurance: Direct Property and Casualty Insurance Carriers (1-4: 2)
Health Care and Social Assistance: Child Day Care Services (1-4: 1)
Administrative and Support and Waste Management and Remediation Services: Janitorial Services (1-4: 1)
Accommodation and Food Services: RV (Recreational Vehicle) Parks and Campgrounds (1-4: 1)
Accommodation and Food Services: Drinking Places (Alcoholic Beverages) (1-4: 1)
Construction: New Single-Family Housing Construction (except Operative Builders) (1-4: 1)
Other Services (except Public Administration): Religious Organizations (1-4: 1)
Wholesale Trade: Women's, Children's, and Infants' Clothing and Accessories Merchant Wholesalers (1-4: 1)
Fatal accident statistics in 2010:
Fatal accident count: 1
Vehicles involved in fatal accidents: 2
Fatal accidents caused by drunken drivers: 0
Fatalities: 1
Persons involved in fatal accidents: 3
Pedestrians involved in fatal accidents: 0
Home Mortgage Disclosure Act Aggregated Statistics For Year 2009 (Based on 2 partial tracts)
A) FHA, FSA/RHS & VA Home Purchase Loans
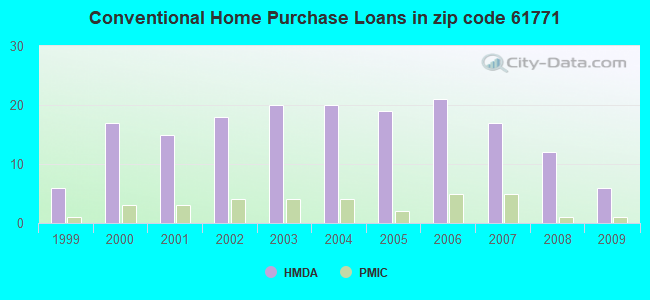
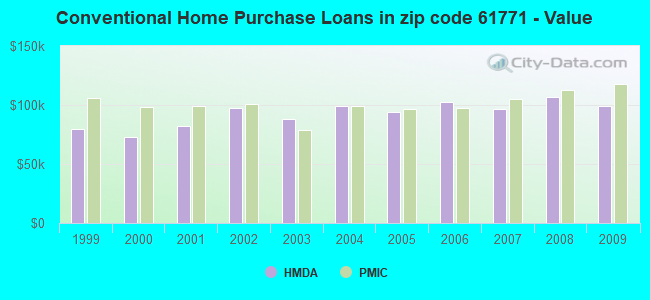
B) Conventional Home Purchase Loans
C) Refinancings
D) Home Improvement Loans
E) Loans on Dwellings For 5+ Families
F) Non-occupant Loans on < 5 Family Dwellings (A B C & D)
Number
Average Value
Number
Average Value
Number
Average Value
Number
Average Value
Number
Average Value
Number
Average Value
LOANS ORIGINATED
5
$111,132
6
$99,378
54
$125,629
3
$46,190
1
$86,440
2
$88,080
APPLICATIONS APPROVED, NOT ACCEPTED
0
$0
1
$68,330
3
$166,927
0
$0
0
$0
0
$0
APPLICATIONS DENIED
0
$0
1
$52,680
7
$133,829
2
$33,615
0
$0
1
$31,280
APPLICATIONS WITHDRAWN
0
$0
0
$0
5
$146,090
0
$0
0
$0
0
$0
FILES CLOSED FOR INCOMPLETENESS
0
$0
0
$0
1
$128,140
0
$0
0
$0
0
$0
Aggregated Statistics For Year 2008 (Based on 2 partial tracts)
A) FHA, FSA/RHS & VA Home Purchase Loans
B) Conventional Home Purchase Loans
C) Refinancings
D) Home Improvement Loans
F) Non-occupant Loans on < 5 Family Dwellings (A B C & D)
Number
Average Value
Number
Average Value
Number
Average Value
Number
Average Value
Number
Average Value
LOANS ORIGINATED
4
$107,565
12
$106,902
27
$118,815
7
$41,826
5
$56,636
APPLICATIONS APPROVED, NOT ACCEPTED
0
$0
0
$0
1
$202,780
1
$14,820
0
$0
APPLICATIONS DENIED
1
$98,510
2
$148,590
11
$112,155
4
$83,280
0
$0
APPLICATIONS WITHDRAWN
0
$0
2
$74,635
6
$135,965
1
$111,130
0
$0
FILES CLOSED FOR INCOMPLETENESS
0
$0
0
$0
1
$132,810
0
$0
0
$0
Aggregated Statistics For Year 2007 (Based on 2 partial tracts)
A) FHA, FSA/RHS & VA Home Purchase Loans
B) Conventional Home Purchase Loans
C) Refinancings
D) Home Improvement Loans
E) Loans on Dwellings For 5+ Families
F) Non-occupant Loans on < 5 Family Dwellings (A B C & D)
Number
Average Value
Number
Average Value
Number
Average Value
Number
Average Value
Number
Average Value
Number
Average Value
LOANS ORIGINATED
2
$97,550
17
$96,686
27
$117,484
7
$30,223
1
$186,320
4
$72,852
APPLICATIONS APPROVED, NOT ACCEPTED
0
$0
1
$127,600
2
$128,695
0
$0
0
$0
0
$0
APPLICATIONS DENIED
0
$0
5
$118,596
14
$107,643
4
$50,215
0
$0
1
$110,860
APPLICATIONS WITHDRAWN
0
$0
1
$128,140
5
$107,126
1
$44,730
0
$0
0
$0
FILES CLOSED FOR INCOMPLETENESS
0
$0
0
$0
1
$100,700
0
$0
0
$0
0
$0
Aggregated Statistics For Year 2006 (Based on 2 partial tracts)
A) FHA, FSA/RHS & VA Home Purchase Loans
B) Conventional Home Purchase Loans
C) Refinancings
D) Home Improvement Loans
F) Non-occupant Loans on < 5 Family Dwellings (A B C & D)
G) Loans On Manufactured Home Dwelling (A B C & D)
Number
Average Value
Number
Average Value
Number
Average Value
Number
Average Value
Number
Average Value
Number
Average Value
LOANS ORIGINATED
2
$105,370
21
$102,900
21
$103,018
7
$38,299
4
$93,640
1
$21,400
APPLICATIONS APPROVED, NOT ACCEPTED
0
$0
2
$117,855
5
$90,936
1
$17,840
0
$0
0
$0
APPLICATIONS DENIED
0
$0
2
$56,250
15
$103,156
7
$46,491
1
$73,810
0
$0
APPLICATIONS WITHDRAWN
0
$0
2
$65,170
14
$109,956
0
$0
1
$44,450
0
$0
FILES CLOSED FOR INCOMPLETENESS
0
$0
1
$32,380
2
$99,335
0
$0
0
$0
0
$0
Aggregated Statistics For Year 2005 (Based on 2 partial tracts)
A) FHA, FSA/RHS & VA Home Purchase Loans
B) Conventional Home Purchase Loans
C) Refinancings
D) Home Improvement Loans
E) Loans on Dwellings For 5+ Families
F) Non-occupant Loans on < 5 Family Dwellings (A B C & D)
Number
Average Value
Number
Average Value
Number
Average Value
Number
Average Value
Number
Average Value
Number
Average Value
LOANS ORIGINATED
2
$103,310
19
$94,221
25
$104,327
5
$29,360
1
$148,720
2
$58,310
APPLICATIONS APPROVED, NOT ACCEPTED
0
$0
1
$152,840
3
$105,460
0
$0
0
$0
0
$0
APPLICATIONS DENIED
0
$0
2
$113,875
18
$104,516
1
$61,740
0
$0
0
$0
APPLICATIONS WITHDRAWN
0
$0
1
$73,260
8
$117,924
1
$128,140
0
$0
0
$0
FILES CLOSED FOR INCOMPLETENESS
0
$0
1
$99,060
1
$89,730
0
$0
0
$0
0
$0
Aggregated Statistics For Year 2004 (Based on 2 partial tracts)
A) FHA, FSA/RHS & VA Home Purchase Loans
B) Conventional Home Purchase Loans
C) Refinancings
D) Home Improvement Loans
F) Non-occupant Loans on < 5 Family Dwellings (A B C & D)
Number
Average Value
Number
Average Value
Number
Average Value
Number
Average Value
Number
Average Value
LOANS ORIGINATED
1
$123,480
20
$99,031
27
$107,372
5
$47,746
2
$95,490
APPLICATIONS APPROVED, NOT ACCEPTED
0
$0
2
$74,910
2
$93,020
1
$6,590
0
$0
APPLICATIONS DENIED
0
$0
2
$57,350
19
$87,072
4
$43,218
0
$0
APPLICATIONS WITHDRAWN
0
$0
1
$46,920
7
$115,483
1
$22,780
0
$0
FILES CLOSED FOR INCOMPLETENESS
1
$75,190
1
$53,780
0
$0
0
$0
0
$0
Aggregated Statistics For Year 2003 (Based on 2 partial tracts)
A) FHA, FSA/RHS & VA Home Purchase Loans
B) Conventional Home Purchase Loans
C) Refinancings
D) Home Improvement Loans
F) Non-occupant Loans on < 5 Family Dwellings (A B C & D)
Number
Average Value
Number
Average Value
Number
Average Value
Number
Average Value
Number
Average Value
LOANS ORIGINATED
3
$92,200
20
$88,178
91
$94,683
4
$14,338
4
$94,875
APPLICATIONS APPROVED, NOT ACCEPTED
0
$0
0
$0
4
$120,805
1
$22,500
0
$0
APPLICATIONS DENIED
0
$0
4
$87,808
18
$89,912
2
$26,755
1
$73,810
APPLICATIONS WITHDRAWN
0
$0
1
$49,670
11
$137,799
0
$0
0
$0
FILES CLOSED FOR INCOMPLETENESS
0
$0
0
$0
1
$115,520
0
$0
0
$0
Aggregated Statistics For Year 2002 (Based on 2 partial tracts)
A) FHA, FSA/RHS & VA Home Purchase Loans
B) Conventional Home Purchase Loans
C) Refinancings
D) Home Improvement Loans
F) Non-occupant Loans on < 5 Family Dwellings (A B C & D)
Number
Average Value
Number
Average Value
Number
Average Value
Number
Average Value
Number
Average Value
LOANS ORIGINATED
3
$103,723
18
$97,732
63
$88,940
5
$21,294
2
$62,840
APPLICATIONS APPROVED, NOT ACCEPTED
0
$0
1
$72,170
2
$140,495
1
$12,350
0
$0
APPLICATIONS DENIED
0
$0
2
$110,445
17
$90,504
2
$19,620
1
$45,000
APPLICATIONS WITHDRAWN
0
$0
1
$47,470
9
$99,881
0
$0
0
$0
FILES CLOSED FOR INCOMPLETENESS
0
$0
0
$0
1
$37,590
0
$0
0
$0
Aggregated Statistics For Year 2001 (Based on 2 partial tracts)
A) FHA, FSA/RHS & VA Home Purchase Loans
B) Conventional Home Purchase Loans
C) Refinancings
D) Home Improvement Loans
F) Non-occupant Loans on < 5 Family Dwellings (A B C & D)
Number
Average Value
Number
Average Value
Number
Average Value
Number
Average Value
Number
Average Value
LOANS ORIGINATED
2
$107,840
15
$82,576
53
$87,088
8
$14,920
3
$59,363
APPLICATIONS APPROVED, NOT ACCEPTED
0
$0
1
$101,530
3
$63,113
2
$23,460
0
$0
APPLICATIONS DENIED
1
$93,300
2
$96,725
13
$70,943
3
$13,537
0
$0
APPLICATIONS WITHDRAWN
0
$0
1
$23,600
7
$70,796
1
$34,300
0
$0
FILES CLOSED FOR INCOMPLETENESS
0
$0
0
$0
1
$146,530
0
$0
0
$0
Aggregated Statistics For Year 2000 (Based on 2 partial tracts)
A) FHA, FSA/RHS & VA Home Purchase Loans
B) Conventional Home Purchase Loans
C) Refinancings
D) Home Improvement Loans
F) Non-occupant Loans on < 5 Family Dwellings (A B C & D)
Number
Average Value
Number
Average Value
Number
Average Value
Number
Average Value
Number
Average Value
LOANS ORIGINATED
1
$97,690
17
$73,168
13
$87,090
7
$13,877
3
$47,563
APPLICATIONS APPROVED, NOT ACCEPTED
0
$0
1
$36,220
2
$65,580
2
$27,715
0
$0
APPLICATIONS DENIED
0
$0
3
$61,007
8
$62,529
3
$24,697
0
$0
APPLICATIONS WITHDRAWN
0
$0
0
$0
4
$73,678
1
$13,450
0
$0
FILES CLOSED FOR INCOMPLETENESS
0
$0
0
$0
2
$44,040
0
$0
0
$0
Aggregated Statistics For Year 1999 (Based on 1 partial tract)
A) FHA, FSA/RHS & VA Home Purchase Loans
B) Conventional Home Purchase Loans
C) Refinancings
D) Home Improvement Loans
F) Non-occupant Loans on < 5 Family Dwellings (A B C & D)
Detailed PMIC statistics for the following Tracts:0307.00
2002 - 2018 National Fire Incident Reporting System (NFIRS) incidents
Based on the data from the years 2002 - 2018 the average number of fires per year is 9. The highest number of fires - 22 took place in 2014, and the least - 0 in 2003. The data has a rising trend.
When looking into fire subcategories, the most incidents belonged to: Outside Fires (57.3%), and Structure Fires (28.7%).
Fire incident types reported to NFIRS in Zip Code 61771


 Nearest zip codes: 61725, 61738, 61729, 61561, 61530, 61742.


 Based on the data from the years 2002 - 2018 the average number of fires per year is 9. The highest number of fires - 22 took place in 2014, and the least - 0 in 2003. The data has a rising trend.
 When looking into fire subcategories, the most incidents belonged to: Outside Fires (57.3%), and Structure Fires (28.7%).