Estimated zip code population in 2022: 6,522 Zip code population in 2010: 6,713 Zip code population in 2000: 6,181
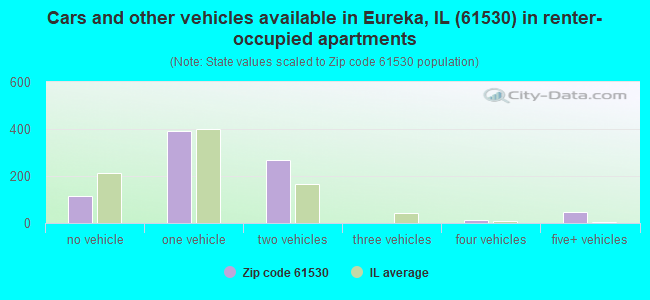
Houses and condos: 2,827 Renter-occupied apartments: 851
% of renters here:
31%
State:
33%
March 2022 cost of living index in zip code 61530: 83.3 (low, U.S. average is 100)
Land area: 62.3 sq. mi. Water area: 0.1 sq. mi.
Population density: 105 people per square mile
(very low).
OSM Map
General Map
Google Map
MSN Map
OSM Map
General Map
Google Map
MSN Map
OSM Map
General Map
Google Map
MSN Map
OSM Map
General Map
Google Map
MSN Map
Please wait while loading the map...
Real estate property taxes paid for housing units in 2022:
This zip code:
2.0% ($3,385)
Illinois:
2.0% ($4,912)
Median real estate property taxes paid for housing units with mortgages in 2022: $3,911 (1.9%) Median real estate property taxes paid for housing units with no mortgage in 2022: $3,069 (2.2%)
Business Search- 14 Million verified businesses
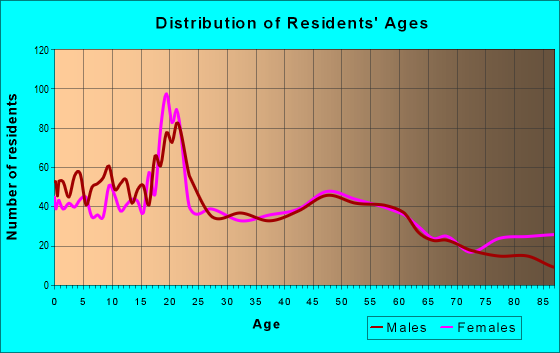
Males: 3,065
(47.0%)
Females: 3,457
(53.0%)
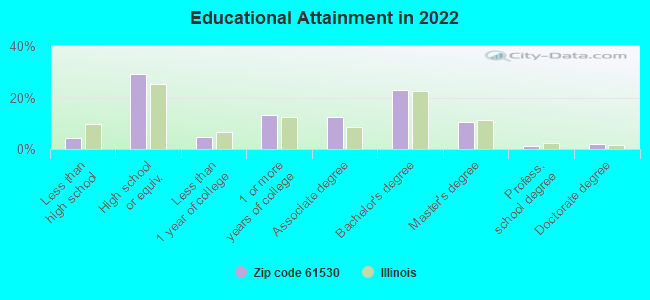
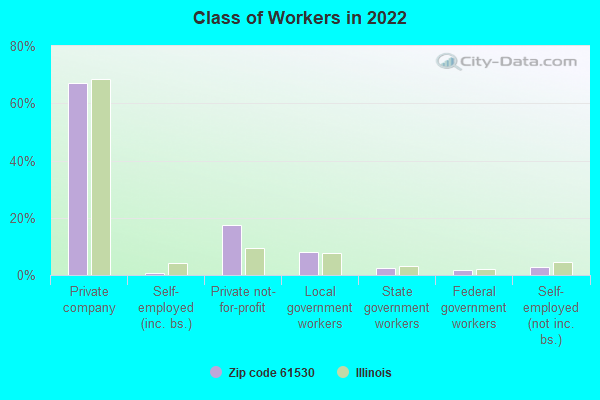
For population 25 years and over in 61530:
High school or higher: 95.5%
Bachelor's degree or higher: 36.2%
Graduate or professional degree: 13.4%
Unemployed: 5.3%
Mean travel time to work (commute): 24.6 minutes
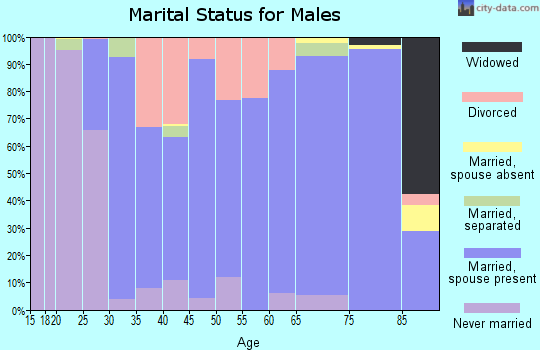
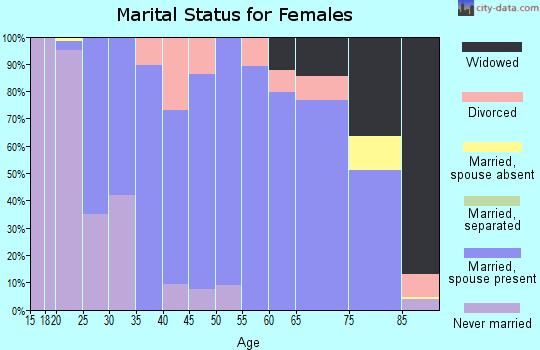
For population 15 years and over in 61530:
Never married: 22.6%
Now married: 57.2%
Separated: 0.0%
Widowed: 9.9%
Divorced: 10.3%
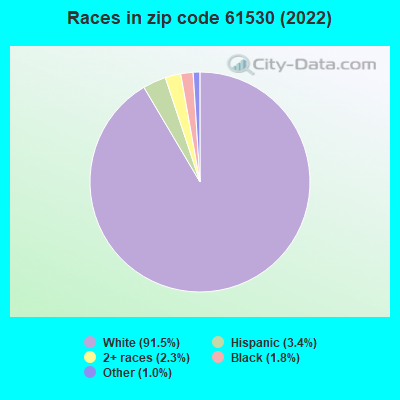
Zip code 61530 compared to state average:
Black race population percentage significantly below state average.
Hispanic race population percentage significantly below state average.
Foreign-born population percentage significantly below state average.
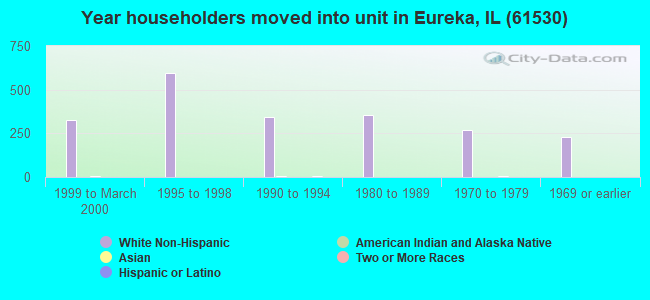
Length of stay since moving in above state average.
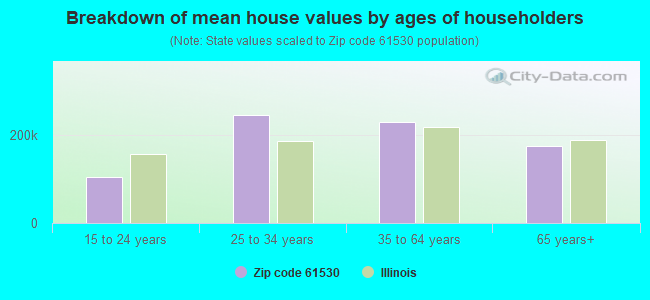
Estimated median house/condo value in 2022: $171,101
61530:
$171,101
Illinois:
$251,600
According to our research of Illinois and other state lists, there were 7 registered sex offenders living in 61530 zip code as of April 26, 2024. The ratio of all residents to sex offenders in zip code 61530 is 1,017 to 1. The ratio of registered sex offenders to all residents in this zip code is lower than the state average.
Median resident age:
This zip code:
39.5 years
Illinois median age:
39.1 years
Average household size:
This zip code:
2.1 people
Illinois:
2.4 people
Averages for the 2020 tax year for zip code 61530, filed in 2021:
Average Adjusted Gross Income (AGI) in 2020: $81,374 (Individual Income Tax Returns)
Here:
$81,374
State:
$82,626
Salary/wage: $59,420 (reported on 80.4% of returns)
Here:
$59,420
State:
$66,640
(% of AGI for various income ranges: 1262.5% for AGIs below $25k, 3496.9% for AGIs $25k-50k, 6574.6% for AGIs $50k-75k, 8950.4% for AGIs $75k-100k, 17140.0% for AGIs $100k-200k, 75633.3% for AGIs over 200k)
Taxable interest for individuals: $1,309 (reported on 56.1% of returns)
This zip code:
$1,309
Illinois:
$2,376
(% of AGI for various income ranges: 25.6% for AGIs below $25k, 42.9% for AGIs $25k-50k, 105.0% for AGIs $50k-75k, 69.6% for AGIs $75k-100k, 192.6% for AGIs $100k-200k, 2433.3% for AGIs over 200k)
Ordinary dividends: $5,056 (reported on 27.7% of returns)
Here:
$5,056
State:
$9,061
(% of AGI for various income ranges: 30.0% for AGIs below $25k, 83.1% for AGIs $25k-50k, 142.5% for AGIs $50k-75k, 136.1% for AGIs $75k-100k, 361.6% for AGIs $100k-200k, 5520.0% for AGIs over 200k)
Net capital gain/loss in AGI: +$14,058 (reported on 24.9% of returns)
Here:
+$14,058
State:
+$31,684
(% of AGI for various income ranges: 4.6% for AGIs below $25k, 59.3% for AGIs $25k-50k, 105.4% for AGIs $50k-75k, 132.2% for AGIs $75k-100k, 764.8% for AGIs $100k-200k, 22460.0% for AGIs over 200k)
Profit/loss from business: +$11,313 (reported on 16.1% of returns)
Here:
+$11,313
State:
+$12,175
(% of AGI for various income ranges: 56.2% for AGIs below $25k, 129.3% for AGIs $25k-50k, 163.9% for AGIs $50k-75k, 202.6% for AGIs $75k-100k, 591.9% for AGIs $100k-200k, 5363.3% for AGIs over 200k)
Taxable individual retirement arrangement distribution: $16,981 (reported on 13.0% of returns)
61530:
$16,981
Illinois:
$21,613
(% of AGI for various income ranges: 56.9% for AGIs below $25k, 108.3% for AGIs $25k-50k, 293.6% for AGIs $50k-75k, 332.2% for AGIs $75k-100k, 759.4% for AGIs $100k-200k, 5306.7% for AGIs over 200k)
Total itemized deductions: $42,700 (reported on 7.7% of returns)
Here:
$42,700
State:
$34,948
(% of AGI for various income ranges: 171.9% for AGIs below $25k, 332.9% for AGIs $50k-75k, 236.1% for AGIs $75k-100k, 808.4% for AGIs $100k-200k, 15063.3% for AGIs over 200k)
Charity contributions: $24,563 (reported on 6.7% of returns)
Here:
$24,563
State:
$13,122
(% of AGI for various income ranges: 125.7% for AGIs $50k-75k, 314.8% for AGIs $100k-200k, 11130.0% for AGIs over 200k)
Taxes paid: $7,759 (reported on 7.7% of returns)
61530:
$7,759
State:
$8,563
(% of AGI for various income ranges: 16.3% for AGIs below $25k, 70.4% for AGIs $50k-75k, 71.3% for AGIs $75k-100k, 216.5% for AGIs $100k-200k, 1966.7% for AGIs over 200k)
Earned income credit: $2,114 (reported on 9.8% of returns)
Here:
$2,114
State:
$2,311
(% of AGI for various income ranges: 70.4% for AGIs below $25k, 53.8% for AGIs $25k-50k)
Percentage of individuals using paid preparers for their 2020 taxes: 93.0%
Here:
93%
State:
93%
(% for various income ranges: 92.3% for AGIs below $25k, 92.9% for AGIs $25k-50k, 93.0% for AGIs $50k-75k, 94.1% for AGIs $75k-100k, 93.2% for AGIs $100k-200k, 93.3% for AGIs over 200k)
Averages for the 2012 tax year for zip code 61530, filed in 2013:
Average Adjusted Gross Income (AGI) in 2012: $61,951 (Individual Income Tax Returns)
Here:
$61,951
State:
$68,058
Salary/wage: $47,576 (reported on 83.2% of returns)
Here:
$47,576
State:
$55,396
(% of AGI for various income ranges: 71.9% for AGIs below $25k, 77.7% for AGIs $25k-50k, 74.6% for AGIs $50k-75k, 69.3% for AGIs $75k-100k, 65.1% for AGIs $100k-200k, 36.6% for AGIs over 200k)
Taxable interest for individuals: $1,568 (reported on 52.5% of returns)
This zip code:
$1,568
Illinois:
$1,969
(% of AGI for various income ranges: 2.1% for AGIs below $25k, 1.0% for AGIs $25k-50k, 0.9% for AGIs $50k-75k, 0.7% for AGIs $75k-100k, 0.9% for AGIs $100k-200k, 3.0% for AGIs over 200k)
Ordinary dividends: $3,626 (reported on 28.6% of returns)
Here:
$3,626
State:
$7,786
(% of AGI for various income ranges: 2.1% for AGIs below $25k, 1.4% for AGIs $25k-50k, 1.2% for AGIs $50k-75k, 1.1% for AGIs $75k-100k, 1.8% for AGIs $100k-200k, 2.5% for AGIs over 200k)
Net capital gain/loss in AGI: +$4,661 (reported on 21.5% of returns)
Here:
+$4,661
State:
+$22,183
(% of AGI for various income ranges: 0.4% for AGIs below $25k, 0.3% for AGIs $25k-50k, 0.6% for AGIs $50k-75k, 1.1% for AGIs $75k-100k, 1.3% for AGIs $100k-200k, 4.8% for AGIs over 200k)
Profit/loss from business: +$8,021 (reported on 14.5% of returns)
Here:
+$8,021
State:
+$12,903
(% of AGI for various income ranges: 2.9% for AGIs below $25k, 1.2% for AGIs $25k-50k, 2.3% for AGIs $50k-75k, 1.9% for AGIs $75k-100k, 2.6% for AGIs $100k-200k, 0.5% for AGIs over 200k)
Taxable individual retirement arrangement distribution: $12,244 (reported on 13.1% of returns)
61530:
$12,244
Illinois:
$17,929
(% of AGI for various income ranges: 3.7% for AGIs below $25k, 2.2% for AGIs $25k-50k, 2.6% for AGIs $50k-75k, 1.9% for AGIs $75k-100k, 4.5% for AGIs $100k-200k)
Total itemized deductions: $22,159 (20% of AGI, reported on 34.0% of returns)
Here:
$22,159
State:
$26,433
Here:
20.1% of AGI
State:
19.2% of AGI
(% of AGI for various income ranges: 15.2% for AGIs below $25k, 9.4% for AGIs $25k-50k, 11.0% for AGIs $50k-75k, 12.2% for AGIs $75k-100k, 13.5% for AGIs $100k-200k, 11.7% for AGIs over 200k)
Charity contributions: $6,758 (reported on 28.3% of returns)
Here:
$6,758
State:
$4,525
(% of AGI for various income ranges: 1.3% for AGIs below $25k, 1.2% for AGIs $25k-50k, 2.1% for AGIs $50k-75k, 2.4% for AGIs $75k-100k, 3.7% for AGIs $100k-200k, 5.3% for AGIs over 200k)
Taxes paid: $7,938 (reported on 34.0% of returns)
61530:
$7,938
State:
$11,968
(% of AGI for various income ranges: 1.6% for AGIs below $25k, 2.4% for AGIs $25k-50k, 3.3% for AGIs $50k-75k, 4.3% for AGIs $75k-100k, 5.8% for AGIs $100k-200k, 5.2% for AGIs over 200k)
Earned income credit: $2,074 (reported on 11.4% of returns)
Here:
$2,074
State:
$2,349
(% of AGI for various income ranges: 4.5% for AGIs below $25k, 0.9% for AGIs $25k-50k)
Percentage of individuals using paid preparers for their 2012 taxes: 53.2%
Here:
53%
State:
57%
(% for various income ranges: 45.1% for AGIs below $25k, 50.8% for AGIs $25k-50k, 58.3% for AGIs $50k-75k, 61.1% for AGIs $75k-100k, 58.1% for AGIs $100k-200k, 77.8% for AGIs over 200k)
Averages for the 2004 tax year for zip code 61530, filed in 2005:
Average Adjusted Gross Income (AGI) in 2004: $45,082 (Individual Income Tax Returns)
Here:
$45,082
State:
$54,625
Salary/wage: $37,793 (reported on 81.4% of returns)
Here:
$37,793
State:
$46,811
(% of AGI for various income ranges: 92.7% for AGIs below $10k, 62.1% for AGIs $10k-25k, 72.7% for AGIs $25k-50k, 74.9% for AGIs $50k-75k, 79.3% for AGIs $75k-100k, 52.3% for AGIs over 100k)
Taxable interest for individuals: $2,520 (reported on 58.9% of returns)
This zip code:
$2,520
Illinois:
$2,101
(% of AGI for various income ranges: 7.8% for AGIs below $10k, 5.7% for AGIs $10k-25k, 3.0% for AGIs $25k-50k, 2.1% for AGIs $50k-75k, 1.6% for AGIs $75k-100k, 4.6% for AGIs over 100k)
Taxable dividends: $1,995 (reported on 32.1% of returns)
Here:
$1,995
State:
$4,306
(% of AGI for various income ranges: 3.3% for AGIs below $10k, 3.1% for AGIs $10k-25k, 1.1% for AGIs $25k-50k, 1.0% for AGIs $50k-75k, 0.9% for AGIs $75k-100k, 1.7% for AGIs over 100k)
Net capital gain/loss: +$5,053 (reported on 23.9% of returns)
Here:
+$5,053
State:
+$17,321
(% of AGI for various income ranges: -1.1% for AGIs below $10k, 0.3% for AGIs $10k-25k, 1.3% for AGIs $25k-50k, 1.2% for AGIs $50k-75k, 1.3% for AGIs $75k-100k, 6.6% for AGIs over 100k)
Profit/loss from business: +$8,669 (reported on 15.4% of returns)
Here:
+$8,669
State:
+$11,771
(% of AGI for various income ranges: -1.4% for AGIs below $10k, 3.6% for AGIs $10k-25k, 3.1% for AGIs $25k-50k, 3.3% for AGIs $50k-75k, 1.5% for AGIs $75k-100k, 3.6% for AGIs over 100k)
Profit/loss from farming: +$12,104 (reported on 5.1% of returns)
Here:
+$12,104
State:
+$2,327
(% of AGI for various income ranges: -7.0% for AGIs below $10k, 1.2% for AGIs $10k-25k, 2.0% for AGIs $25k-50k, 1.3% for AGIs $50k-75k, 0.6% for AGIs $75k-100k, 2.1% for AGIs over 100k)
IRA payment deduction: $2,866 (reported on 2.4% of returns)
61530:
$2,866
Illinois:
$3,087
Self-employed pension: $8,391 (reported on 0.8% of returns)
Here:
$8,391
Illinois:
$16,965
Total itemized deductions: $17,484 (23% of AGI, reported on 30.8% of returns)
Here:
$17,484
State:
$20,239
Here:
23.1% of AGI
State:
19.5% of AGI
(% of AGI for various income ranges: 17.2% for AGIs below $10k, 15.0% for AGIs $10k-25k, 11.0% for AGIs $25k-50k, 11.9% for AGIs $50k-75k, 10.8% for AGIs $75k-100k, 12.2% for AGIs over 100k)
Charity contributions deductions: $5,087 (6% of AGI, reported on 26.3% of returns)
Here:
$5,087
State:
$3,719
Here:
6.3% of AGI
State:
3.4% of AGI
(% of AGI for various income ranges: 1.4% for AGIs below $10k, 2.0% for AGIs $10k-25k, 2.0% for AGIs $25k-50k, 2.2% for AGIs $50k-75k, 2.4% for AGIs $75k-100k, 5.0% for AGIs over 100k)
Total tax: $6,202 (reported on 77.5% of returns)
61530:
$6,202
State:
$9,882
(% of AGI for various income ranges: 2.3% for AGIs below $10k, 4.4% for AGIs $10k-25k, 7.1% for AGIs $25k-50k, 8.1% for AGIs $50k-75k, 10.3% for AGIs $75k-100k, 17.7% for AGIs over 100k)
Earned income credit: $1,633 (reported on 8.6% of returns)
Here:
$1,633
State:
$1,788
Percentage of individuals using paid preparers for their 2004 taxes: 57.9%
Here:
58%
State:
61%
(% for various income ranges: 46.2% for AGIs below $10k, 62.9% for AGIs $10k-25k, 62.6% for AGIs $25k-50k, 56.9% for AGIs $50k-75k, 54.0% for AGIs $75k-100k, 71.5% for AGIs over 100k)
Likely homosexual households (counted as self-reported same-sex unmarried-partner households)
Lesbian couples: 0.6% of all households
Gay men: 0.0% of all households
Household received Food Stamps/SNAP in the past 12 months: 457 Household did not receive Food Stamps/SNAP in the past 12 months: 2,326
Women who had a birth in the past 12 months: 75 (74 now married, 0 unmarried) Women who did not have a birth in the past 12 months: 1,249 (695 now married, 546 unmarried)
Housing units in zip code 61530 with a mortgage: 977 (93 second mortgage, 75 both second mortgage and home equity loan) Median monthly owner costs for units with a mortgage: $1,301 Median monthly owner costs for units without a mortgage: $588
Residents with income below the poverty level in 2022:
This zip code:
10.7%
Whole state:
11.9%
Residents with income below 50% of the poverty level in 2022:
This zip code:
7.5%
Whole state:
5.7%
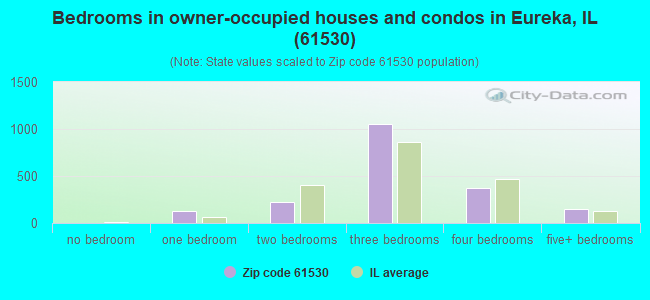
Median number of rooms in houses and condos:
Here:
7.0
State:
6.4
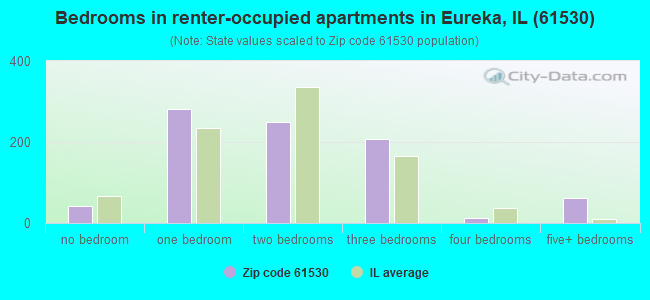
Median number of rooms in apartments:
Here:
4.4
State:
4.1
Notable locations in this zip code not listed on our city pages
Notable locations in zip code 61530: Woodford County Courthouse (A), Eureka - Goodfield Fire Protection District Eureka Station (B). Display/hide their locations on the map
In group quarters: 579 (-1 institutionalized population)
Size of family households: 944 2-persons, 294 3-persons, 291 4-persons, 129 5-persons, 76 6-persons
Size of nonfamily households: 967 1-person, 57 2-persons, 14 4-persons
962 married couples with children.
202 single-parent households (30 men, 172 women).
98.1% of residents of 61530 zip code speak English at home.
0.9% of residents speak Spanish at home (58% very well, 16% well, 26% not well).
0.4% of residents speak other Indo-European language at home (100% very well).
0.1% of residents speak other language at home (100% very well).
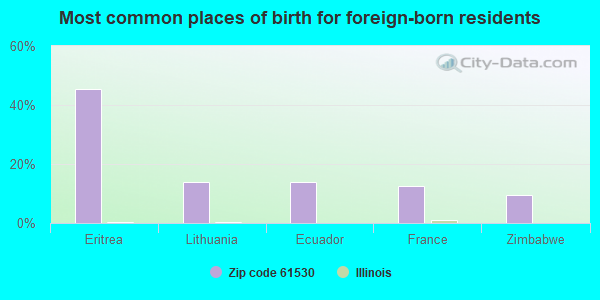
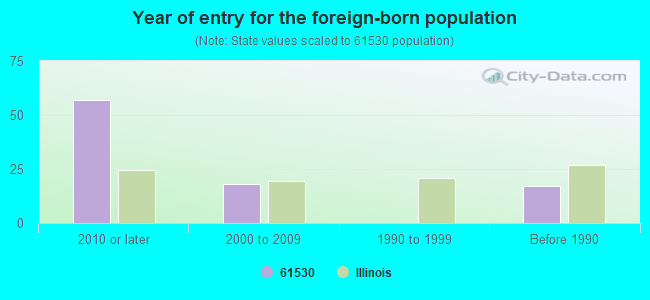
Foreign born population: 64 (1.0%) (67.4% of them are naturalized citizens)
This zip code:
1.0%
Whole state:
14.4%
45%Eritrea
14%Lithuania
14%Ecuador
12%France
9%Zimbabwe
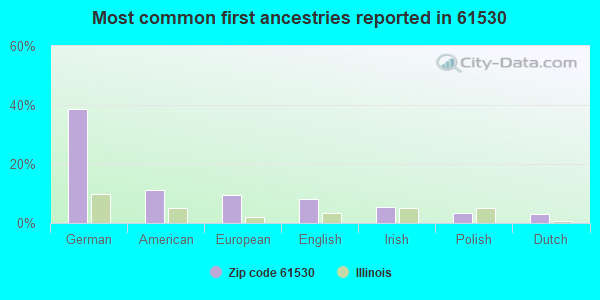
39%German
11%American
9%European
8%English
5%Irish
3%Polish
3%Dutch
Year of entry for the foreign-born population
572010 or later
182000 to 2009
01990 to 1999
17Before 1990
Major facilities with environmental interests located in this zip code:
A O SMITH - HARVESTORE PRODUCTS INC (RR #2 BOX 30 in EUREKA, IL)
STATE MASTER (Illinois EPA Project) - SOLID WASTE PROGRAM, AIR PROGRAM AIR MINOR (AIRS/AFS) CRITERIA AND HAZARDOUS AIR POLLUTANT INVENTORY (Inventory of air pollution sources) (Resource Conservation and Recovery Act (tracking hazardous waste)) Business SIC classification: PREFABRICATED METAL BUILDINGS AND COMPONENTS Organizations: A O SMITH CORPORATION (CONTACT/OWNER)
Alternative names: SMITH A O CORP HARVESTORE PRODUCTS INC
ROANOKE CONCRETE PRODUCTS CO (107 S MILL ST in EUREKA, IL)
STATE MASTER (Illinois EPA Project) - AIR PROGRAM AIR MINOR (AIRS/AFS) CRITERIA AND HAZARDOUS AIR POLLUTANT INVENTORY (Inventory of air pollution sources) National Pollutant Discharge Elimination System NON-MAJOR (Tracking pollutant discharge elimination systems) - permit Business SIC classification: READY-MIXED CONCRETE Business NAICS classification: READY-MIX CONCRETE MANUFACTURING. Organizations: ROANOKE CONCRETE PRODUCTS CO. (CONTACT/OWNER)
GRAINLAND COOPERATIVE (RURAL ROUTE 1 in EUREKA, IL)
STATE MASTER (Illinois EPA Project) - AIR PROGRAM AIR MINOR (AIRS/AFS) CRITERIA AND HAZARDOUS AIR POLLUTANT INVENTORY (Inventory of air pollution sources) Business SIC classification: GRAIN AND FIELD BEANS
J & J CLEANERS (RR 1, BOX 25 in EUREKA, IL)
STATE MASTER (Illinois EPA Project) - AIR PROGRAM AIR MINOR (AIRS/AFS) CRITERIA AND HAZARDOUS AIR POLLUTANT INVENTORY (Inventory of air pollution sources) Business SIC classification: DRYCLEANING PLANTS, EXCEPT RUG CLEANING Business NAICS classification: DRYCLEANING AND LAUNDRY SERVICES (EXCEPT COIN-OPERATED).
LEMAN PRECAST CONCRETE INC (RT. 24 W. - ON RT 24, 2 MI. W. in EUREKA, IL)
STATE MASTER (Illinois EPA Project) - National Pollutant Discharge Elimination System Permit National Pollutant Discharge Elimination System NON-MAJOR (Tracking pollutant discharge elimination systems) - permit Organizations: LEMAN PRECAST CONCRETE, INC. (CONTACT/OWNER)
HUBERS CUSTOM WOODWORKING (301 N MAIN ST in EUREKA, IL)
STATE MASTER (Illinois EPA Project) - HAZARDOUS WASTE PROGRAM Conditionally Exempt Small Quantity Generators, less than 100 kg/month of hazardous waste (Resource Conservation and Recovery Act (tracking hazardous waste)) Organizations: RANDY HUBER (CONTACT/OPERATOR)
J&J CLEANERS (RTE 117 S in EUREKA, IL)
STATE MASTER (Illinois EPA Project) - HAZARDOUS WASTE PROGRAM Conditionally Exempt Small Quantity Generators, less than 100 kg/month of hazardous waste (Resource Conservation and Recovery Act (tracking hazardous waste)) Organizations: MUSICK DENNIS AND MARY (CONTACT/OWNER)
MANGOLD FORD-MERCURY INC (1100 W CENTER in EUREKA, IL)
STATE MASTER (Illinois EPA Project) - SOLID WASTE PROGRAM, HAZARDOUS WASTE PROGRAM, SCRAP TIRE MANAGEMENT Conditionally Exempt Small Quantity Generators, less than 100 kg/month of hazardous waste (Resource Conservation and Recovery Act (tracking hazardous waste)) Organizations: MANGOLD C MICHAEL (CONTACT/OWNER)
METAL MEDIC AUTOBODY (411 E CENTER ST in EUREKA, IL)
STATE MASTER (Illinois EPA Project) - HAZARDOUS WASTE PROGRAM Small Quantity Generators, between 100 kg and 1000 kg of hazardous waste/month (Resource Conservation and Recovery Act (tracking hazardous waste)) - notification Organizations: KEN GARRISON (CONTACT/OWNER)
Alternative names: EUREKA BODY WORKS INC
PORK CHOP RIDGE (R R 1 in EUREKA, IL)
STATE MASTER (Illinois EPA Project) - National Pollutant Discharge Elimination System Permit National Pollutant Discharge Elimination System NON-MAJOR (Tracking pollutant discharge elimination systems) - permit Business SIC classification: HOGS Alternative names: PORK CHOP RIDGE SWINE FARM
COLUMBUS MCKINNON CORP (801 W CENTER ST in EUREKA, IL)
STATE MASTER (Illinois EPA Project) - AIR PROGRAM AIR MINOR (AIRS/AFS) Business SIC classification: OVERHEAD TRAVELING CRANES, HOISTS, AND MONORAIL SYSTEMS
COX TRANSFER (602 W CENTER ST in EUREKA, IL)
STATE MASTER (Illinois EPA Project) - SOLID WASTE PROGRAM, HAZARDOUS WASTE PROGRAM Conditionally Exempt Small Quantity Generators, less than 100 kg/month of hazardous waste (Resource Conservation and Recovery Act (tracking hazardous waste)) Organizations: COX TRANSFER INC (CONTACT/OWNER)
DAVENPORT ELEM SCHOOL (301 S MAIN ST in EUREKA, IL)
(National Center for Education Statistics) - STATE ID-4310214002003 Organizations: EUREKA C U DIST 140 (SCHOOL DISTRICT)
Housing units lacking complete plumbing facilities: 0.9%
71.7%Utility gas
17.5%Electricity
5.5%Bottled, tank, or LP gas
3.4%No fuel used
0.9%Other fuel
0.5%Coal or coke
Population in 1990: 5,688. Population change in the 1990s: +493 (+8.7%).
Place of birth for U.S.-born residents:
This state: 5,234
Northeast: 49
Midwest: 764
South: 232
West: 135
57% of the 61530 zip code residents lived in the same house 5 years ago. Out of people who lived in different houses, 50% lived in this county. Out of people who lived in different counties, 50% lived in Illinois.
90% of the 61530 zip code residents lived in the same house 1 year ago. Out of people who lived in different houses, 53% moved from this county. Out of people who lived in different houses, 37% moved from different county within same state. Out of people who lived in different houses, 9% moved from different state.
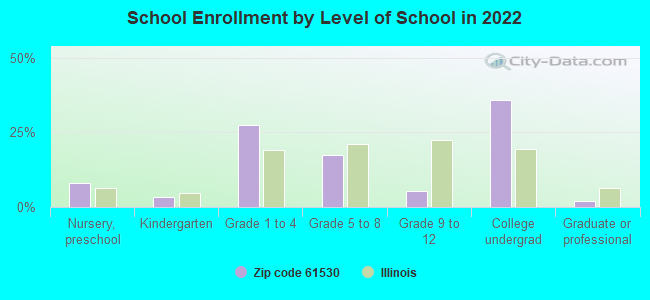
Private vs. public school enrollment:
Students in private schools in grades 1 to 8 (elementary and middle school): 22
Here:
3.4%
Illinois:
13.3%
Students in private schools in grades 9 to 12 (high school):
Here:
0.0%
Illinois:
9.9%
Students in private undergraduate colleges: 329
Here:
61.1%
Illinois:
27.4%
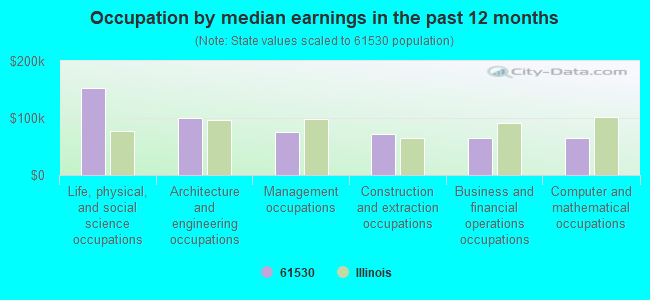
Occupation by median earnings in the past 12 months ($)
152,170Life, physical, and social science occupations
100,644Architecture and engineering occupations
75,664Management occupations
71,962Construction and extraction occupations
65,248Business and financial operations occupations
64,962Computer and mathematical occupations
Companies with federal contracts located in this zip code:
WASHINGTON EQUIPMENT DIVISION (801 W CENTER ST in EUREKA, IL; small business) : $38,513 in 2 contractsfrom 2004 to 2005
$32,585 with Navy for Maintenance, Repair or Alteration of Real Property -- Other Non-Building Facilities. Taking place in VA. Signed on 2005-02-17. Completion date: 2005-02-15.
$5,928, same as above.Signed on 2004-11-03. Completion date: 2005-02-15.
Top industries in this zip code by the number of employees in 2005:
Health Care and Social Assistance: Nursing Care Facilities (100-249 employees: 2 establishments)
Educational Services: Colleges, Universities, and Professional Schools (100-249: 1)
Health Care and Social Assistance: General Medical and Surgical Hospitals (100-249: 1)
Accommodation and Food Services: Full-Service Restaurants (20-49: 2, 10-19: 2)
Health Care and Social Assistance: Vocational Rehabilitation Services (50-99: 1)
People in group quarters in 2010:
370 people in college/university student housing
194 people in nursing facilities/skilled-nursing facilities
44 people in local jails and other municipal confinement facilities
8 people in group homes intended for adults
4 people in emergency and transitional shelters (with sleeping facilities) for people experiencing homelessness
People in group quarters in 2000:
377 people in college dormitories (includes college quarters off campus)
227 people in nursing homes
16 people in local jails and other confinement facilities (including police lockups)
4 people in homes for the mentally retarded
2 people in other noninstitutional group quarters
Fatal accident statistics in 2012:
Fatal accident count: 1
Vehicles involved in fatal accidents: 2
Fatal accidents caused by drunken drivers: 0
Fatalities: 1
Persons involved in fatal accidents: 3
Pedestrians involved in fatal accidents: 0
Fatal accident statistics in 2010:
Fatal accident count: 1
Vehicles involved in fatal accidents: 1
Fatal accidents caused by drunken drivers: 0
Fatalities: 1
Persons involved in fatal accidents: 1
Pedestrians involved in fatal accidents: 0
Home Mortgage Disclosure Act Aggregated Statistics For Year 2009 (Based on 6 partial tracts)
A) FHA, FSA/RHS & VA Home Purchase Loans
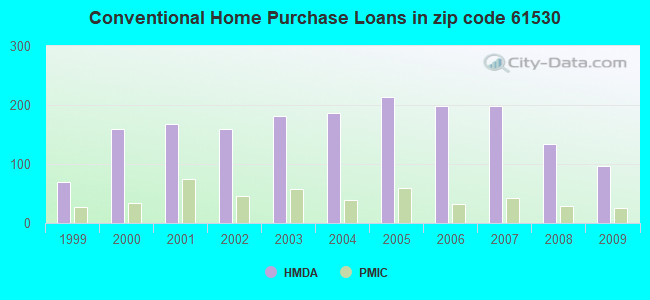
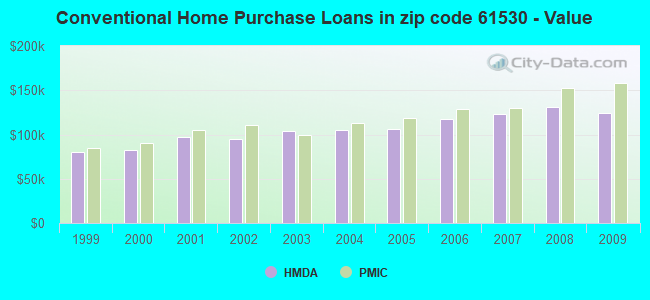
B) Conventional Home Purchase Loans
C) Refinancings
D) Home Improvement Loans
F) Non-occupant Loans on < 5 Family Dwellings (A B C & D)
Number
Average Value
Number
Average Value
Number
Average Value
Number
Average Value
Number
Average Value
LOANS ORIGINATED
38
$119,711
96
$124,671
548
$145,928
36
$52,761
35
$317,652
APPLICATIONS APPROVED, NOT ACCEPTED
1
$107,260
0
$0
15
$160,580
4
$67,665
0
$0
APPLICATIONS DENIED
10
$104,004
8
$86,580
45
$131,452
12
$46,032
2
$104,950
APPLICATIONS WITHDRAWN
0
$0
3
$157,067
33
$131,840
0
$0
0
$0
FILES CLOSED FOR INCOMPLETENESS
0
$0
0
$0
9
$130,278
0
$0
0
$0
Aggregated Statistics For Year 2008 (Based on 6 partial tracts)
A) FHA, FSA/RHS & VA Home Purchase Loans
B) Conventional Home Purchase Loans
C) Refinancings
D) Home Improvement Loans
E) Loans on Dwellings For 5+ Families
F) Non-occupant Loans on < 5 Family Dwellings (A B C & D)
G) Loans On Manufactured Home Dwelling (A B C & D)
Number
Average Value
Number
Average Value
Number
Average Value
Number
Average Value
Number
Average Value
Number
Average Value
Number
Average Value
LOANS ORIGINATED
45
$130,372
134
$131,111
220
$127,625
43
$45,650
2
$328,180
23
$98,250
2
$21,175
APPLICATIONS APPROVED, NOT ACCEPTED
0
$0
4
$80,092
14
$163,326
4
$12,598
0
$0
0
$0
2
$26,695
APPLICATIONS DENIED
3
$121,803
13
$98,372
53
$128,829
34
$79,153
0
$0
4
$33,540
2
$13,560
APPLICATIONS WITHDRAWN
2
$96,305
4
$110,240
31
$133,582
4
$75,115
0
$0
0
$0
0
$0
FILES CLOSED FOR INCOMPLETENESS
1
$62,490
2
$113,235
4
$75,520
0
$0
0
$0
0
$0
0
$0
Aggregated Statistics For Year 2007 (Based on 6 partial tracts)
A) FHA, FSA/RHS & VA Home Purchase Loans
B) Conventional Home Purchase Loans
C) Refinancings
D) Home Improvement Loans
E) Loans on Dwellings For 5+ Families
F) Non-occupant Loans on < 5 Family Dwellings (A B C & D)
G) Loans On Manufactured Home Dwelling (A B C & D)
Number
Average Value
Number
Average Value
Number
Average Value
Number
Average Value
Number
Average Value
Number
Average Value
Number
Average Value
LOANS ORIGINATED
20
$118,614
198
$123,698
195
$108,018
38
$48,333
2
$105,600
22
$108,447
4
$28,285
APPLICATIONS APPROVED, NOT ACCEPTED
2
$152,820
12
$103,497
26
$106,510
4
$26,772
0
$0
0
$0
2
$20,255
APPLICATIONS DENIED
0
$0
26
$92,503
99
$113,408
34
$60,606
0
$0
2
$224,755
4
$24,100
APPLICATIONS WITHDRAWN
0
$0
16
$108,194
25
$84,646
2
$138,390
0
$0
0
$0
0
$0
FILES CLOSED FOR INCOMPLETENESS
2
$100,345
3
$132,680
5
$163,626
0
$0
0
$0
0
$0
0
$0
Aggregated Statistics For Year 2006 (Based on 6 partial tracts)
A) FHA, FSA/RHS & VA Home Purchase Loans
B) Conventional Home Purchase Loans
C) Refinancings
D) Home Improvement Loans
E) Loans on Dwellings For 5+ Families
F) Non-occupant Loans on < 5 Family Dwellings (A B C & D)
G) Loans On Manufactured Home Dwelling (A B C & D)
Number
Average Value
Number
Average Value
Number
Average Value
Number
Average Value
Number
Average Value
Number
Average Value
Number
Average Value
LOANS ORIGINATED
22
$116,204
199
$117,582
158
$112,248
47
$26,496
2
$115,075
28
$132,482
1
$9,390
APPLICATIONS APPROVED, NOT ACCEPTED
2
$102,460
6
$118,975
36
$91,631
10
$28,999
0
$0
0
$0
0
$0
APPLICATIONS DENIED
6
$91,463
10
$128,177
85
$102,408
18
$58,374
0
$0
1
$260,420
0
$0
APPLICATIONS WITHDRAWN
0
$0
13
$97,879
54
$96,744
8
$62,205
0
$0
1
$134,640
0
$0
FILES CLOSED FOR INCOMPLETENESS
0
$0
8
$116,621
5
$116,016
0
$0
0
$0
0
$0
0
$0
Aggregated Statistics For Year 2005 (Based on 6 partial tracts)
A) FHA, FSA/RHS & VA Home Purchase Loans
B) Conventional Home Purchase Loans
C) Refinancings
D) Home Improvement Loans
F) Non-occupant Loans on < 5 Family Dwellings (A B C & D)
G) Loans On Manufactured Home Dwelling (A B C & D)
Number
Average Value
Number
Average Value
Number
Average Value
Number
Average Value
Number
Average Value
Number
Average Value
LOANS ORIGINATED
16
$117,259
214
$105,787
204
$97,977
46
$34,099
26
$62,399
3
$13,637
APPLICATIONS APPROVED, NOT ACCEPTED
4
$96,228
12
$134,027
37
$111,860
1
$19,140
0
$0
2
$10,125
APPLICATIONS DENIED
6
$82,240
34
$104,461
128
$105,044
29
$15,090
2
$24,520
3
$10,140
APPLICATIONS WITHDRAWN
0
$0
7
$101,149
74
$125,472
6
$170,533
0
$0
0
$0
FILES CLOSED FOR INCOMPLETENESS
0
$0
4
$37,805
10
$113,990
0
$0
0
$0
0
$0
Aggregated Statistics For Year 2004 (Based on 6 partial tracts)
A) FHA, FSA/RHS & VA Home Purchase Loans
B) Conventional Home Purchase Loans
C) Refinancings
D) Home Improvement Loans
E) Loans on Dwellings For 5+ Families
F) Non-occupant Loans on < 5 Family Dwellings (A B C & D)
G) Loans On Manufactured Home Dwelling (A B C & D)
Number
Average Value
Number
Average Value
Number
Average Value
Number
Average Value
Number
Average Value
Number
Average Value
Number
Average Value
LOANS ORIGINATED
12
$126,622
187
$105,101
267
$100,849
59
$29,507
2
$117,835
28
$91,063
2
$36,110
APPLICATIONS APPROVED, NOT ACCEPTED
0
$0
8
$97,278
22
$83,625
3
$17,370
0
$0
2
$51,555
2
$34,060
APPLICATIONS DENIED
0
$0
17
$87,756
70
$102,013
20
$40,628
0
$0
0
$0
2
$30,360
APPLICATIONS WITHDRAWN
2
$72,725
11
$116,965
60
$100,966
4
$43,228
0
$0
0
$0
0
$0
FILES CLOSED FOR INCOMPLETENESS
0
$0
2
$107,710
5
$85,192
0
$0
0
$0
2
$116,830
0
$0
Aggregated Statistics For Year 2003 (Based on 6 partial tracts)
A) FHA, FSA/RHS & VA Home Purchase Loans
B) Conventional Home Purchase Loans
C) Refinancings
D) Home Improvement Loans
E) Loans on Dwellings For 5+ Families
F) Non-occupant Loans on < 5 Family Dwellings (A B C & D)
Number
Average Value
Number
Average Value
Number
Average Value
Number
Average Value
Number
Average Value
Number
Average Value
LOANS ORIGINATED
16
$100,805
181
$104,210
673
$91,118
37
$15,167
2
$128,885
22
$63,473
APPLICATIONS APPROVED, NOT ACCEPTED
4
$83,775
10
$109,017
25
$93,925
7
$15,879
0
$0
4
$130,485
APPLICATIONS DENIED
0
$0
7
$121,824
81
$79,638
22
$17,915
0
$0
1
$67,320
APPLICATIONS WITHDRAWN
0
$0
6
$111,003
55
$114,085
0
$0
0
$0
0
$0
FILES CLOSED FOR INCOMPLETENESS
0
$0
0
$0
3
$97,500
0
$0
0
$0
0
$0
Aggregated Statistics For Year 2002 (Based on 6 partial tracts)
A) FHA, FSA/RHS & VA Home Purchase Loans
B) Conventional Home Purchase Loans
C) Refinancings
D) Home Improvement Loans
E) Loans on Dwellings For 5+ Families
F) Non-occupant Loans on < 5 Family Dwellings (A B C & D)
Number
Average Value
Number
Average Value
Number
Average Value
Number
Average Value
Number
Average Value
Number
Average Value
LOANS ORIGINATED
16
$94,154
159
$95,379
532
$88,978
86
$14,121
2
$225,310
31
$82,683
APPLICATIONS APPROVED, NOT ACCEPTED
2
$132,565
10
$79,238
24
$91,635
2
$3,735
0
$0
0
$0
APPLICATIONS DENIED
2
$115,995
11
$99,784
82
$77,757
6
$13,508
0
$0
3
$125,233
APPLICATIONS WITHDRAWN
7
$120,204
14
$94,994
40
$89,318
1
$2,950
0
$0
4
$64,442
FILES CLOSED FOR INCOMPLETENESS
0
$0
7
$65,494
4
$44,952
4
$16,110
0
$0
0
$0
Aggregated Statistics For Year 2001 (Based on 6 partial tracts)
A) FHA, FSA/RHS & VA Home Purchase Loans
B) Conventional Home Purchase Loans
C) Refinancings
D) Home Improvement Loans
F) Non-occupant Loans on < 5 Family Dwellings (A B C & D)
Number
Average Value
Number
Average Value
Number
Average Value
Number
Average Value
Number
Average Value
LOANS ORIGINATED
18
$79,943
168
$97,408
446
$87,121
62
$15,711
15
$68,822
APPLICATIONS APPROVED, NOT ACCEPTED
0
$0
3
$133,183
23
$59,005
15
$23,427
0
$0
APPLICATIONS DENIED
0
$0
31
$43,220
70
$68,155
12
$6,698
2
$27,440
APPLICATIONS WITHDRAWN
4
$114,615
5
$120,606
33
$65,907
2
$78,170
0
$0
FILES CLOSED FOR INCOMPLETENESS
0
$0
2
$49,185
10
$64,754
0
$0
0
$0
Aggregated Statistics For Year 2000 (Based on 6 partial tracts)
A) FHA, FSA/RHS & VA Home Purchase Loans
B) Conventional Home Purchase Loans
C) Refinancings
D) Home Improvement Loans
F) Non-occupant Loans on < 5 Family Dwellings (A B C & D)
Number
Average Value
Number
Average Value
Number
Average Value
Number
Average Value
Number
Average Value
LOANS ORIGINATED
7
$93,556
160
$82,705
122
$81,611
62
$23,049
14
$63,272
APPLICATIONS APPROVED, NOT ACCEPTED
4
$77,330
1
$70,020
19
$89,499
6
$17,560
0
$0
APPLICATIONS DENIED
0
$0
19
$76,562
44
$65,224
29
$24,976
4
$45,158
APPLICATIONS WITHDRAWN
2
$118,755
3
$89,717
27
$63,666
4
$26,545
0
$0
FILES CLOSED FOR INCOMPLETENESS
0
$0
0
$0
14
$58,946
0
$0
0
$0
Aggregated Statistics For Year 1999 (Based on 3 partial tracts)
A) FHA, FSA/RHS & VA Home Purchase Loans
B) Conventional Home Purchase Loans
C) Refinancings
D) Home Improvement Loans
F) Non-occupant Loans on < 5 Family Dwellings (A B C & D)
2002 - 2018 National Fire Incident Reporting System (NFIRS) incidents
According to the data from the years 2002 - 2018 the average number of fire incidents per year is 10. The highest number of fires - 20 took place in 2018, and the least - 1 in 2004. The data has an increasing trend.
When looking into fire subcategories, the most incidents belonged to: Structure Fires (43.3%), and Outside Fires (28.7%).
Fire incident types reported to NFIRS in Zip Code 61530
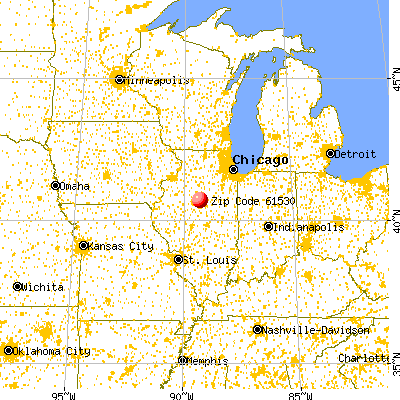


 Nearest zip codes: 61742, 61729, 61561, 61733, 61771, 61571.


 According to the data from the years 2002 - 2018 the average number of fire incidents per year is 10. The highest number of fires - 20 took place in 2018, and the least - 1 in 2004. The data has an increasing trend.
 When looking into fire subcategories, the most incidents belonged to: Structure Fires (43.3%), and Outside Fires (28.7%).