Eureka, Illinois Submit your own pictures of this city and show them to the world
OSM Map
General Map
Google Map
MSN Map
OSM Map
General Map
Google Map
MSN Map
OSM Map
General Map
Google Map
MSN Map
OSM Map
General Map
Google Map
MSN Map
Please wait while loading the map...
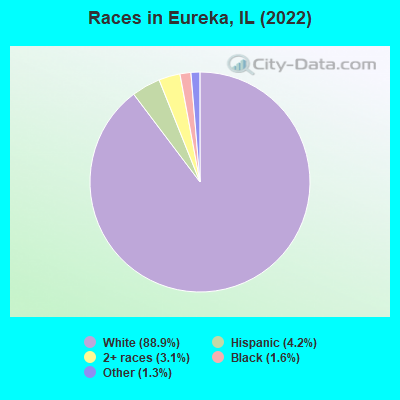
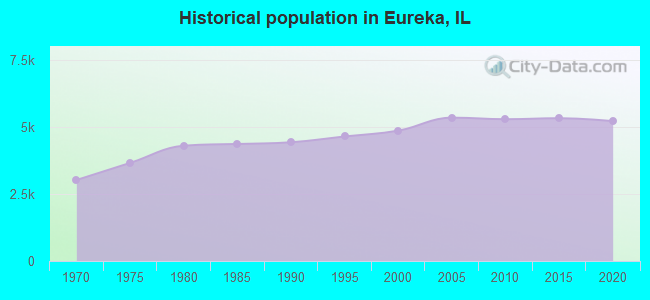
Population in 2022: 5,165 (99% urban, 1% rural). Population change since 2000: +6.0%Males: 2,371 Females: 2,794
March 2022 cost of living index in Eureka: 83.4 (less than average, U.S. average is 100) Percentage of residents living in poverty in 2022: 13.3%for White Non-Hispanic residents , 41.2% for Black residents , 17.6% for Hispanic or Latino residents , 8.1% for other race residents , 38.4% for two or more races residents )Business Search - 14 Million verified businesses
Data:
Median household income ($)
Median household income (% change since 2000)
Household income diversity
Ratio of average income to average house value (%)
Ratio of average income to average rent
Median household income ($) - White
Median household income ($) - Black or African American
Median household income ($) - Asian
Median household income ($) - Hispanic or Latino
Median household income ($) - American Indian and Alaska Native
Median household income ($) - Multirace
Median household income ($) - Other Race
Median household income for houses/condos with a mortgage ($)
Median household income for apartments without a mortgage ($)
Races - White alone (%)
Races - White alone (% change since 2000)
Races - Black alone (%)
Races - Black alone (% change since 2000)
Races - American Indian alone (%)
Races - American Indian alone (% change since 2000)
Races - Asian alone (%)
Races - Asian alone (% change since 2000)
Races - Hispanic (%)
Races - Hispanic (% change since 2000)
Races - Native Hawaiian and Other Pacific Islander alone (%)
Races - Native Hawaiian and Other Pacific Islander alone (% change since 2000)
Races - Two or more races (%)
Races - Two or more races (% change since 2000)
Races - Other race alone (%)
Races - Other race alone (% change since 2000)
Racial diversity
Unemployment (%)
Unemployment (% change since 2000)
Unemployment (%) - White
Unemployment (%) - Black or African American
Unemployment (%) - Asian
Unemployment (%) - Hispanic or Latino
Unemployment (%) - American Indian and Alaska Native
Unemployment (%) - Multirace
Unemployment (%) - Other Race
Population density (people per square mile)
Population - Males (%)
Population - Females (%)
Population - Males (%) - White
Population - Males (%) - Black or African American
Population - Males (%) - Asian
Population - Males (%) - Hispanic or Latino
Population - Males (%) - American Indian and Alaska Native
Population - Males (%) - Multirace
Population - Males (%) - Other Race
Population - Females (%) - White
Population - Females (%) - Black or African American
Population - Females (%) - Asian
Population - Females (%) - Hispanic or Latino
Population - Females (%) - American Indian and Alaska Native
Population - Females (%) - Multirace
Population - Females (%) - Other Race
Coronavirus confirmed cases (Apr 27, 2024)
Deaths caused by coronavirus (Apr 27, 2024)
Coronavirus confirmed cases (per 100k population) (Apr 27, 2024)
Deaths caused by coronavirus (per 100k population) (Apr 27, 2024)
Daily increase in number of cases (Apr 27, 2024)
Weekly increase in number of cases (Apr 27, 2024)
Cases doubled (in days) (Apr 27, 2024)
Hospitalized patients (Apr 18, 2022)
Negative test results (Apr 18, 2022)
Total test results (Apr 18, 2022)
COVID Vaccine doses distributed (per 100k population) (Sep 19, 2023)
COVID Vaccine doses administered (per 100k population) (Sep 19, 2023)
COVID Vaccine doses distributed (Sep 19, 2023)
COVID Vaccine doses administered (Sep 19, 2023)
Likely homosexual households (%)
Likely homosexual households (% change since 2000)
Likely homosexual households - Lesbian couples (%)
Likely homosexual households - Lesbian couples (% change since 2000)
Likely homosexual households - Gay men (%)
Likely homosexual households - Gay men (% change since 2000)
Cost of living index
Median gross rent ($)
Median contract rent ($)
Median monthly housing costs ($)
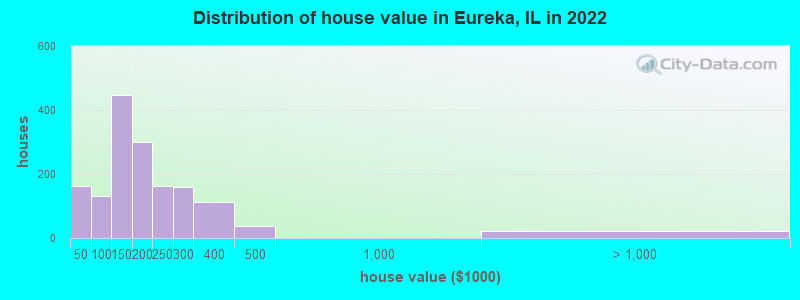
Median house or condo value ($)
Median house or condo value ($ change since 2000)
Mean house or condo value by units in structure - 1, detached ($)
Mean house or condo value by units in structure - 1, attached ($)
Mean house or condo value by units in structure - 2 ($)
Mean house or condo value by units in structure by units in structure - 3 or 4 ($)
Mean house or condo value by units in structure - 5 or more ($)
Mean house or condo value by units in structure - Boat, RV, van, etc. ($)
Mean house or condo value by units in structure - Mobile home ($)
Median house or condo value ($) - White
Median house or condo value ($) - Black or African American
Median house or condo value ($) - Asian
Median house or condo value ($) - Hispanic or Latino
Median house or condo value ($) - American Indian and Alaska Native
Median house or condo value ($) - Multirace
Median house or condo value ($) - Other Race
Median resident age
Resident age diversity
Median resident age - Males
Median resident age - Females
Median resident age - White
Median resident age - Black or African American
Median resident age - Asian
Median resident age - Hispanic or Latino
Median resident age - American Indian and Alaska Native
Median resident age - Multirace
Median resident age - Other Race
Median resident age - Males - White
Median resident age - Males - Black or African American
Median resident age - Males - Asian
Median resident age - Males - Hispanic or Latino
Median resident age - Males - American Indian and Alaska Native
Median resident age - Males - Multirace
Median resident age - Males - Other Race
Median resident age - Females - White
Median resident age - Females - Black or African American
Median resident age - Females - Asian
Median resident age - Females - Hispanic or Latino
Median resident age - Females - American Indian and Alaska Native
Median resident age - Females - Multirace
Median resident age - Females - Other Race
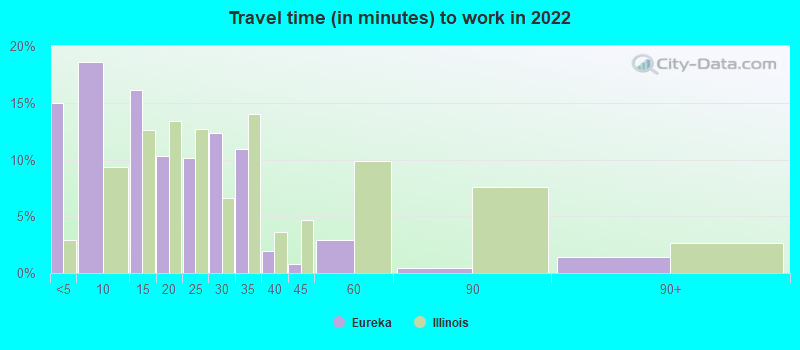
Commute - mean travel time to work (minutes)
Travel time to work - Less than 5 minutes (%)
Travel time to work - Less than 5 minutes (% change since 2000)
Travel time to work - 5 to 9 minutes (%)
Travel time to work - 5 to 9 minutes (% change since 2000)
Travel time to work - 10 to 19 minutes (%)
Travel time to work - 10 to 19 minutes (% change since 2000)
Travel time to work - 20 to 29 minutes (%)
Travel time to work - 20 to 29 minutes (% change since 2000)
Travel time to work - 30 to 39 minutes (%)
Travel time to work - 30 to 39 minutes (% change since 2000)
Travel time to work - 40 to 59 minutes (%)
Travel time to work - 40 to 59 minutes (% change since 2000)
Travel time to work - 60 to 89 minutes (%)
Travel time to work - 60 to 89 minutes (% change since 2000)
Travel time to work - 90 or more minutes (%)
Travel time to work - 90 or more minutes (% change since 2000)
Marital status - Never married (%)
Marital status - Now married (%)
Marital status - Separated (%)
Marital status - Widowed (%)
Marital status - Divorced (%)
Median family income ($)
Median family income (% change since 2000)
Median non-family income ($)
Median non-family income (% change since 2000)
Median per capita income ($)
Median per capita income (% change since 2000)
Median family income ($) - White
Median family income ($) - Black or African American
Median family income ($) - Asian
Median family income ($) - Hispanic or Latino
Median family income ($) - American Indian and Alaska Native
Median family income ($) - Multirace
Median family income ($) - Other Race
Median year house/condo built
Median year apartment built
Year house built - Built 2005 or later (%)
Year house built - Built 2000 to 2004 (%)
Year house built - Built 1990 to 1999 (%)
Year house built - Built 1980 to 1989 (%)
Year house built - Built 1970 to 1979 (%)
Year house built - Built 1960 to 1969 (%)
Year house built - Built 1950 to 1959 (%)
Year house built - Built 1940 to 1949 (%)
Year house built - Built 1939 or earlier (%)
Average household size
Household density (households per square mile)
Average household size - White
Average household size - Black or African American
Average household size - Asian
Average household size - Hispanic or Latino
Average household size - American Indian and Alaska Native
Average household size - Multirace
Average household size - Other Race
Occupied housing units (%)
Vacant housing units (%)
Owner occupied housing units (%)
Renter occupied housing units (%)
Vacancy status - For rent (%)
Vacancy status - For sale only (%)
Vacancy status - Rented or sold, not occupied (%)
Vacancy status - For seasonal, recreational, or occasional use (%)
Vacancy status - For migrant workers (%)
Vacancy status - Other vacant (%)
Residents with income below the poverty level (%)
Residents with income below 50% of the poverty level (%)
Children below poverty level (%)
Poor families by family type - Married-couple family (%)
Poor families by family type - Male, no wife present (%)
Poor families by family type - Female, no husband present (%)
Poverty status for native-born residents (%)
Poverty status for foreign-born residents (%)
Poverty among high school graduates not in families (%)
Poverty among people who did not graduate high school not in families (%)
Residents with income below the poverty level (%) - White
Residents with income below the poverty level (%) - Black or African American
Residents with income below the poverty level (%) - Asian
Residents with income below the poverty level (%) - Hispanic or Latino
Residents with income below the poverty level (%) - American Indian and Alaska Native
Residents with income below the poverty level (%) - Multirace
Residents with income below the poverty level (%) - Other Race
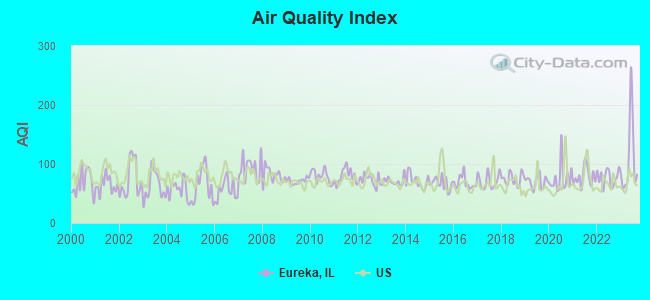
Air pollution - Air Quality Index (AQI)
Air pollution - CO
Air pollution - NO2
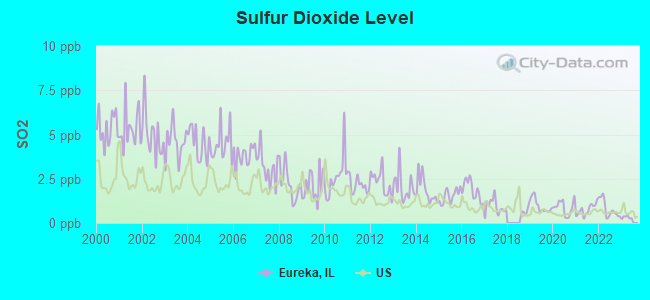
Air pollution - SO2
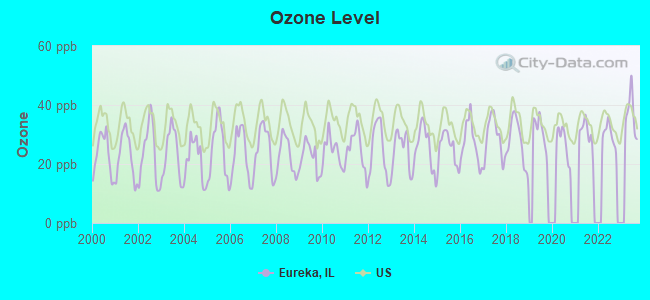
Air pollution - Ozone
Air pollution - PM10
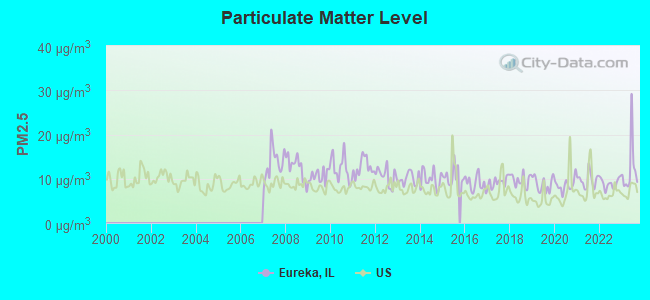
Air pollution - PM25
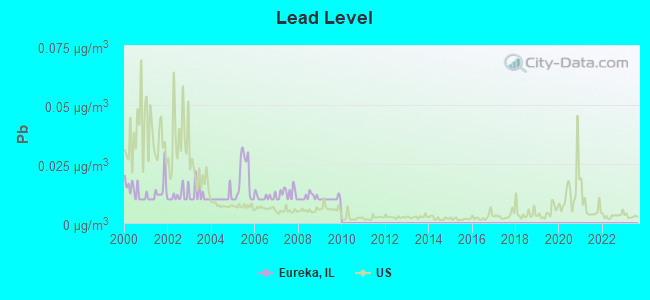
Air pollution - Pb
Crime - Murders per 100,000 population
Crime - Rapes per 100,000 population
Crime - Robberies per 100,000 population
Crime - Assaults per 100,000 population
Crime - Burglaries per 100,000 population
Crime - Thefts per 100,000 population
Crime - Auto thefts per 100,000 population
Crime - Arson per 100,000 population
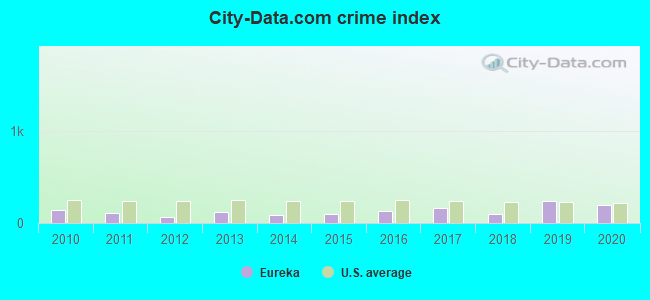
Crime - City-data.com crime index
Crime - Violent crime index
Crime - Property crime index
Crime - Murders per 100,000 population (5 year average)
Crime - Rapes per 100,000 population (5 year average)
Crime - Robberies per 100,000 population (5 year average)
Crime - Assaults per 100,000 population (5 year average)
Crime - Burglaries per 100,000 population (5 year average)
Crime - Thefts per 100,000 population (5 year average)
Crime - Auto thefts per 100,000 population (5 year average)
Crime - Arson per 100,000 population (5 year average)
Crime - City-data.com crime index (5 year average)
Crime - Violent crime index (5 year average)
Crime - Property crime index (5 year average)
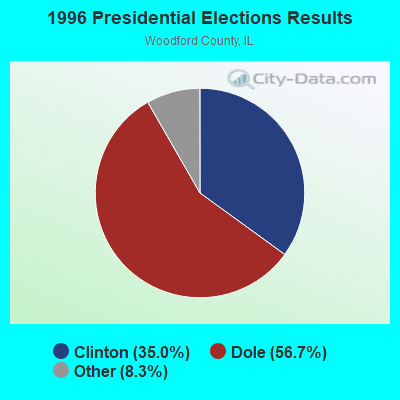
1996 Presidential Elections Results (%) - Democratic Party (Clinton)
1996 Presidential Elections Results (%) - Republican Party (Dole)
1996 Presidential Elections Results (%) - Other
2000 Presidential Elections Results (%) - Democratic Party (Gore)
2000 Presidential Elections Results (%) - Republican Party (Bush)
2000 Presidential Elections Results (%) - Other
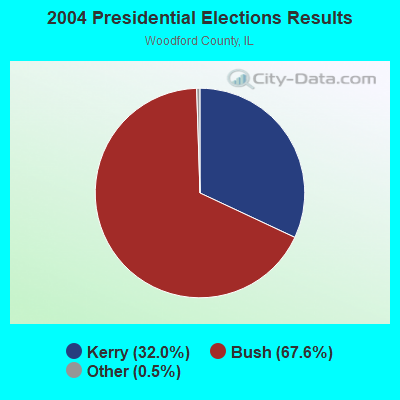
2004 Presidential Elections Results (%) - Democratic Party (Kerry)
2004 Presidential Elections Results (%) - Republican Party (Bush)
2004 Presidential Elections Results (%) - Other
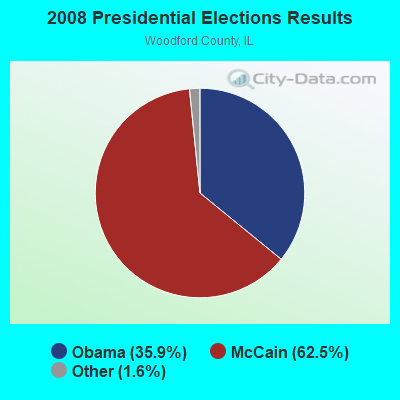
2008 Presidential Elections Results (%) - Democratic Party (Obama)
2008 Presidential Elections Results (%) - Republican Party (McCain)
2008 Presidential Elections Results (%) - Other
2012 Presidential Elections Results (%) - Democratic Party (Obama)
2012 Presidential Elections Results (%) - Republican Party (Romney)
2012 Presidential Elections Results (%) - Other
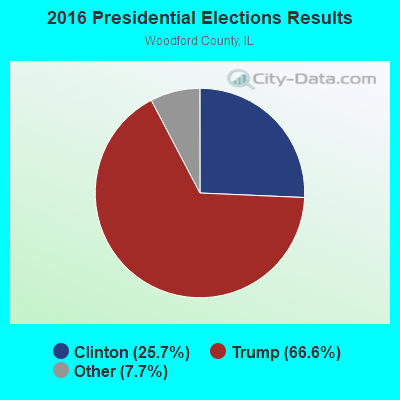
2016 Presidential Elections Results (%) - Democratic Party (Clinton)
2016 Presidential Elections Results (%) - Republican Party (Trump)
2016 Presidential Elections Results (%) - Other
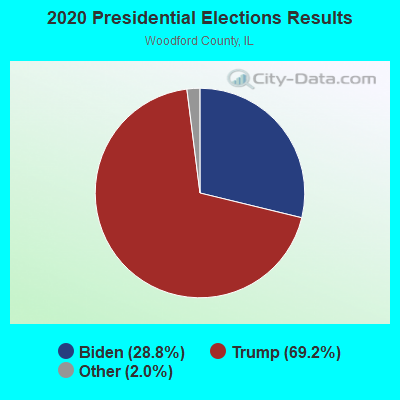
2020 Presidential Elections Results (%) - Democratic Party (Biden)
2020 Presidential Elections Results (%) - Republican Party (Trump)
2020 Presidential Elections Results (%) - Other
Ancestries Reported - Arab (%)
Ancestries Reported - Czech (%)
Ancestries Reported - Danish (%)
Ancestries Reported - Dutch (%)
Ancestries Reported - English (%)
Ancestries Reported - French (%)
Ancestries Reported - French Canadian (%)
Ancestries Reported - German (%)
Ancestries Reported - Greek (%)
Ancestries Reported - Hungarian (%)
Ancestries Reported - Irish (%)
Ancestries Reported - Italian (%)
Ancestries Reported - Lithuanian (%)
Ancestries Reported - Norwegian (%)
Ancestries Reported - Polish (%)
Ancestries Reported - Portuguese (%)
Ancestries Reported - Russian (%)
Ancestries Reported - Scotch-Irish (%)
Ancestries Reported - Scottish (%)
Ancestries Reported - Slovak (%)
Ancestries Reported - Subsaharan African (%)
Ancestries Reported - Swedish (%)
Ancestries Reported - Swiss (%)
Ancestries Reported - Ukrainian (%)
Ancestries Reported - United States (%)
Ancestries Reported - Welsh (%)
Ancestries Reported - West Indian (%)
Ancestries Reported - Other (%)
Educational Attainment - No schooling completed (%)
Educational Attainment - Less than high school (%)
Educational Attainment - High school or equivalent (%)
Educational Attainment - Less than 1 year of college (%)
Educational Attainment - 1 or more years of college (%)
Educational Attainment - Associate degree (%)
Educational Attainment - Bachelor's degree (%)
Educational Attainment - Master's degree (%)
Educational Attainment - Professional school degree (%)
Educational Attainment - Doctorate degree (%)
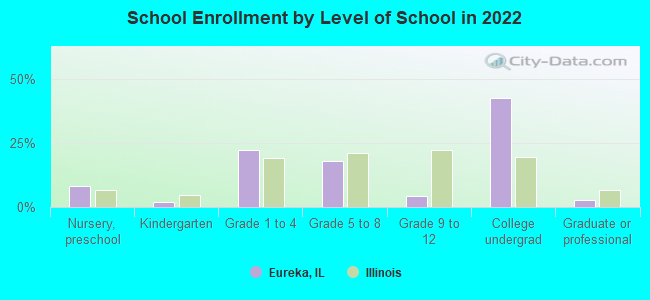
School Enrollment - Nursery, preschool (%)
School Enrollment - Kindergarten (%)
School Enrollment - Grade 1 to 4 (%)
School Enrollment - Grade 5 to 8 (%)
School Enrollment - Grade 9 to 12 (%)
School Enrollment - College undergrad (%)
School Enrollment - Graduate or professional (%)
School Enrollment - Not enrolled in school (%)
School enrollment - Public schools (%)
School enrollment - Private schools (%)
School enrollment - Not enrolled (%)
Median number of rooms in houses and condos
Median number of rooms in apartments
Housing units lacking complete plumbing facilities (%)
Housing units lacking complete kitchen facilities (%)
Density of houses
Urban houses (%)
Rural houses (%)
Households with people 60 years and over (%)
Households with people 65 years and over (%)
Households with people 75 years and over (%)
Households with one or more nonrelatives (%)
Households with no nonrelatives (%)
Population in households (%)
Family households (%)
Nonfamily households (%)
Population in families (%)
Family households with own children (%)
Median number of bedrooms in owner occupied houses
Mean number of bedrooms in owner occupied houses
Median number of bedrooms in renter occupied houses
Mean number of bedrooms in renter occupied houses
Median number of vehichles in owner occupied houses
Mean number of vehichles in owner occupied houses
Median number of vehichles in renter occupied houses
Mean number of vehichles in renter occupied houses
Mortgage status - with mortgage (%)
Mortgage status - with second mortgage (%)
Mortgage status - with home equity loan (%)
Mortgage status - with both second mortgage and home equity loan (%)
Mortgage status - without a mortgage (%)
Average family size
Average family size - White
Average family size - Black or African American
Average family size - Asian
Average family size - Hispanic or Latino
Average family size - American Indian and Alaska Native
Average family size - Multirace
Average family size - Other Race
Geographical mobility - Same house 1 year ago (%)
Geographical mobility - Moved within same county (%)
Geographical mobility - Moved from different county within same state (%)
Geographical mobility - Moved from different state (%)
Geographical mobility - Moved from abroad (%)
Place of birth - Born in state of residence (%)
Place of birth - Born in other state (%)
Place of birth - Native, outside of US (%)
Place of birth - Foreign born (%)
Housing units in structures - 1, detached (%)
Housing units in structures - 1, attached (%)
Housing units in structures - 2 (%)
Housing units in structures - 3 or 4 (%)
Housing units in structures - 5 to 9 (%)
Housing units in structures - 10 to 19 (%)
Housing units in structures - 20 to 49 (%)
Housing units in structures - 50 or more (%)
Housing units in structures - Mobile home (%)
Housing units in structures - Boat, RV, van, etc. (%)
House/condo owner moved in on average (years ago)
Renter moved in on average (years ago)
Year householder moved into unit - Moved in 1999 to March 2000 (%)
Year householder moved into unit - Moved in 1995 to 1998 (%)
Year householder moved into unit - Moved in 1990 to 1994 (%)
Year householder moved into unit - Moved in 1980 to 1989 (%)
Year householder moved into unit - Moved in 1970 to 1979 (%)
Year householder moved into unit - Moved in 1969 or earlier (%)
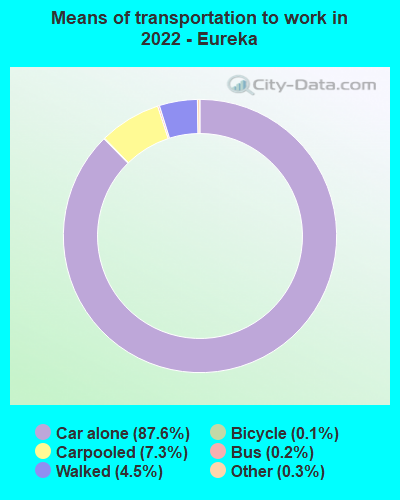
Means of transportation to work - Drove car alone (%)
Means of transportation to work - Carpooled (%)
Means of transportation to work - Public transportation (%)
Means of transportation to work - Bus or trolley bus (%)
Means of transportation to work - Streetcar or trolley car (%)
Means of transportation to work - Subway or elevated (%)
Means of transportation to work - Railroad (%)
Means of transportation to work - Ferryboat (%)
Means of transportation to work - Taxicab (%)
Means of transportation to work - Motorcycle (%)
Means of transportation to work - Bicycle (%)
Means of transportation to work - Walked (%)
Means of transportation to work - Other means (%)
Working at home (%)
Industry diversity
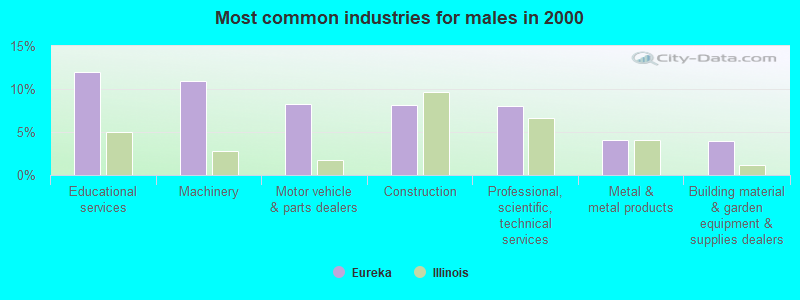
Most Common Industries - Agriculture, forestry, fishing and hunting, and mining (%)
Most Common Industries - Agriculture, forestry, fishing and hunting (%)
Most Common Industries - Mining, quarrying, and oil and gas extraction (%)
Most Common Industries - Construction (%)
Most Common Industries - Manufacturing (%)
Most Common Industries - Wholesale trade (%)
Most Common Industries - Retail trade (%)
Most Common Industries - Transportation and warehousing, and utilities (%)
Most Common Industries - Transportation and warehousing (%)
Most Common Industries - Utilities (%)
Most Common Industries - Information (%)
Most Common Industries - Finance and insurance, and real estate and rental and leasing (%)
Most Common Industries - Finance and insurance (%)
Most Common Industries - Real estate and rental and leasing (%)
Most Common Industries - Professional, scientific, and management, and administrative and waste management services (%)
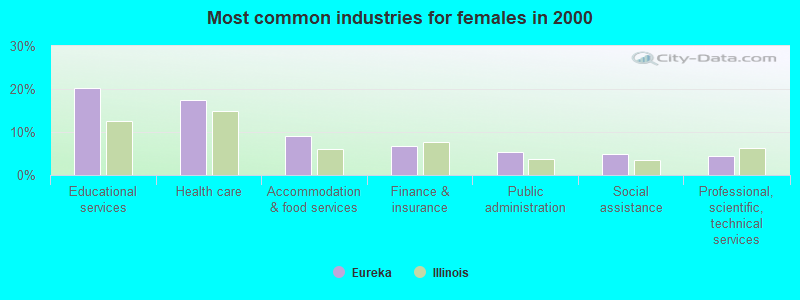
Most Common Industries - Professional, scientific, and technical services (%)
Most Common Industries - Management of companies and enterprises (%)
Most Common Industries - Administrative and support and waste management services (%)
Most Common Industries - Educational services, and health care and social assistance (%)
Most Common Industries - Educational services (%)
Most Common Industries - Health care and social assistance (%)
Most Common Industries - Arts, entertainment, and recreation, and accommodation and food services (%)
Most Common Industries - Arts, entertainment, and recreation (%)
Most Common Industries - Accommodation and food services (%)
Most Common Industries - Other services, except public administration (%)
Most Common Industries - Public administration (%)
Occupation diversity
Most Common Occupations - Management, business, science, and arts occupations (%)
Most Common Occupations - Management, business, and financial occupations (%)
Most Common Occupations - Management occupations (%)
Most Common Occupations - Business and financial operations occupations (%)
Most Common Occupations - Computer, engineering, and science occupations (%)
Most Common Occupations - Computer and mathematical occupations (%)
Most Common Occupations - Architecture and engineering occupations (%)
Most Common Occupations - Life, physical, and social science occupations (%)
Most Common Occupations - Education, legal, community service, arts, and media occupations (%)
Most Common Occupations - Community and social service occupations (%)
Most Common Occupations - Legal occupations (%)
Most Common Occupations - Education, training, and library occupations (%)
Most Common Occupations - Arts, design, entertainment, sports, and media occupations (%)
Most Common Occupations - Healthcare practitioners and technical occupations (%)
Most Common Occupations - Health diagnosing and treating practitioners and other technical occupations (%)
Most Common Occupations - Health technologists and technicians (%)
Most Common Occupations - Service occupations (%)
Most Common Occupations - Healthcare support occupations (%)
Most Common Occupations - Protective service occupations (%)
Most Common Occupations - Fire fighting and prevention, and other protective service workers including supervisors (%)
Most Common Occupations - Law enforcement workers including supervisors (%)
Most Common Occupations - Food preparation and serving related occupations (%)
Most Common Occupations - Building and grounds cleaning and maintenance occupations (%)
Most Common Occupations - Personal care and service occupations (%)
Most Common Occupations - Sales and office occupations (%)
Most Common Occupations - Sales and related occupations (%)
Most Common Occupations - Office and administrative support occupations (%)
Most Common Occupations - Natural resources, construction, and maintenance occupations (%)
Most Common Occupations - Farming, fishing, and forestry occupations (%)
Most Common Occupations - Construction and extraction occupations (%)
Most Common Occupations - Installation, maintenance, and repair occupations (%)
Most Common Occupations - Production, transportation, and material moving occupations (%)
Most Common Occupations - Production occupations (%)
Most Common Occupations - Transportation occupations (%)
Most Common Occupations - Material moving occupations (%)
People in Group quarters - Institutionalized population (%)
People in Group quarters - Correctional institutions (%)
People in Group quarters - Federal prisons and detention centers (%)
People in Group quarters - Halfway houses (%)
People in Group quarters - Local jails and other confinement facilities (including police lockups) (%)
People in Group quarters - Military disciplinary barracks (%)
People in Group quarters - State prisons (%)
People in Group quarters - Other types of correctional institutions (%)
People in Group quarters - Nursing homes (%)
People in Group quarters - Hospitals/wards, hospices, and schools for the handicapped (%)
People in Group quarters - Hospitals/wards and hospices for chronically ill (%)
People in Group quarters - Hospices or homes for chronically ill (%)
People in Group quarters - Military hospitals or wards for chronically ill (%)
People in Group quarters - Other hospitals or wards for chronically ill (%)
People in Group quarters - Hospitals or wards for drug/alcohol abuse (%)
People in Group quarters - Mental (Psychiatric) hospitals or wards (%)
People in Group quarters - Schools, hospitals, or wards for the mentally retarded (%)
People in Group quarters - Schools, hospitals, or wards for the physically handicapped (%)
People in Group quarters - Institutions for the deaf (%)
People in Group quarters - Institutions for the blind (%)
People in Group quarters - Orthopedic wards and institutions for the physically handicapped (%)
People in Group quarters - Wards in general hospitals for patients who have no usual home elsewhere (%)
People in Group quarters - Wards in military hospitals for patients who have no usual home elsewhere (%)
People in Group quarters - Juvenile institutions (%)
People in Group quarters - Long-term care (%)
People in Group quarters - Homes for abused, dependent, and neglected children (%)
People in Group quarters - Residential treatment centers for emotionally disturbed children (%)
People in Group quarters - Training schools for juvenile delinquents (%)
People in Group quarters - Short-term care, detention or diagnostic centers for delinquent children (%)
People in Group quarters - Type of juvenile institution unknown (%)
People in Group quarters - Noninstitutionalized population (%)
People in Group quarters - College dormitories (includes college quarters off campus) (%)
People in Group quarters - Military quarters (%)
People in Group quarters - On base (%)
People in Group quarters - Barracks, unaccompanied personnel housing (UPH), (Enlisted/Officer), ;and similar group living quarters for military personnel (%)
People in Group quarters - Transient quarters for temporary residents (%)
People in Group quarters - Military ships (%)
People in Group quarters - Group homes (%)
People in Group quarters - Homes or halfway houses for drug/alcohol abuse (%)
People in Group quarters - Homes for the mentally ill (%)
People in Group quarters - Homes for the mentally retarded (%)
People in Group quarters - Homes for the physically handicapped (%)
People in Group quarters - Other group homes (%)
People in Group quarters - Religious group quarters (%)
People in Group quarters - Dormitories (%)
People in Group quarters - Agriculture workers' dormitories on farms (%)
People in Group quarters - Job Corps and vocational training facilities (%)
People in Group quarters - Other workers' dormitories (%)
People in Group quarters - Crews of maritime vessels (%)
People in Group quarters - Other nonhousehold living situations (%)
People in Group quarters - Other noninstitutional group quarters (%)
Residents speaking English at home (%)
Residents speaking English at home - Born in the United States (%)
Residents speaking English at home - Native, born elsewhere (%)
Residents speaking English at home - Foreign born (%)
Residents speaking Spanish at home (%)
Residents speaking Spanish at home - Born in the United States (%)
Residents speaking Spanish at home - Native, born elsewhere (%)
Residents speaking Spanish at home - Foreign born (%)
Residents speaking other language at home (%)
Residents speaking other language at home - Born in the United States (%)
Residents speaking other language at home - Native, born elsewhere (%)
Residents speaking other language at home - Foreign born (%)
Class of Workers - Employee of private company (%)
Class of Workers - Self-employed in own incorporated business (%)
Class of Workers - Private not-for-profit wage and salary workers (%)
Class of Workers - Local government workers (%)
Class of Workers - State government workers (%)
Class of Workers - Federal government workers (%)
Class of Workers - Self-employed workers in own not incorporated business and Unpaid family workers (%)
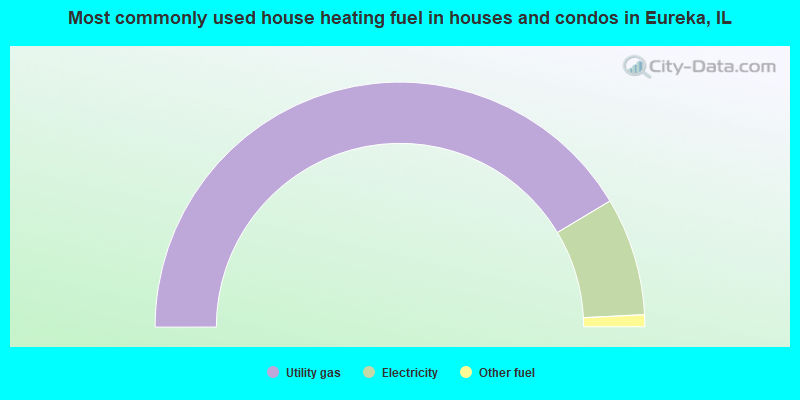
House heating fuel used in houses and condos - Utility gas (%)
House heating fuel used in houses and condos - Bottled, tank, or LP gas (%)
House heating fuel used in houses and condos - Electricity (%)
House heating fuel used in houses and condos - Fuel oil, kerosene, etc. (%)
House heating fuel used in houses and condos - Coal or coke (%)
House heating fuel used in houses and condos - Wood (%)
House heating fuel used in houses and condos - Solar energy (%)
House heating fuel used in houses and condos - Other fuel (%)
House heating fuel used in houses and condos - No fuel used (%)
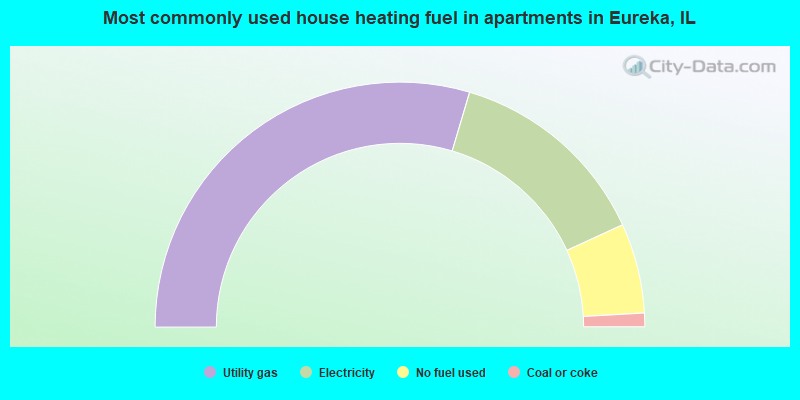
House heating fuel used in apartments - Utility gas (%)
House heating fuel used in apartments - Bottled, tank, or LP gas (%)
House heating fuel used in apartments - Electricity (%)
House heating fuel used in apartments - Fuel oil, kerosene, etc. (%)
House heating fuel used in apartments - Coal or coke (%)
House heating fuel used in apartments - Wood (%)
House heating fuel used in apartments - Solar energy (%)
House heating fuel used in apartments - Other fuel (%)
House heating fuel used in apartments - No fuel used (%)
Armed forces status - In Armed Forces (%)
Armed forces status - Civilian (%)
Armed forces status - Civilian - Veteran (%)
Armed forces status - Civilian - Nonveteran (%)
Fatal accidents locations in years 2005-2021
Fatal accidents locations in 2005
Fatal accidents locations in 2006
Fatal accidents locations in 2007
Fatal accidents locations in 2008
Fatal accidents locations in 2009
Fatal accidents locations in 2010
Fatal accidents locations in 2011
Fatal accidents locations in 2012
Fatal accidents locations in 2013
Fatal accidents locations in 2014
Fatal accidents locations in 2015
Fatal accidents locations in 2016
Fatal accidents locations in 2017
Fatal accidents locations in 2018
Fatal accidents locations in 2019
Fatal accidents locations in 2020
Fatal accidents locations in 2021
Alcohol use - People drinking some alcohol every month (%)
Alcohol use - People not drinking at all (%)
Alcohol use - Average days/month drinking alcohol
Alcohol use - Average drinks/week
Alcohol use - Average days/year people drink much
Audiometry - Average condition of hearing (%)
Audiometry - People that can hear a whisper from across a quiet room (%)
Audiometry - People that can hear normal voice from across a quiet room (%)
Audiometry - Ears ringing, roaring, buzzing (%)
Audiometry - Had a job exposure to loud noise (%)
Audiometry - Had off-work exposure to loud noise (%)
Blood Pressure & Cholesterol - Has high blood pressure (%)
Blood Pressure & Cholesterol - Checking blood pressure at home (%)
Blood Pressure & Cholesterol - Frequently checking blood cholesterol (%)
Blood Pressure & Cholesterol - Has high cholesterol level (%)
Consumer Behavior - Money monthly spent on food at supermarket/grocery store
Consumer Behavior - Money monthly spent on food at other stores
Consumer Behavior - Money monthly spent on eating out
Consumer Behavior - Money monthly spent on carryout/delivered foods
Consumer Behavior - Income spent on food at supermarket/grocery store (%)
Consumer Behavior - Income spent on food at other stores (%)
Consumer Behavior - Income spent on eating out (%)
Consumer Behavior - Income spent on carryout/delivered foods (%)
Current Health Status - General health condition (%)
Current Health Status - Blood donors (%)
Current Health Status - Has blood ever tested for HIV virus (%)
Current Health Status - Left-handed people (%)
Dermatology - People using sunscreen (%)
Diabetes - Diabetics (%)
Diabetes - Had a blood test for high blood sugar (%)
Diabetes - People taking insulin (%)
Diet Behavior & Nutrition - Diet health (%)
Diet Behavior & Nutrition - Milk product consumption (# of products/month)
Diet Behavior & Nutrition - Meals not home prepared (#/week)
Diet Behavior & Nutrition - Meals from fast food or pizza place (#/week)
Diet Behavior & Nutrition - Ready-to-eat foods (#/month)
Diet Behavior & Nutrition - Frozen meals/pizza (#/month)
Drug Use - People that ever used marijuana or hashish (%)
Drug Use - Ever used hard drugs (%)
Drug Use - Ever used any form of cocaine (%)
Drug Use - Ever used heroin (%)
Drug Use - Ever used methamphetamine (%)
Health Insurance - People covered by health insurance (%)
Kidney Conditions-Urology - Avg. # of times urinating at night
Medical Conditions - People with asthma (%)
Medical Conditions - People with anemia (%)
Medical Conditions - People with psoriasis (%)
Medical Conditions - People with overweight (%)
Medical Conditions - Elderly people having difficulties in thinking or remembering (%)
Medical Conditions - People who ever received blood transfusion (%)
Medical Conditions - People having trouble seeing even with glass/contacts (%)
Medical Conditions - People with arthritis (%)
Medical Conditions - People with gout (%)
Medical Conditions - People with congestive heart failure (%)
Medical Conditions - People with coronary heart disease (%)
Medical Conditions - People with angina pectoris (%)
Medical Conditions - People who ever had heart attack (%)
Medical Conditions - People who ever had stroke (%)
Medical Conditions - People with emphysema (%)
Medical Conditions - People with thyroid problem (%)
Medical Conditions - People with chronic bronchitis (%)
Medical Conditions - People with any liver condition (%)
Medical Conditions - People who ever had cancer or malignancy (%)
Mental Health - People who have little interest in doing things (%)
Mental Health - People feeling down, depressed, or hopeless (%)
Mental Health - People who have trouble sleeping or sleeping too much (%)
Mental Health - People feeling tired or having little energy (%)
Mental Health - People with poor appetite or overeating (%)
Mental Health - People feeling bad about themself (%)
Mental Health - People who have trouble concentrating on things (%)
Mental Health - People moving or speaking slowly or too fast (%)
Mental Health - People having thoughts they would be better off dead (%)
Oral Health - Average years since last visit a dentist
Oral Health - People embarrassed because of mouth (%)
Oral Health - People with gum disease (%)
Oral Health - General health of teeth and gums (%)
Oral Health - Average days a week using dental floss/device
Oral Health - Average days a week using mouthwash for dental problem
Oral Health - Average number of teeth
Pesticide Use - Households using pesticides to control insects (%)
Pesticide Use - Households using pesticides to kill weeds (%)
Physical Activity - People doing vigorous-intensity work activities (%)
Physical Activity - People doing moderate-intensity work activities (%)
Physical Activity - People walking or bicycling (%)
Physical Activity - People doing vigorous-intensity recreational activities (%)
Physical Activity - People doing moderate-intensity recreational activities (%)
Physical Activity - Average hours a day doing sedentary activities
Physical Activity - Average hours a day watching TV or videos
Physical Activity - Average hours a day using computer
Physical Functioning - People having limitations keeping them from working (%)
Physical Functioning - People limited in amount of work they can do (%)
Physical Functioning - People that need special equipment to walk (%)
Physical Functioning - People experiencing confusion/memory problems (%)
Physical Functioning - People requiring special healthcare equipment (%)
Prescription Medications - Average number of prescription medicines taking
Preventive Aspirin Use - Adults 40+ taking low-dose aspirin (%)
Reproductive Health - Vaginal deliveries (%)
Reproductive Health - Cesarean deliveries (%)
Reproductive Health - Deliveries resulted in a live birth (%)
Reproductive Health - Pregnancies resulted in a delivery (%)
Reproductive Health - Women breastfeeding newborns (%)
Reproductive Health - Women that had a hysterectomy (%)
Reproductive Health - Women that had both ovaries removed (%)
Reproductive Health - Women that have ever taken birth control pills (%)
Reproductive Health - Women taking birth control pills (%)
Reproductive Health - Women that have ever used Depo-Provera or injectables (%)
Reproductive Health - Women that have ever used female hormones (%)
Sexual Behavior - People 18+ that ever had sex (vaginal, anal, or oral) (%)
Sexual Behavior - Males 18+ that ever had vaginal sex with a woman (%)
Sexual Behavior - Males 18+ that ever performed oral sex on a woman (%)
Sexual Behavior - Males 18+ that ever had anal sex with a woman (%)
Sexual Behavior - Males 18+ that ever had any sex with a man (%)
Sexual Behavior - Females 18+ that ever had vaginal sex with a man (%)
Sexual Behavior - Females 18+ that ever performed oral sex on a man (%)
Sexual Behavior - Females 18+ that ever had anal sex with a man (%)
Sexual Behavior - Females 18+ that ever had any kind of sex with a woman (%)
Sexual Behavior - Average age people first had sex
Sexual Behavior - Average number of female sex partners in lifetime (males 18+)
Sexual Behavior - Average number of female vaginal sex partners in lifetime (males 18+)
Sexual Behavior - Average age people first performed oral sex on a woman (18+)
Sexual Behavior - Average number of woman performed oral sex on in lifetime (18+)
Sexual Behavior - Average number of male sex partners in lifetime (males 18+)
Sexual Behavior - Average number of male anal sex partners in lifetime (males 18+)
Sexual Behavior - Average age people first performed oral sex on a man (18+)
Sexual Behavior - Average number of male oral sex partners in lifetime (18+)
Sexual Behavior - People using protection when performing oral sex (%)
Sexual Behavior - Average number of times people have vaginal or anal sex a year
Sexual Behavior - People having sex without condom (%)
Sexual Behavior - Average number of male sex partners in lifetime (females 18+)
Sexual Behavior - Average number of male vaginal sex partners in lifetime (females 18+)
Sexual Behavior - Average number of female sex partners in lifetime (females 18+)
Sexual Behavior - Circumcised males 18+ (%)
Sleep Disorders - Average hours sleeping at night
Sleep Disorders - People that has trouble sleeping (%)
Smoking-Cigarette Use - People smoking cigarettes (%)
Taste & Smell - People 40+ having problems with smell (%)
Taste & Smell - People 40+ having problems with taste (%)
Taste & Smell - People 40+ that ever had wisdom teeth removed (%)
Taste & Smell - People 40+ that ever had tonsils teeth removed (%)
Taste & Smell - People 40+ that ever had a loss of consciousness because of a head injury (%)
Taste & Smell - People 40+ that ever had a broken nose or other serious injury to face or skull (%)
Taste & Smell - People 40+ that ever had two or more sinus infections (%)
Weight - Average height (inches)
Weight - Average weight (pounds)
Weight - Average BMI
Weight - People that are obese (%)
Weight - People that ever were obese (%)
Weight - People trying to lose weight (%)
According to our research of Illinois and other state lists, there were 4 registered sex offenders living in Eureka, Illinois as of April 27, 2024 . The ratio of all residents to sex offenders in Eureka is 1,451 to 1.The ratio of registered sex offenders to all residents in this city is lower than the state average.
Officers per 1,000 residents here:
1.14Illinois average:
3.06
Latest news from Eureka, IL collected exclusively by city-data.com from local newspapers, TV, and radio stations
Ancestries: German (39.3%), European (13.0%), American (10.1%), Irish (6.7%), Polish (3.3%), Dutch (3.2%).
Current Local Time:
Incorporated on 01/12/1881
Land area: 2.69 square miles.
Population density: 1,920 people per square mile (low).
36 residents are foreign born
This city:
0.7%Illinois:
14.1%
Median real estate property taxes paid for housing units with mortgages in 2022: $3,968 (2.2%)Median real estate property taxes paid for housing units with no mortgage in 2022: $3,245 (2.6%)
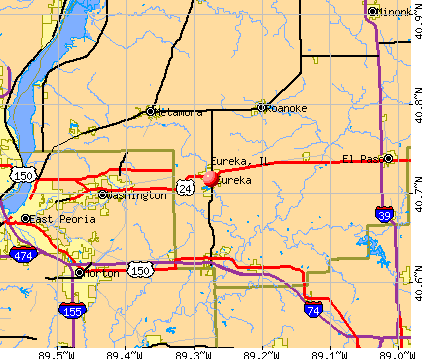
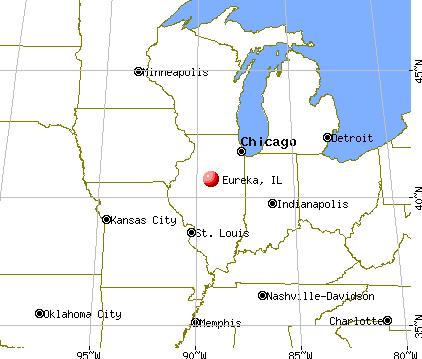
Nearest city with pop. 50,000+: Peoria, IL
Nearest city with pop. 200,000+: Chicago, IL
Nearest cities:
Latitude: 40.72 N, Longitude: 89.28 W
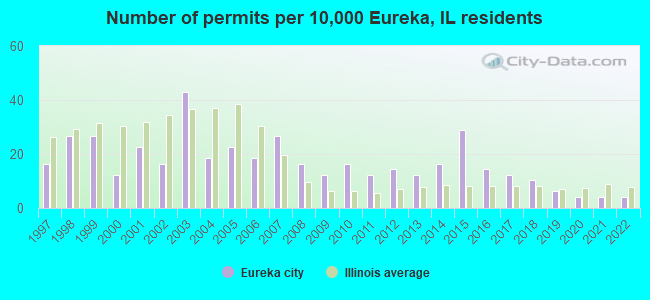
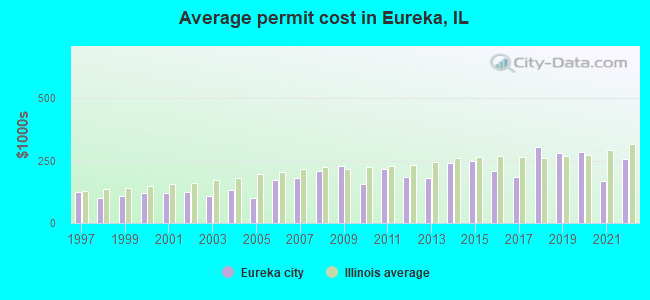
Single-family new house construction building permits:
2022: 2 buildings , average cost: $255,5002021: 2 buildings , average cost: $167,4002020: 2 buildings , average cost: $282,5002019: 3 buildings , average cost: $280,8002018: 5 buildings , average cost: $305,9002017: 6 buildings , average cost: $182,5002016: 7 buildings , average cost: $207,3002015: 14 buildings , average cost: $247,8002014: 8 buildings , average cost: $241,1002013: 6 buildings , average cost: $181,2002012: 7 buildings , average cost: $182,5002011: 6 buildings , average cost: $215,1002010: 8 buildings , average cost: $158,3002009: 6 buildings , average cost: $228,7002008: 8 buildings , average cost: $208,1002007: 13 buildings , average cost: $179,5002006: 9 buildings , average cost: $173,5002005: 11 buildings , average cost: $100,0002004: 9 buildings , average cost: $132,7002003: 21 buildings , average cost: $107,8002002: 8 buildings , average cost: $123,6002001: 11 buildings , average cost: $121,5002000: 6 buildings , average cost: $121,2001999: 13 buildings , average cost: $110,2001998: 13 buildings , average cost: $100,9001997: 8 buildings , average cost: $123,500Unemployment in December 2023:
Population change in the 1990s: +243 (+5.3%).
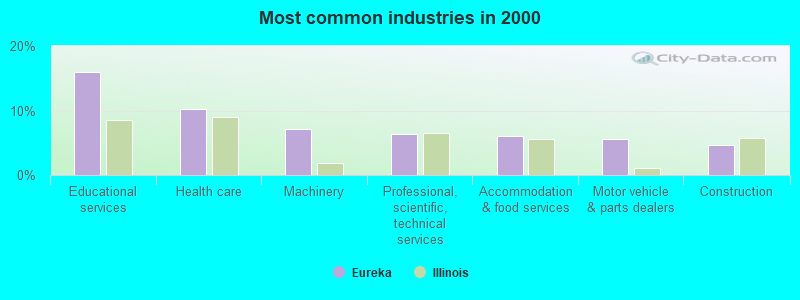
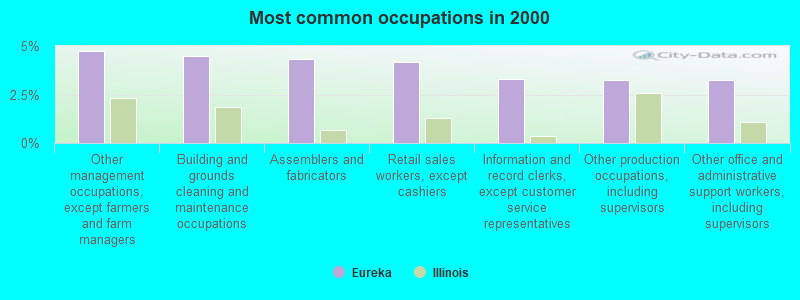
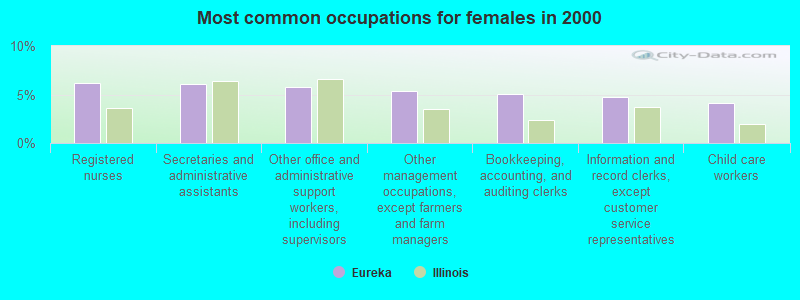
Most common occupations in Eureka, IL (%)
Both Males Females
Other management occupations, except farmers and farm managers (4.7%)
Building and grounds cleaning and maintenance occupations (4.5%)
Assemblers and fabricators (4.3%)
Retail sales workers, except cashiers (4.2%)
Information and record clerks, except customer service representatives (3.3%)
Other production occupations, including supervisors (3.3%)
Other office and administrative support workers, including supervisors (3.3%)
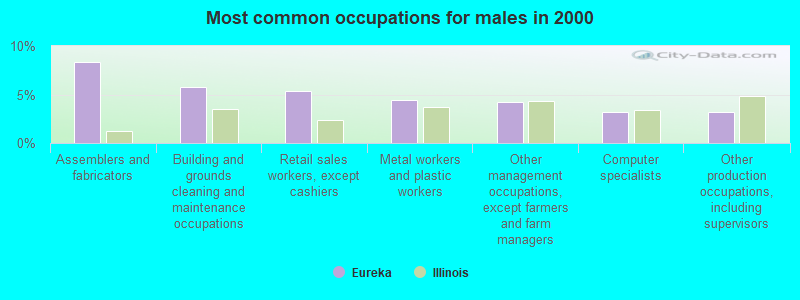
Assemblers and fabricators (8.3%)
Building and grounds cleaning and maintenance occupations (5.7%)
Retail sales workers, except cashiers (5.4%)
Metal workers and plastic workers (4.5%)
Other management occupations, except farmers and farm managers (4.2%)
Computer specialists (3.2%)
Other production occupations, including supervisors (3.2%)
Registered nurses (6.2%)
Secretaries and administrative assistants (6.1%)
Other office and administrative support workers, including supervisors (5.8%)
Other management occupations, except farmers and farm managers (5.3%)
Bookkeeping, accounting, and auditing clerks (5.0%)
Information and record clerks, except customer service representatives (4.8%)
Child care workers (4.1%)
Tornado activity:
Eureka-area historical tornado activity is slightly above Illinois state average. It is 90% greater than the overall U.S. average.
On 7/13/2004, a category F4 (max. wind speeds 207-260 mph) tornado 6.5 miles away from the Eureka city center injured 3 people .
On 6/29/1976, a category F4 tornado 21.2 miles away from the city center caused between $50,000 and $500,000 in damages.
Earthquake activity:
Eureka-area historical earthquake activity is significantly above Illinois state average. It is 121% greater than the overall U.S. average. On 4/18/2008 at 09:36:59, a magnitude 5.4 (5.1 MB, 4.8 MS, 5.4 MW, 5.2 MW, Class: Moderate, Intensity: VI - VII) earthquake occurred 173.2 miles away from Eureka center On 6/10/1987 at 23:48:54, a magnitude 5.1 (4.9 MB, 4.4 MS, 4.6 MS, 5.1 LG) earthquake occurred 150.4 miles away from Eureka center On 4/18/2008 at 09:36:59, a magnitude 5.2 (5.2 MW, Depth: 8.9 mi) earthquake occurred 173.2 miles away from Eureka center On 6/18/2002 at 17:37:15, a magnitude 5.0 (4.3 MB, 4.6 MW, 5.0 LG) earthquake occurred 205.0 miles away from Eureka center On 4/18/2008 at 15:14:16, a magnitude 4.8 (4.5 MB, 4.8 MW, 4.6 MW, Class: Light, Intensity: IV - V) earthquake occurred 172.6 miles away from Eureka center On 6/28/2004 at 06:10:52, a magnitude 4.2 (4.2 MW, Depth: 6.2 mi) earthquake occurred 55.1 miles away from Eureka center Magnitude types: regional Lg-wave magnitude (LG), body-wave magnitude (MB), surface-wave magnitude (MS), moment magnitude (MW) Natural disasters: The number of natural disasters in Woodford County (13) is near the US average (15).Major Disasters (Presidential) Declared: 10Emergencies Declared: 2Storms: 9, Floods: 7, Tornadoes: 3, Winds: 2, Winter Storms: 2, Hurricane: 1, Snow: 1, Snowstorm: 1, Other: 1 (Note: some incidents may be assigned to more than one category). Hospitals and medical centers in Eureka: ADVOCATE EUREKA HOSPITAL (Voluntary non-profit - Private, provides emergency services, 101 S MAJOR ST) APOSTOLIC CHRISTIAN HOME OF EUREKA (610 CRUGER)
MAPLE LAWN HEALTH CENTER (700 NORTH MAIN STREET)
College/University in Eureka: Eureka College Full-time enrollment: 719; Location: 300 E. College Avenue; Private, not-for-profit; Website: www.eureka.edu)
Colleges/universities with over 2000 students nearest to Eureka:
Illinois Central College (about 14 miles; East Peoria, IL ; Full-time enrollment: 7,158)
Bradley University (about 18 miles; Peoria, IL ; FT enrollment: 5,152)
Heartland Community College (about 19 miles; Normal, IL ; FT enrollment: 3,958)
Illinois State University (about 21 miles; Normal, IL ; FT enrollment: 18,804)
Illinois Wesleyan University (about 22 miles; Bloomington, IL ; FT enrollment: 2,323)
Illinois Valley Community College (about 42 miles; Oglesby, IL ; FT enrollment: 2,747)
Richland Community College (about 61 miles; Decatur, IL ; FT enrollment: 2,434)
Public high school in Eureka:
Public elementary/middle schools in Eureka:
See full list of schools located in Eureka Library in Eureka: EUREKA PUBLIC LIBRARY DISTRICT Operating income: $430,223; Location: 202 SOUTH MAIN STREET; 18,536 books ; 2,332 audio materials ; 3,294 video materials ; 7 local licensed databases ; 15 state licensed databases ; 76 print serial subscriptions )
User-submitted facts and corrections:
Liberty Bible Church 801 N. Main P.O. Box 127 Eureka, IL 61530 309-467-4814 Rev. Tom Zobrist www.libertybiblechurch.org
Birthplace of: Andy Studebaker - Football player, Ben Zobrist - Baseball player, Levi Branson Reeder - Politician.
Woodford County has a predicted average indoor radon screening level greater than 4 pCi/L (pico curies per liter) - Highest Potential Drinking water stations with addresses in Eureka and their reported violations in the past:
WOODFORD COUNTY IZAAK WALTON (Population served: 200, Groundwater):
Past health violations:
MCL, Monthly (TCR) - Between JUL-2006 and SEP-2006, Contaminant: Coliform. Follow-up actions: St Formal NOV issued (SEP-18-2006), St Public Notif requested (SEP-18-2006)
Past monitoring violations:
2 routine major monitoring violations
Drinking water stations with addresses in Eureka that have no violations reported:
EUREKA (Address: 128 N. MAIN Population served: 5,071, Primary Water Source Type: Groundwater)
ROANOKE MENNONITE CHURCH (Population served: 100, Primary Water Source Type: Groundwater)
Average household size: This city:
2.5 peopleIllinois:
2.6 people
Percentage of family households: This city:
67.0%Whole state:
65.8%
Percentage of households with unmarried partners: This city:
3.9%Whole state:
6.3%
Likely homosexual households (counted as self-reported same-sex unmarried-partner households)
Lesbian couples: 0.1% of all households Gay men: 0.1% of all households
People in group quarters in Eureka in 2010:
370 people in college/university student housing
194 people in nursing facilities/skilled-nursing facilities
44 people in local jails and other municipal confinement facilities
8 people in group homes intended for adults
4 people in emergency and transitional shelters (with sleeping facilities) for people experiencing homelessness
People in group quarters in Eureka in 2000:
301 people in college dormitories (includes college quarters off campus)
227 people in nursing homes
16 people in local jails and other confinement facilities (including police lockups)
4 people in homes for the mentally retarded
2 people in other noninstitutional group quarters
Banks with branches in Eureka (2011 data):
Heartland Bank and Trust Company: Motor Facility, 108 North Main Street Branch, South Main Street Branch. Info updated 2011/08/08: Bank assets: $1,943.8 mil, Deposits: $1,632.9 mil, headquarters in Bloomington, IL, positive income , Commercial Lending Specialization, 49 total offices , Holding Company: Heartland Bancorp, Inc.
Goodfield State Bank: Eureka Branch at 1805 South Main Street, branch established on 2007/02/14. Info updated 2006/11/03: Bank assets: $70.0 mil, Deposits: $58.7 mil, headquarters in Goodfield, IL, positive income , Commercial Lending Specialization, 2 total offices , Holding Company: Goodfield Financial Corporation
Morton Community Bank: Eureka Branch at 205 South Main Street, branch established on 1888/01/01. Info updated 2010/12/15: Bank assets: $2,667.0 mil, Deposits: $2,086.4 mil, headquarters in Morton, IL, positive income , Commercial Lending Specialization, 32 total offices , Holding Company: Hometown Community Bancorp, Inc. Esop And Trust
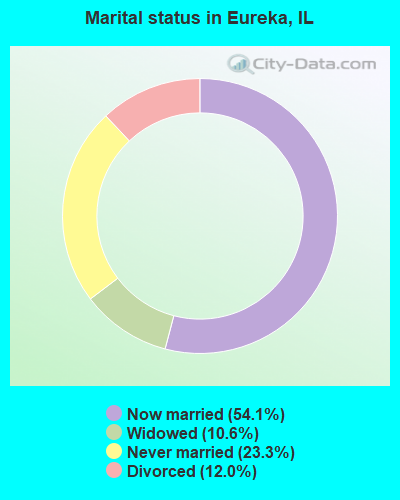
For population 15 years and over in Eureka:
Never married: 23.3%Now married: 54.1%Separated: 0.0%Widowed: 10.6%Divorced: 12.0% For population 25 years and over in Eureka:
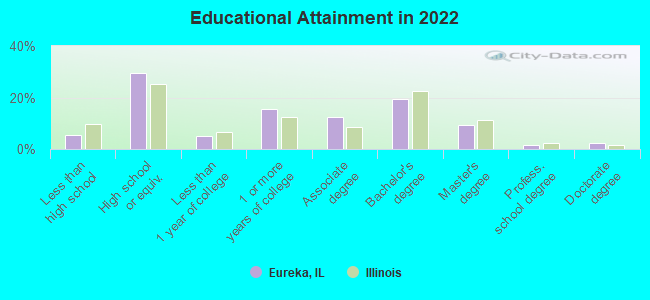
High school or higher: 94.2%Bachelor's degree or higher: 31.2%Graduate or professional degree: 12.2%Unemployed: 1.2%Mean travel time to work (commute): 23.7 minutes
Education Gini index (Inequality in education) Here:
9.5Illinois average:
12.5
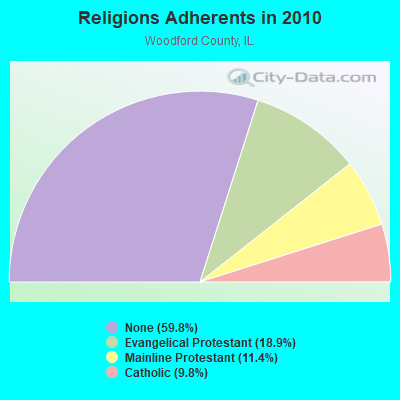
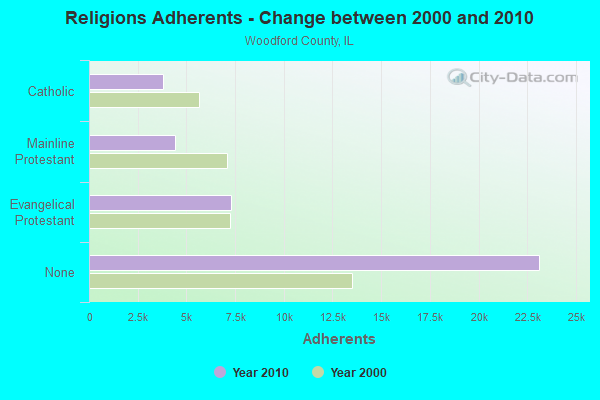
Religion statistics for Eureka, IL (based on Woodford County data)
Religion Adherents Congregations Evangelical Protestant 7,310 41 Mainline Protestant 4,409 19 Catholic 3,804 8 Other 14 - None 23,127 -
Source: Clifford Grammich, Kirk Hadaway, Richard Houseal, Dale E.Jones, Alexei Krindatch, Richie Stanley and Richard H.Taylor. 2012. 2010 U.S.Religion Census: Religious Congregations & Membership Study. Association of Statisticians of American Religious Bodies. Jones, Dale E., et al. 2002. Congregations and Membership in the United States 2000. Nashville, TN: Glenmary Research Center. Graphs represent county-level data
Food Environment Statistics: Number of grocery stores : 8This county :
2.11 / 10,000 pop.Illinois :
2.24 / 10,000 pop.
Number of convenience stores (no gas) : 2Here :
0.53 / 10,000 pop.Illinois :
0.75 / 10,000 pop.
Number of convenience stores (with gas) : 12Woodford County :
3.16 / 10,000 pop.Illinois :
2.61 / 10,000 pop.
Number of full-service restaurants : 31This county :
8.17 / 10,000 pop.Illinois :
6.86 / 10,000 pop.
Adult diabetes rate : Woodford County :
8.9%State :
8.3%
Adult obesity rate : This county :
27.1%State :
25.2%
Low-income preschool obesity rate : This county :
9.5%State :
14.5%
Health and Nutrition:
Average overall health of teeth and gums : Eureka:
49.6%Illinois:
47.2%
People feeling badly about themselves : This city:
18.9%Illinois:
20.5%
People not drinking alcohol at all : Eureka:
9.0%Illinois:
10.8%
Average hours sleeping at night : This city:
7.0Illinois:
6.8
General health condition : This city:
57.9%Illinois:
56.4%
Average condition of hearing : More about Health and Nutrition of Eureka, IL Residents
Local government employment and payroll (March 2022)
Function
Full-time employees
Monthly full-time payroll
Average yearly full-time wage
Part-time employees
Monthly part-time payroll
Police Protection - Officers
6 $29,085 $58,170 1 $462 Streets and Highways
4 $19,731 $59,193 1 $983 Water Supply
2 $11,108 $66,648 0 $0 Other Government Administration
2 $10,881 $65,286 12 $4,225 Financial Administration
1 $5,238 $62,856 0 $0 Sewerage
1 $6,157 $73,884 0 $0
Totals for Government
16 $82,200 $61,650 14 $5,671
Eureka government finances - Expenditure in 2017 (per resident):
Current Operations - Water Utilities: $777,000 ($150.44)
Police Protection: $587,000 ($113.65)Sewerage: $497,000 ($96.22)Regular Highways: $359,000 ($69.51)General Public Buildings: $317,000 ($61.37)General - Other: $144,000 ($27.88)Parks and Recreation: $100,000 ($19.36)Central Staff Services: $23,000 ($4.45)General - Interest on Debt: $11,000 ($2.13)
Intergovernmental to Local - Other - General - Other: $7,000 ($1.36)
Other Capital Outlay - Water Utilities: $572,000 ($110.75)
Regular Highways: $538,000 ($104.16)Sewerage: $300,000 ($58.08)General - Other: $199,000 ($38.53)Police Protection: $68,000 ($13.17)Parks and Recreation: $32,000 ($6.20)Central Staff Services: $3,000 ($0.58)Total Salaries and Wages: $963,000 ($186.45)
Eureka government finances - Revenue in 2017 (per resident):
Charges - Sewerage: $445,000 ($86.16)
Other: $241,000 ($46.66)Miscellaneous - Fines and Forfeits: $58,000 ($11.23)
General Revenue - Other: $34,000 ($6.58)Interest Earnings: $28,000 ($5.42)Revenue - Water Utilities: $790,000 ($152.95)
State Intergovernmental - General Local Government Support: $1,358,000 ($262.92)
Highways: $141,000 ($27.30)Tax - Property: $471,000 ($91.19)
Other License: $191,000 ($36.98)Other Selective Sales: $58,000 ($11.23)
Eureka government finances - Debt in 2017 (per resident):
Long Term Debt - Beginning Outstanding - Unspecified Public Purpose: $490,000 ($94.87)
Outstanding Unspecified Public Purpose: $394,000 ($76.28)Retired Unspecified Public Purpose: $96,000 ($18.59)
Eureka government finances - Cash and Securities in 2017 (per resident):
Other Funds - Cash and Securities: $4,572,000 ($885.19)
Businesses in Eureka, IL
Name Count Name Count
Ace Hardware 1 Hardee's 1 CVS 1 Pizza Hut 1 Chevrolet 1 RadioShack 1 Curves 1 Subway 1 Ford 1 UPS 1 H&R Block 1
Strongest AM radio stations in Eureka:
WWFS (1290 AM; 5 kW; PEORIA, IL; Owner: MONTEREY LICENSES, LLC)
WMBD (1470 AM; 5 kW; PEORIA, IL; Owner: MONTEREY LICENSES, LLC)
WVEL (1140 AM; daytime; 5 kW; PEKIN, IL)
WSCR (670 AM; 50 kW; CHICAGO, IL; Owner: INFINITY BROADCASTING OPERATIONS, INC.)
WLS (890 AM; 50 kW; CHICAGO, IL; Owner: WLS, INC.)
WPEO (1020 AM; daytime; 1 kW; PEORIA, IL)
WGN (720 AM; 50 kW; CHICAGO, IL; Owner: WGN CONTINENTAL BROADCASTING CO.)
WYLL (1160 AM; 50 kW; CHICAGO, IL; Owner: SCA LICENSE CORPORATION)
WBBM (780 AM; 50 kW; CHICAGO, IL; Owner: INFINITY BROADCASTING OPERATIONS, INC.)
WMVP (1000 AM; 50 kW; CHICAGO, IL; Owner: ABC, INC.)
WTMJ (620 AM; 50 kW; MILWAUKEE, WI; Owner: JOURNAL BROADCAST CORPORATION)
KXEN (1010 AM; 50 kW; FESTUS-ST. LOUIS, MO; Owner: BDJ RADIO ENTERPRISES, LLC)
KMOX (1120 AM; 50 kW; ST. LOUIS, MO; Owner: INFINITY BROADCASTING OPERATIONS, INC.)
Strongest FM radio stations in Eureka:
WRVP (98.5 FM; EUREKA, IL; Owner: REGENT BROADCASTING OF PEORIA, INC.)
WSWT (106.9 FM; PEORIA, IL; Owner: MONTEREY LICENSES, LLC)
WDQX (102.3 FM; MORTON, IL; Owner: AAA ENTERTAINMENT LICENSING LLC)
WXMP (105.7 FM; PEORIA, IL; Owner: AAA ENTERTAINMENT LICENSING LLC)
WBNH (88.5 FM; PEKIN, IL; Owner: CENTRAL ILLINOIS RADIO FELLOWSHIP, INC.)
WGLO (95.5 FM; PEKIN, IL; Owner: REGENT BROADCASTING OF PEORIA, INC.)
WCBU (89.9 FM; PEORIA, IL; Owner: BRADLEY UNIVERSITY)
WPBG (93.3 FM; PEORIA, IL; Owner: MONTEREY LICENSES, LLC)
WIXO (99.9 FM; BARTONVILLE, IL; Owner: REGENT BROADCASTING OF PEORIA, INC.)
WCIC (91.5 FM; PEKIN, IL; Owner: ILLINOIS BIBLE INSTITUTE, INC.)
WXCL (104.9 FM; PEKIN, IL; Owner: AAA ENTERTAINMENT LICENSING LLC)
WPMJ (94.3 FM; CHILLICOTHE, IL; Owner: KELLY COMMUNICATIONS, INC.)
WIHN (96.7 FM; NORMAL, IL; Owner: AAA ENTERTAINMENT LICENSING LLC)
WBNQ (101.5 FM; BLOOMINGTON, IL; Owner: CITADEL BROADCASTING COMPANY)
WGLT (89.1 FM; NORMAL, IL; Owner: ILLINOIS STATE UNIVERSITY)
W278AE (103.5 FM; PEORIA, IL; Owner: ILLINOIS STATE UNIVERSITY)
WBWN (104.1 FM; LE ROY, IL; Owner: CITADEL BROADCASTING COMPANY)
WPPY (101.1 FM; GLASFORD, IL; Owner: REGENT BROADCASTING OF PEORIA, INC.)
WZPW (92.3 FM; PEORIA, IL; Owner: B&G BROADCASTING, INC.)
W264AG (100.7 FM; BLOOMINGTON, IL; Owner: CENTRAL ILLINOIS RADIO FELLOWSHIP, INC.)
TV broadcast stations around Eureka:
WYZZ-TV (Channel 43; BLOOMINGTON, IL; Owner: WYZZ LICENSEE, INC.)
WAOE (Channel 59; PEORIA, IL; Owner: FOUR SEASONS PEORIA, LLC)
WEEK-TV (Channel 25; PEORIA, IL; Owner: WEEK-TV LICENSE, INC.)
WHOI (Channel 19; PEORIA, IL; Owner: CHELSEY BROADCASTING COMPANY OF PEORIA, LLC)
WTVP (Channel 47; PEORIA, IL; Owner: ILLINOIS VALLEY PUB TELECOMM CORP)
WMBD-TV (Channel 31; PEORIA, IL; Owner: NEXSTAR BROADCASTING OF PEORIA, L.L.C.)
WWTO-TV (Channel 35; LASALLE, IL; Owner: TRINITY BROADCASTING NETWORK)
W51CT (Channel 51; BLOOMINGTON, IL; Owner: TRINITY BROADCASTING NETWORK)
W41BO (Channel 41; PEORIA, IL; Owner: TRINITY BROADCASTING NETWORK)
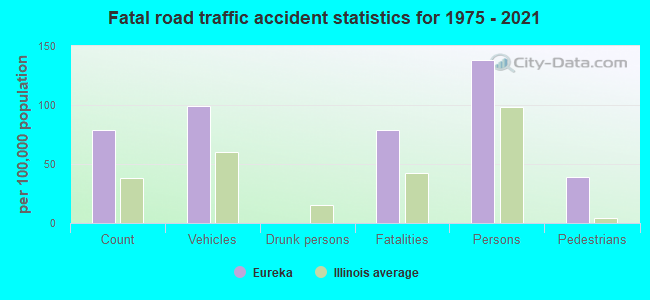
Eureka fatal accident statistics for 1975 - 2021
Eureka fatal accident list:
Nov 4, 2010 09:30 AM, Us-24, Lat: 40.719419, Lon: -89.308247, Vehicles: 1, Persons: 1, Fatalities: 1Lat: 40.722380, Lon: -89.274090, Vehicles: 1, Persons: 2, Pedestrians: 1, Fatalities: 1Lat: 40.707900, Lon: -89.272740, Vehicles: 2, Persons: 3, Pedestrians: 1, Fatalities: 1Vehicles: 1, Persons: 1, Fatalities: 1
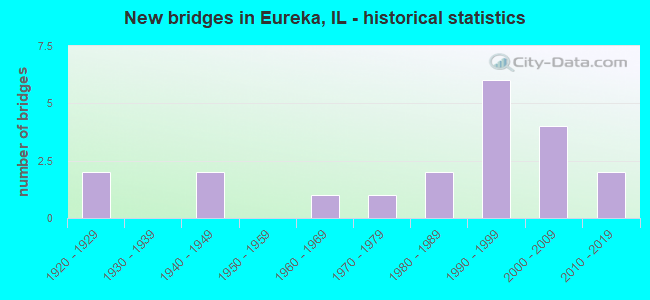
National Bridge Inventory (NBI) Statistics 20 Number of bridges154ft / 47.1m Total length39,500 Total average daily traffic3,885 Total average daily truck traffic52,089 Total future (year 2032) average daily traffic
New bridges - historical statistics
2 1920-1929 2 1940-1949 1 1960-1969 1 1970-1979 2 1980-1989 6 1990-1999 4 2000-2009 2 2010-2019
See full National Bridge Inventory statistics for Eureka, IL
FCC Registered Cell Phone Towers: 1 (
See the full list of FCC Registered Cell Phone Towers in Eureka )
FCC Registered Antenna Towers: 36 (
See the full list of FCC Registered Antenna Towers )
FCC Registered Broadcast Land Mobile Towers: 15 (
See the full list of FCC Registered Broadcast Land Mobile Towers in Eureka, IL )
FCC Registered Microwave Towers: 43 (
See the full list of FCC Registered Microwave Towers in this town )
FCC Registered Paging Towers: 1 (
See the full list of FCC Registered Paging Towers )
FCC Registered Amateur Radio Licenses: 39 (
See the full list of FCC Registered Amateur Radio Licenses in Eureka )
FAA Registered Aircraft: 4
Aircraft: RICHARD A OLSON VANS RV-4 (Category: Land, Seats: 2, Weight: Up to 12,499 Pounds), Engine: LYCOMING O-360-A1A (180 HP) (Reciprocating)N-Number: 42321, N42321, N-42321, Serial Number: 3275, Year manufactured: 2018, Airworthiness Date: 11/08/2018, Certificate Issue Date: 07/11/2018Registrant (Co-Owned): Richard Allen Olson, 401 S Henry St, Eureka, IL 61530, Other Owners: Wendy Lynn OlsonAircraft: OLSON ODEEN R BUSHBY MM-II (Category: Land, Weight: Up to 12,499 Pounds), Engine: LYCOMING O-320-A1A (150 HP) (Reciprocating)N-Number: 64DR, N64DR, N-64DR, Serial Number: 1549, Year manufactured: 2020, Airworthiness Date: 03/13/2020, Certificate Issue Date: 04/09/2004Registrant (Individual): Odeen R Olson, 501 W Maple Dr, Eureka, IL 61530Aircraft: HAWKER BEECHCRAFT CORP B200GT (Category: Land, Engines: 2, Seats: 9, Weight: 12,500 - 19,999 Pounds), Engine: P&W CANADA PT6A-52 (898 HP) (Turbo-prop)N-Number: 900VM, N900VM, N-900VM, Serial Number: BY-54, Year manufactured: 2008, Airworthiness Date: 08/22/2008, Certificate Issue Date: 10/03/2008Registrant (LLC): Dutchman Leasing LLC, 625 Timber Ridge Ct, Eureka, IL 61530Aircraft: DJI INNOVATIONS PHANTOM 2 P3307 (Category: Land, Engines: 4), Engine: ElectricN-Number: 5483C, N5483C, N-5483C, Serial Number: PH64542216, Certificate Issue Date: 05/20/2015Registrant (Corporation): J Jacobs Inc, 203 Edgewood Rd, Eureka, IL 61530Deregistered: Cancel Date: 10/23/2018
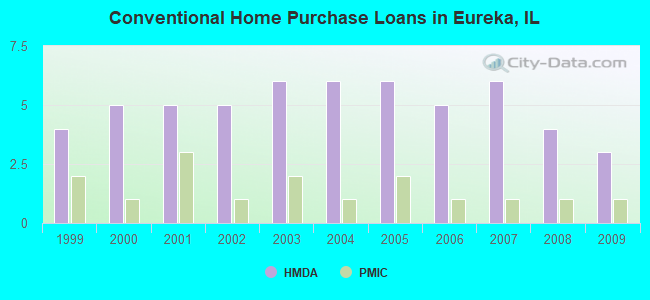
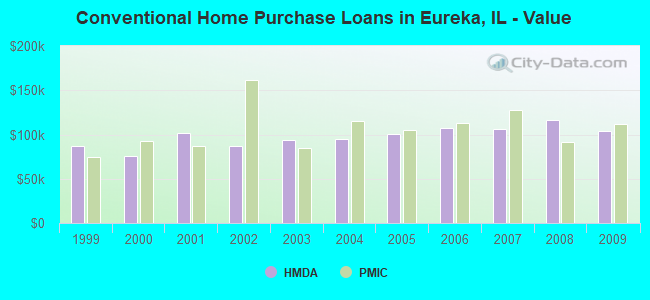
Home Mortgage Disclosure Act Aggregated Statistics For Year 2009(Based on 2 partial tracts) A) FHA, FSA/RHS & VA B) Conventional C) Refinancings D) Home Improvement Loans F) Non-occupant Loans on Number Average Value Number Average Value Number Average Value Number Average Value Number Average Value
LOANS ORIGINATED 1 $131,470 3 $103,820 16 $143,900 1 $65,170 1 $382,790 APPLICATIONS APPROVED, NOT ACCEPTED 0 $0 0 $0 0 $0 0 $0 0 $0 APPLICATIONS DENIED 0 $0 0 $0 1 $150,970 0 $0 0 $0 APPLICATIONS WITHDRAWN 0 $0 0 $0 1 $88,970 0 $0 0 $0 FILES CLOSED FOR INCOMPLETENESS 0 $0 0 $0 0 $0 0 $0 0 $0
Aggregated Statistics For Year 2008(Based on 2 partial tracts) A) FHA, FSA/RHS & VA B) Conventional C) Refinancings D) Home Improvement Loans F) Non-occupant Loans on Number Average Value Number Average Value Number Average Value Number Average Value Number Average Value
LOANS ORIGINATED 1 $169,020 4 $116,205 6 $118,242 1 $51,230 1 $50,170 APPLICATIONS APPROVED, NOT ACCEPTED 0 $0 0 $0 0 $0 0 $0 0 $0 APPLICATIONS DENIED 0 $0 0 $0 1 $162,080 1 $74,690 0 $0 APPLICATIONS WITHDRAWN 0 $0 0 $0 1 $108,600 0 $0 0 $0 FILES CLOSED FOR INCOMPLETENESS 0 $0 0 $0 0 $0 0 $0 0 $0
Aggregated Statistics For Year 2007(Based on 2 partial tracts) A) FHA, FSA/RHS & VA B) Conventional C) Refinancings D) Home Improvement Loans F) Non-occupant Loans on Number Average Value Number Average Value Number Average Value Number Average Value Number Average Value
LOANS ORIGINATED 1 $69,800 6 $105,915 6 $94,567 1 $54,660 1 $55,660 APPLICATIONS APPROVED, NOT ACCEPTED 0 $0 0 $0 1 $81,500 0 $0 0 $0 APPLICATIONS DENIED 0 $0 1 $52,880 3 $116,027 1 $63,650 0 $0 APPLICATIONS WITHDRAWN 0 $0 0 $0 1 $50,570 0 $0 0 $0 FILES CLOSED FOR INCOMPLETENESS 0 $0 0 $0 0 $0 0 $0 0 $0
Aggregated Statistics For Year 2006(Based on 2 partial tracts) A) FHA, FSA/RHS & VA B) Conventional C) Refinancings D) Home Improvement Loans F) Non-occupant Loans on Number Average Value Number Average Value Number Average Value Number Average Value Number Average Value
LOANS ORIGINATED 1 $75,220 5 $107,730 5 $98,832 1 $35,890 1 $84,740 APPLICATIONS APPROVED, NOT ACCEPTED 0 $0 0 $0 1 $105,170 0 $0 0 $0 APPLICATIONS DENIED 0 $0 0 $0 3 $85,290 1 $29,480 0 $0 APPLICATIONS WITHDRAWN 0 $0 0 $0 2 $72,940 0 $0 0 $0 FILES CLOSED FOR INCOMPLETENESS 0 $0 0 $0 0 $0 0 $0 0 $0
Aggregated Statistics For Year 2005(Based on 2 partial tracts) A) FHA, FSA/RHS & VA B) Conventional C) Refinancings D) Home Improvement Loans F) Non-occupant Loans on Number Average Value Number Average Value Number Average Value Number Average Value Number Average Value
LOANS ORIGINATED 1 $59,360 6 $100,758 6 $90,182 1 $43,360 1 $41,580 APPLICATIONS APPROVED, NOT ACCEPTED 0 $0 0 $0 1 $136,300 0 $0 0 $0 APPLICATIONS DENIED 0 $0 1 $113,430 4 $104,505 1 $12,230 0 $0 APPLICATIONS WITHDRAWN 0 $0 0 $0 2 $143,305 0 $0 0 $0 FILES CLOSED FOR INCOMPLETENESS 0 $0 0 $0 0 $0 0 $0 0 $0
Aggregated Statistics For Year 2004(Based on 2 partial tracts) B) Conventional C) Refinancings D) Home Improvement Loans F) Non-occupant Loans on Number Average Value Number Average Value Number Average Value Number Average Value
LOANS ORIGINATED 6 $94,468 8 $98,878 2 $26,705 1 $78,060 APPLICATIONS APPROVED, NOT ACCEPTED 0 $0 1 $55,990 0 $0 0 $0 APPLICATIONS DENIED 1 $48,320 2 $99,845 1 $23,860 0 $0 APPLICATIONS WITHDRAWN 0 $0 2 $92,475 0 $0 0 $0 FILES CLOSED FOR INCOMPLETENESS 0 $0 0 $0 0 $0 0 $0
Aggregated Statistics For Year 2003(Based on 2 partial tracts) A) FHA, FSA/RHS & VA B) Conventional C) Refinancings D) Home Improvement Loans F) Non-occupant Loans on Number Average Value Number Average Value Number Average Value Number Average Value Number Average Value
LOANS ORIGINATED 1 $53,340 6 $93,697 20 $87,140 1 $19,430 1 $37,740 APPLICATIONS APPROVED, NOT ACCEPTED 0 $0 0 $0 1 $63,590 0 $0 0 $0 APPLICATIONS DENIED 0 $0 0 $0 2 $92,970 1 $8,990 0 $0 APPLICATIONS WITHDRAWN 0 $0 0 $0 2 $83,350 0 $0 0 $0 FILES CLOSED FOR INCOMPLETENESS 0 $0 0 $0 0 $0 0 $0 0 $0
Aggregated Statistics For Year 2002(Based on 2 partial tracts) B) Conventional C) Refinancings D) Home Improvement Loans F) Non-occupant Loans on Number Average Value Number Average Value Number Average Value Number Average Value
LOANS ORIGINATED 5 $87,028 16 $86,798 3 $13,000 1 $78,530 APPLICATIONS APPROVED, NOT ACCEPTED 0 $0 1 $63,060 0 $0 0 $0 APPLICATIONS DENIED 0 $0 3 $58,940 0 $0 0 $0 APPLICATIONS WITHDRAWN 0 $0 1 $107,150 0 $0 0 $0 FILES CLOSED FOR INCOMPLETENESS 0 $0 0 $0 0 $0 0 $0
Aggregated Statistics For Year 2001(Based on 2 partial tracts) A) FHA, FSA/RHS & VA B) Conventional C) Refinancings D) Home Improvement Loans Number Average Value Number Average Value Number Average Value Number Average Value
LOANS ORIGINATED 1 $42,370 5 $101,464 13 $86,052 2 $15,040 APPLICATIONS APPROVED, NOT ACCEPTED 0 $0 0 $0 1 $35,170 0 $0 APPLICATIONS DENIED 0 $0 1 $39,530 2 $71,685 0 $0 APPLICATIONS WITHDRAWN 0 $0 0 $0 1 $50,100 0 $0 FILES CLOSED FOR INCOMPLETENESS 0 $0 0 $0 0 $0 0 $0
Aggregated Statistics For Year 2000(Based on 2 partial tracts) B) Conventional C) Refinancings D) Home Improvement Loans Number Average Value Number Average Value Number Average Value
LOANS ORIGINATED 5 $75,578 4 $74,445 2 $24,425 APPLICATIONS APPROVED, NOT ACCEPTED 0 $0 1 $44,750 0 $0 APPLICATIONS DENIED 0 $0 1 $92,340 1 $23,270 APPLICATIONS WITHDRAWN 0 $0 1 $51,360 0 $0 FILES CLOSED FOR INCOMPLETENESS 0 $0 0 $0 0 $0
Aggregated Statistics For Year 1999(Based on 2 partial tracts) B) Conventional C) Refinancings D) Home Improvement Loans F) Non-occupant Loans on Number Average Value Number Average Value Number Average Value Number Average Value
LOANS ORIGINATED 4 $86,705 7 $70,666 2 $11,335 1 $36,600 APPLICATIONS APPROVED, NOT ACCEPTED 0 $0 0 $0 1 $8,090 0 $0 APPLICATIONS DENIED 1 $32,220 1 $72,400 1 $24,130 0 $0 APPLICATIONS WITHDRAWN 0 $0 1 $99,250 0 $0 0 $0 FILES CLOSED FOR INCOMPLETENESS 0 $0 0 $0 0 $0 0 $0
Detailed HMDA statistics for the following Tracts:
0306.01
Private Mortgage Insurance Companies Aggregated Statistics For Year 2009(Based on 2 partial tracts) A) Conventional Number Average Value
LOANS ORIGINATED 1 $111,510 APPLICATIONS APPROVED, NOT ACCEPTED 0 $0 APPLICATIONS DENIED 0 $0 APPLICATIONS WITHDRAWN 0 $0 FILES CLOSED FOR INCOMPLETENESS 0 $0
Aggregated Statistics For Year 2008(Based on 2 partial tracts) A) Conventional Number Average Value
LOANS ORIGINATED 1 $91,220 APPLICATIONS APPROVED, NOT ACCEPTED 0 $0 APPLICATIONS DENIED 0 $0 APPLICATIONS WITHDRAWN 0 $0 FILES CLOSED FOR INCOMPLETENESS 0 $0
Aggregated Statistics For Year 2007(Based on 2 partial tracts) A) Conventional Number Average Value
LOANS ORIGINATED 1 $127,770 APPLICATIONS APPROVED, NOT ACCEPTED 0 $0 APPLICATIONS DENIED 0 $0 APPLICATIONS WITHDRAWN 0 $0 FILES CLOSED FOR INCOMPLETENESS 0 $0
Aggregated Statistics For Year 2006(Based on 2 partial tracts) A) Conventional Number Average Value
LOANS ORIGINATED 1 $112,440 APPLICATIONS APPROVED, NOT ACCEPTED 0 $0 APPLICATIONS DENIED 0 $0 APPLICATIONS WITHDRAWN 0 $0 FILES CLOSED FOR INCOMPLETENESS 0 $0
Aggregated Statistics For Year 2005(Based on 2 partial tracts) A) Conventional Number Average Value
LOANS ORIGINATED 2 $105,465 APPLICATIONS APPROVED, NOT ACCEPTED 0 $0 APPLICATIONS DENIED 0 $0 APPLICATIONS WITHDRAWN 0 $0 FILES CLOSED FOR INCOMPLETENESS 0 $0
Aggregated Statistics For Year 2004(Based on 2 partial tracts) A) Conventional B) Refinancings Number Average Value Number Average Value
LOANS ORIGINATED 1 $115,280 1 $83,220 APPLICATIONS APPROVED, NOT ACCEPTED 0 $0 0 $0 APPLICATIONS DENIED 0 $0 0 $0 APPLICATIONS WITHDRAWN 0 $0 0 $0 FILES CLOSED FOR INCOMPLETENESS 0 $0 0 $0
Aggregated Statistics For Year 2003(Based on 2 partial tracts) A) Conventional B) Refinancings Number Average Value Number Average Value
LOANS ORIGINATED 2 $84,280 2 $105,065 APPLICATIONS APPROVED, NOT ACCEPTED 0 $0 1 $49,910 APPLICATIONS DENIED 0 $0 0 $0 APPLICATIONS WITHDRAWN 0 $0 0 $0 FILES CLOSED FOR INCOMPLETENESS 0 $0 0 $0
Aggregated Statistics For Year 2002(Based on 2 partial tracts) A) Conventional B) Refinancings Number Average Value Number Average Value
LOANS ORIGINATED 1 $161,550 2 $82,525 APPLICATIONS APPROVED, NOT ACCEPTED 0 $0 0 $0 APPLICATIONS DENIED 0 $0 0 $0 APPLICATIONS WITHDRAWN 0 $0 0 $0 FILES CLOSED FOR INCOMPLETENESS 0 $0 0 $0
Aggregated Statistics For Year 2001(Based on 2 partial tracts) A) Conventional B) Refinancings Number Average Value Number Average Value
LOANS ORIGINATED 3 $87,340 1 $127,710 APPLICATIONS APPROVED, NOT ACCEPTED 0 $0 0 $0 APPLICATIONS DENIED 0 $0 0 $0 APPLICATIONS WITHDRAWN 0 $0 0 $0 FILES CLOSED FOR INCOMPLETENESS 0 $0 0 $0
Aggregated Statistics For Year 2000(Based on 2 partial tracts) A) Conventional Number Average Value
LOANS ORIGINATED 1 $92,410 APPLICATIONS APPROVED, NOT ACCEPTED 0 $0 APPLICATIONS DENIED 0 $0 APPLICATIONS WITHDRAWN 0 $0 FILES CLOSED FOR INCOMPLETENESS 0 $0
Aggregated Statistics For Year 1999(Based on 2 partial tracts) A) Conventional Number Average Value
LOANS ORIGINATED 2 $74,950 APPLICATIONS APPROVED, NOT ACCEPTED 0 $0 APPLICATIONS DENIED 0 $0 APPLICATIONS WITHDRAWN 0 $0 FILES CLOSED FOR INCOMPLETENESS 0 $0
Detailed PMIC statistics for the following Tracts:
0306.01
Most common first names in Eureka, IL among deceased individuals Name Count Lived (average)
John 52 79.3 years Mary 52 83.2 years William 33 79.7 years Anna 32 88.1 years Dorothy 28 81.9 years Ruth 26 83.5 years Robert 24 79.7 years Charles 23 77.7 years George 22 79.2 years Esther 21 85.1 years
Most common last names in Eureka, IL among deceased individuals Last name Count Lived (average)
Miller 21 82.1 years Fehr 20 82.1 years Smith 20 82.8 years Leman 19 83.9 years Schertz 18 86.3 years Ulrich 18 85.4 years Wettstein 17 77.7 years Rocke 16 89.0 years Grusy 14 83.7 years Schrock 14 85.8 years
Eureka compared to Illinois state average:
Median household income below state average. Median house value below state average. Unemployed percentage significantly below state average. Black race population percentage significantly below state average. Hispanic race population percentage significantly below state average. Foreign-born population percentage significantly below state average. Institutionalized population percentage above state average.
#29 on the list of "Top 101 cities with the smallest percentage of likely homosexual households (counted as self-reported same-sex unmarried-partner households) (population 5,000+)"
#53 on the list of "Top 101 cities with the largest city-data.com crime index decrease from 2011 to 2012 (population 5,000+)"
#70 on the list of "Top 101 cities with the largest city-data.com crime index decrease from 2002 to 2012 (population 5,000+)"
#76 on the list of "Top 101 cities with largest percentage of females in occupations: food preparation and serving related occupations (population 5,000+)"
#86 (61530) on the list of "Top 101 zip codes with the largest percentage of Swiss first ancestries (pop 5,000+)"
#94 on the list of "Top 101 counties with the largest number of children under 18 without health insurance coverage in 2000"
Top Patent Applicants
Anthony James Grichnik (21)
Jason Stoller (6)
Christopher L. Wynkoop (5)
William N. O'Neill (4)
Jason J. Stoller (4)
Joseph E. Tabor (4)
Kevin D. Ehrenhardt (2)
Trent Ray Meiss (2)
Tracy Leman (2)
Heath A. Toennies (2)
Total of 86 patent applications in 2008-2024.


 Recent articles from our blog. Our writers, many of them Ph.D. graduates or candidates, create easy-to-read articles on a wide variety of topics.

 (17.5 miles
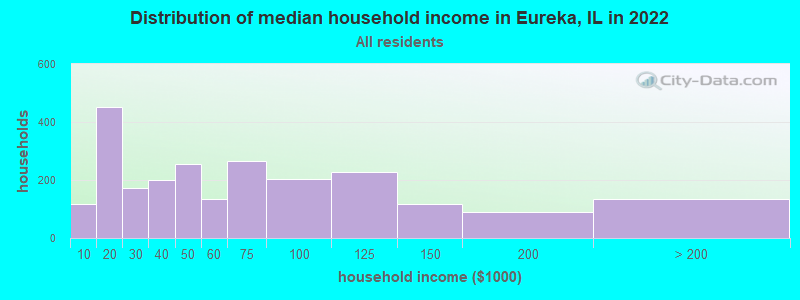


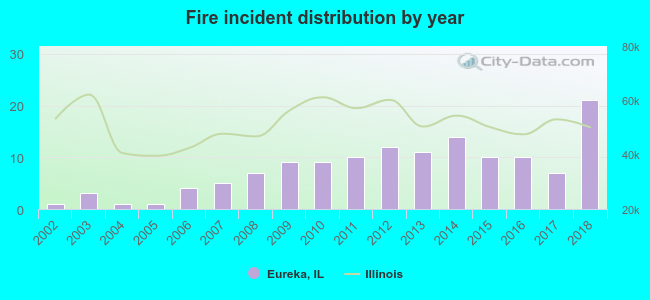 Based on the data from the years 2002 - 2018 the average number of fires per year is 8. The highest number of fire incidents - 21 took place in 2018, and the least - 1 in 2002. The data has an increasing trend.
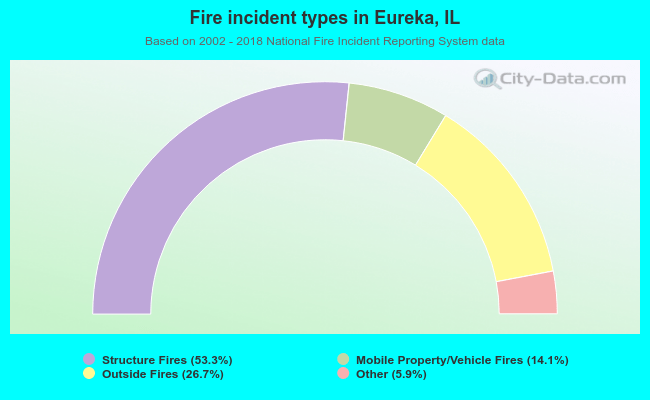 When looking into fire subcategories, the most incidents belonged to: Structure Fires (53.3%), and Outside Fires (26.7%).