Estimated zip code population in 2022: 30,151 Zip code population in 2010: 34,075 Zip code population in 2000: 36,440
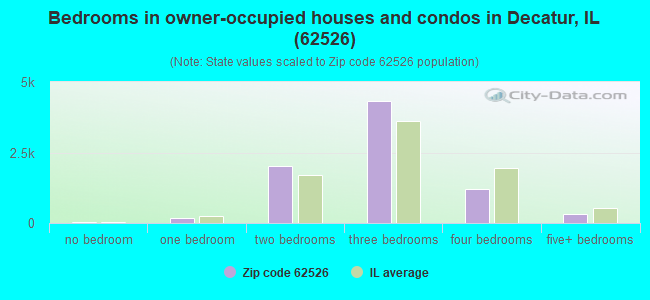
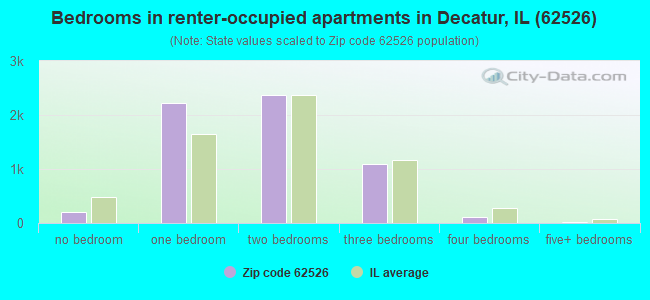
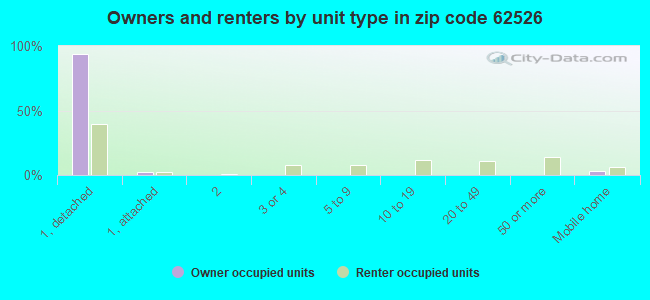
Houses and condos: 16,103 Renter-occupied apartments: 6,030
% of renters here:
43%
State:
33%
March 2022 cost of living index in zip code 62526: 82.5 (low, U.S. average is 100)
Land area: 61.6 sq. mi. Water area: 0.3 sq. mi.
Population density: 489 people per square mile
(low).
OSM Map
General Map
Google Map
MSN Map
OSM Map
General Map
Google Map
MSN Map
OSM Map
General Map
Google Map
MSN Map
OSM Map
General Map
Google Map
MSN Map
Please wait while loading the map...
Real estate property taxes paid for housing units in 2022:
This zip code:
2.0% ($1,980)
Illinois:
2.0% ($4,912)
Median real estate property taxes paid for housing units with mortgages in 2022: $2,082 (2.0%) Median real estate property taxes paid for housing units with no mortgage in 2022: $1,826 (2.0%)
Averages for the 2020 tax year for zip code 62526, filed in 2021:
Average Adjusted Gross Income (AGI) in 2020: $47,092 (Individual Income Tax Returns)
Here:
$47,092
State:
$82,626
Salary/wage: $40,578 (reported on 81.0% of returns)
Here:
$40,578
State:
$66,640
(% of AGI for various income ranges: 1113.6% for AGIs below $25k, 3479.8% for AGIs $25k-50k, 6246.9% for AGIs $50k-75k, 8777.1% for AGIs $75k-100k, 14473.5% for AGIs $100k-200k, 70315.0% for AGIs over 200k)
Taxable interest for individuals: $1,065 (reported on 28.3% of returns)
This zip code:
$1,065
Illinois:
$2,376
(% of AGI for various income ranges: 12.2% for AGIs below $25k, 15.7% for AGIs $25k-50k, 43.5% for AGIs $50k-75k, 65.8% for AGIs $75k-100k, 188.1% for AGIs $100k-200k, 1281.7% for AGIs over 200k)
Ordinary dividends: $5,293 (reported on 13.9% of returns)
Here:
$5,293
State:
$9,061
(% of AGI for various income ranges: 14.1% for AGIs below $25k, 28.3% for AGIs $25k-50k, 86.1% for AGIs $50k-75k, 160.3% for AGIs $75k-100k, 511.2% for AGIs $100k-200k, 4716.7% for AGIs over 200k)
Net capital gain/loss in AGI: +$6,804 (reported on 11.1% of returns)
Here:
+$6,804
State:
+$31,684
(% of AGI for various income ranges: 4.4% for AGIs below $25k, 14.5% for AGIs $25k-50k, 51.5% for AGIs $50k-75k, 119.6% for AGIs $75k-100k, 463.6% for AGIs $100k-200k, 8715.0% for AGIs over 200k)
Profit/loss from business: +$8,324 (reported on 9.7% of returns)
Here:
+$8,324
State:
+$12,175
(% of AGI for various income ranges: 53.2% for AGIs below $25k, 33.4% for AGIs $25k-50k, 65.1% for AGIs $50k-75k, 155.1% for AGIs $75k-100k, 466.5% for AGIs $100k-200k, 4295.0% for AGIs over 200k)
Taxable individual retirement arrangement distribution: $14,272 (reported on 9.3% of returns)
62526:
$14,272
Illinois:
$21,613
(% of AGI for various income ranges: 46.1% for AGIs below $25k, 76.1% for AGIs $25k-50k, 219.1% for AGIs $50k-75k, 350.3% for AGIs $75k-100k, 875.7% for AGIs $100k-200k, 3840.0% for AGIs over 200k)
Self-employed (Keogh) retirement plans: $16,600 (reported on 0.3% of returns)
62526:
$16,600
Illinois:
$30,962
(% of AGI for various income ranges: 92.2% for AGIs $100k-200k)
Total itemized deductions: $31,258 (reported on 3.0% of returns)
Here:
$31,258
State:
$34,948
(% of AGI for various income ranges: 15.1% for AGIs below $25k, 53.5% for AGIs $25k-50k, 155.8% for AGIs $50k-75k, 210.1% for AGIs $75k-100k, 586.0% for AGIs $100k-200k, 4615.0% for AGIs over 200k)
Charity contributions: $13,318 (reported on 2.3% of returns)
Here:
$13,318
State:
$13,122
(% of AGI for various income ranges: 11.1% for AGIs $25k-50k, 42.9% for AGIs $50k-75k, 36.8% for AGIs $75k-100k, 264.9% for AGIs $100k-200k, 2198.3% for AGIs over 200k)
Taxes paid: $6,523 (reported on 3.0% of returns)
62526:
$6,523
State:
$8,563
(% of AGI for various income ranges: 1.9% for AGIs below $25k, 7.6% for AGIs $25k-50k, 29.2% for AGIs $50k-75k, 50.3% for AGIs $75k-100k, 147.6% for AGIs $100k-200k, 948.3% for AGIs over 200k)
Earned income credit: $2,590 (reported on 22.6% of returns)
Here:
$2,590
State:
$2,311
(% of AGI for various income ranges: 127.1% for AGIs below $25k, 80.6% for AGIs $25k-50k, 0.7% for AGIs $50k-75k)
Percentage of individuals using paid preparers for their 2020 taxes: 94.1%
Here:
94%
State:
93%
(% for various income ranges: 94.7% for AGIs below $25k, 93.9% for AGIs $25k-50k, 93.8% for AGIs $50k-75k, 93.0% for AGIs $75k-100k, 93.7% for AGIs $100k-200k, 90.5% for AGIs over 200k)
Averages for the 2012 tax year for zip code 62526, filed in 2013:
Average Adjusted Gross Income (AGI) in 2012: $43,617 (Individual Income Tax Returns)
Here:
$43,617
State:
$68,058
Salary/wage: $37,810 (reported on 82.6% of returns)
Here:
$37,810
State:
$55,396
(% of AGI for various income ranges: 72.6% for AGIs below $25k, 78.6% for AGIs $25k-50k, 74.2% for AGIs $50k-75k, 73.0% for AGIs $75k-100k, 68.4% for AGIs $100k-200k, 57.9% for AGIs over 200k)
Taxable interest for individuals: $1,248 (reported on 31.6% of returns)
This zip code:
$1,248
Illinois:
$1,969
(% of AGI for various income ranges: 1.1% for AGIs below $25k, 0.6% for AGIs $25k-50k, 0.7% for AGIs $50k-75k, 0.9% for AGIs $75k-100k, 0.9% for AGIs $100k-200k, 1.5% for AGIs over 200k)
Ordinary dividends: $3,981 (reported on 16.8% of returns)
Here:
$3,981
State:
$7,786
(% of AGI for various income ranges: 1.1% for AGIs below $25k, 0.8% for AGIs $25k-50k, 0.9% for AGIs $50k-75k, 1.4% for AGIs $75k-100k, 2.0% for AGIs $100k-200k, 3.7% for AGIs over 200k)
Net capital gain/loss in AGI: +$4,074 (reported on 10.8% of returns)
Here:
+$4,074
State:
+$22,183
(% of AGI for various income ranges: 0.2% for AGIs $25k-50k, 0.3% for AGIs $50k-75k, 0.6% for AGIs $75k-100k, 1.2% for AGIs $100k-200k, 5.1% for AGIs over 200k)
Profit/loss from business: +$9,410 (reported on 11.2% of returns)
Here:
+$9,410
State:
+$12,903
(% of AGI for various income ranges: 5.5% for AGIs below $25k, 1.0% for AGIs $25k-50k, 1.3% for AGIs $50k-75k, 1.6% for AGIs $75k-100k, 2.4% for AGIs $100k-200k, 4.4% for AGIs over 200k)
Taxable individual retirement arrangement distribution: $11,187 (reported on 10.8% of returns)
62526:
$11,187
Illinois:
$17,929
(% of AGI for various income ranges: 2.5% for AGIs below $25k, 2.2% for AGIs $25k-50k, 2.4% for AGIs $50k-75k, 2.8% for AGIs $75k-100k, 3.7% for AGIs $100k-200k, 3.1% for AGIs over 200k)
Self-employment retirement plans: $23,425 (reported on 0.3% of returns)
62526:
$23,425
Illinois:
$24,666
Total itemized deductions: $18,853 (20% of AGI, reported on 19.4% of returns)
Here:
$18,853
State:
$26,433
Here:
20.2% of AGI
State:
19.2% of AGI
(% of AGI for various income ranges: 5.5% for AGIs below $25k, 6.4% for AGIs $25k-50k, 8.1% for AGIs $50k-75k, 9.3% for AGIs $75k-100k, 11.2% for AGIs $100k-200k, 9.6% for AGIs over 200k)
Charity contributions: $5,337 (reported on 14.8% of returns)
Here:
$5,337
State:
$4,525
(% of AGI for various income ranges: 0.6% for AGIs below $25k, 1.1% for AGIs $25k-50k, 1.5% for AGIs $50k-75k, 2.0% for AGIs $75k-100k, 2.8% for AGIs $100k-200k, 3.1% for AGIs over 200k)
Taxes paid: $6,951 (reported on 19.4% of returns)
62526:
$6,951
State:
$11,968
(% of AGI for various income ranges: 0.9% for AGIs below $25k, 1.7% for AGIs $25k-50k, 2.6% for AGIs $50k-75k, 3.4% for AGIs $75k-100k, 4.8% for AGIs $100k-200k, 5.3% for AGIs over 200k)
Earned income credit: $2,455 (reported on 24.7% of returns)
Here:
$2,455
State:
$2,349
(% of AGI for various income ranges: 8.7% for AGIs below $25k, 1.1% for AGIs $25k-50k)
Percentage of individuals using paid preparers for their 2012 taxes: 53.7%
Here:
54%
State:
57%
(% for various income ranges: 49.5% for AGIs below $25k, 53.5% for AGIs $25k-50k, 58.4% for AGIs $50k-75k, 59.8% for AGIs $75k-100k, 62.1% for AGIs $100k-200k, 77.8% for AGIs over 200k)
Averages for the 2004 tax year for zip code 62526, filed in 2005:
Average Adjusted Gross Income (AGI) in 2004: $36,546 (Individual Income Tax Returns)
Here:
$36,546
State:
$54,625
Salary/wage: $32,628 (reported on 83.5% of returns)
Here:
$32,628
State:
$46,811
(% of AGI for various income ranges: 80.4% for AGIs below $10k, 72.6% for AGIs $10k-25k, 78.5% for AGIs $25k-50k, 77.9% for AGIs $50k-75k, 77.5% for AGIs $75k-100k, 65.7% for AGIs over 100k)
Taxable interest for individuals: $1,767 (reported on 43.4% of returns)
This zip code:
$1,767
Illinois:
$2,101
(% of AGI for various income ranges: 4.3% for AGIs below $10k, 2.8% for AGIs $10k-25k, 1.7% for AGIs $25k-50k, 1.7% for AGIs $50k-75k, 1.5% for AGIs $75k-100k, 2.6% for AGIs over 100k)
Taxable dividends: $2,405 (reported on 21.7% of returns)
Here:
$2,405
State:
$4,306
(% of AGI for various income ranges: 1.6% for AGIs below $10k, 1.3% for AGIs $10k-25k, 0.9% for AGIs $25k-50k, 1.0% for AGIs $50k-75k, 1.3% for AGIs $75k-100k, 2.5% for AGIs over 100k)
Net capital gain/loss: +$4,378 (reported on 15.2% of returns)
Here:
+$4,378
State:
+$17,321
(% of AGI for various income ranges: -0.5% for AGIs below $10k, 0.3% for AGIs $10k-25k, 0.4% for AGIs $25k-50k, 0.6% for AGIs $50k-75k, 0.9% for AGIs $75k-100k, 6.4% for AGIs over 100k)
Profit/loss from business: +$9,285 (reported on 10.5% of returns)
Here:
+$9,285
State:
+$11,771
(% of AGI for various income ranges: 3.1% for AGIs below $10k, 2.6% for AGIs $10k-25k, 1.7% for AGIs $25k-50k, 1.6% for AGIs $50k-75k, 2.3% for AGIs $75k-100k, 4.9% for AGIs over 100k)
Profit/loss from farming: +$13,833 (reported on 0.4% of returns)
Here:
+$13,833
State:
+$2,327
(% of AGI for various income ranges: 0.0% for AGIs $25k-50k, 0.0% for AGIs $50k-75k, 0.2% for AGIs $75k-100k, 0.5% for AGIs over 100k)
IRA payment deduction: $2,971 (reported on 2.2% of returns)
62526:
$2,971
Illinois:
$3,087
(% of AGI for various income ranges: 0.1% for AGIs below $10k, 0.2% for AGIs $10k-25k, 0.3% for AGIs $25k-50k, 0.2% for AGIs $50k-75k, 0.2% for AGIs $75k-100k, 0.1% for AGIs over 100k)
Self-employed pension: $14,304 (reported on 0.4% of returns)
Here:
$14,304
Illinois:
$16,965
Total itemized deductions: $15,060 (20% of AGI, reported on 20.4% of returns)
Here:
$15,060
State:
$20,239
Here:
20.1% of AGI
State:
19.5% of AGI
(% of AGI for various income ranges: 9.3% for AGIs below $10k, 6.0% for AGIs $10k-25k, 6.7% for AGIs $25k-50k, 8.6% for AGIs $50k-75k, 10.3% for AGIs $75k-100k, 10.1% for AGIs over 100k)
Charity contributions deductions: $4,131 (5% of AGI, reported on 17.0% of returns)
Here:
$4,131
State:
$3,719
Here:
5.2% of AGI
State:
3.4% of AGI
(% of AGI for various income ranges: 0.5% for AGIs below $10k, 0.9% for AGIs $10k-25k, 1.1% for AGIs $25k-50k, 2.0% for AGIs $50k-75k, 2.6% for AGIs $75k-100k, 3.1% for AGIs over 100k)
Total tax: $5,255 (reported on 70.4% of returns)
62526:
$5,255
State:
$9,882
(% of AGI for various income ranges: 1.5% for AGIs below $10k, 3.5% for AGIs $10k-25k, 7.3% for AGIs $25k-50k, 9.6% for AGIs $50k-75k, 11.3% for AGIs $75k-100k, 18.1% for AGIs over 100k)
Earned income credit: $1,890 (reported on 21.3% of returns)
Here:
$1,890
State:
$1,788
Percentage of individuals using paid preparers for their 2004 taxes: 61.1%
Here:
61%
State:
61%
(% for various income ranges: 56.2% for AGIs below $10k, 64.3% for AGIs $10k-25k, 60.9% for AGIs $25k-50k, 62.7% for AGIs $50k-75k, 58.8% for AGIs $75k-100k, 64.4% for AGIs over 100k)
Likely homosexual households (counted as self-reported same-sex unmarried-partner households)
Lesbian couples: 0.2% of all households
Gay men: 0.0% of all households
Household received Food Stamps/SNAP in the past 12 months: 3,606 Household did not receive Food Stamps/SNAP in the past 12 months: 10,757
Women who had a birth in the past 12 months: 509 (233 now married, 277 unmarried) Women who did not have a birth in the past 12 months: 6,607 (1,981 now married, 4,648 unmarried)
Housing units in zip code 62526 with a mortgage: 4,180 (344 second mortgage, 3 home equity loan, 297 both second mortgage and home equity loan) Houses without a mortgage: 262
Median monthly owner costs for units with a mortgage: $1,024 Median monthly owner costs for units without a mortgage: $476
Residents with income below the poverty level in 2022:
This zip code:
18.6%
Whole state:
11.9%
Residents with income below 50% of the poverty level in 2022:
This zip code:
8.5%
Whole state:
5.7%
Median number of rooms in houses and condos:
Here:
6.0
State:
6.4
Median number of rooms in apartments:
Here:
4.0
State:
4.1
Notable locations in this zip code not listed on our city pages
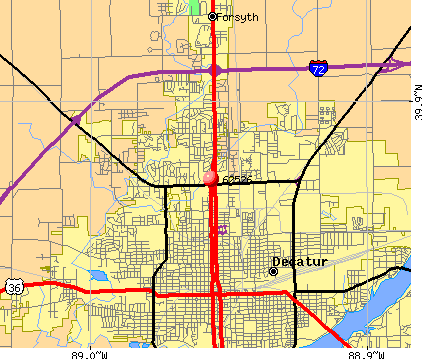
Notable locations in zip code 62526: Greens Switch (A), Saint Joseph Hall (B), Brush College Industrial Park (C), Hickory Point Golf Course (D), Northeast Industrial Park (E), Cresthaven Country Club (F), Decatur Correctional Facility (G), Forsyth Recreation Center (H), Forsyth Village Hall (I), Forsyth Public Library (J), Decatur Ambulance Service Post 1 (K), Decatur Ambulance Service Post 2 (L), Hickory Point Fire Protection District (M), Decatur Fire Department Station 4 (N), Decatur Fire Department Station 5 (O), Decatur Fire Department Station 1 Headquarters (P). Display/hide their locations on the map
Shopping Centers: Spring Creek Plaza Shopping Center (1), Spring Creek Plaza Shopping Center (2), Northland Shopping Center (3), Brettwood Village Shopping Center (4), Moundford Plaza Shopping Center (5), Hickory Point Mall Shopping Center (6), Tollys Mall Shopping Center (7), Pershing Northgate Shopping Center (8). Display/hide their locations on the map
Churches in zip code 62526 include: First Church of the Brethren (A), Forsyth Baptist Church (B), Forsyth United Methodist Church (C). Display/hide their locations on the map
Parks in zip code 62526 include: Sanders Park (1), Boiling Springs Park (2), Fans Field (3), Firestone Football Field (4), Grant Park (5), Village Park (6), East Mound Park (7), Horace B Garman Park (8), Greendell Park (9). Display/hide their locations on the map
2,720 married couples with children.
2,055 single-parent households (308 men, 1,747 women).
94.7% of residents of 62526 zip code speak English at home.
2.5% of residents speak Spanish at home (74% very well, 8% well, 10% not well, 8% not at all).
1.3% of residents speak other Indo-European language at home (91% very well, 7% well, 2% not well).
1.1% of residents speak Asian or Pacific Island language at home (46% very well, 37% well, 12% not well, 5% not at all).
0.2% of residents speak other language at home (90% very well, 10% well).
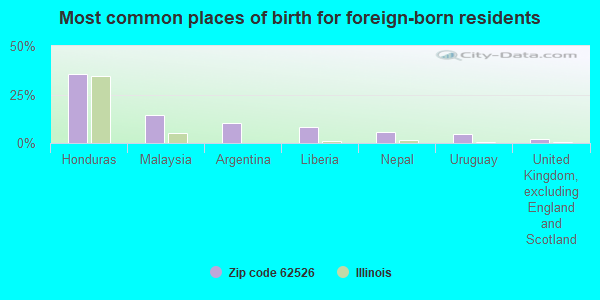
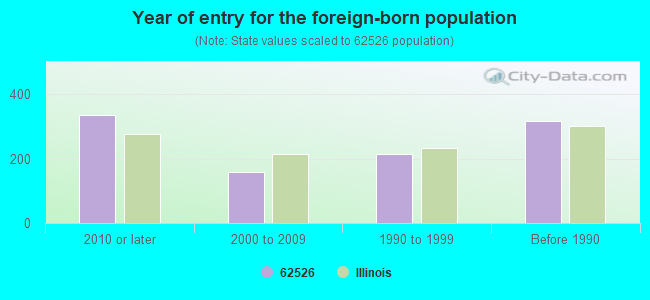
Foreign born population: 927 (3.1%) (35.3% of them are naturalized citizens)
Major facilities with environmental interests located in this zip code:
ARCHER DANIELS MIDLAND CO (3883 FARIES PARKWAY in DECATUR, IL)
STATE MASTER (Illinois EPA Project) - SOLID WASTE PROGRAM, HAZARDOUS WASTE PROGRAM, AIR PROGRAM, National Pollutant Discharge Elimination System Permit AIR MAJOR (AIRS/AFS) - ICIS-05-2001-0710, FORMAL ENFORCEMENT ACTION ENFORCEMENT/COMPLIANCE ACTIVITY (Integrated Compliance Information System) - ICIS-05-2001-1701, FORMAL ENFORCEMENT ACTION (Integrated Compliance Information System) - ICIS-05-2001-1701, FORMAL ENFORCEMENT ACTION COMPLIANCE ACTIVITY (Tracking inspections of insecticide, fungicide, and rodenticide, and toxic substances) CRITERIA AND HAZARDOUS AIR POLLUTANT INVENTORY (Inventory of air pollution sources) National Pollutant Discharge Elimination System NON-MAJOR (Tracking pollutant discharge elimination systems) - permit Small Quantity Generators, between 100 kg and 1000 kg of hazardous waste/month (Resource Conservation and Recovery Act (tracking hazardous waste)) - notification Business SIC classification: FLOUR AND OTHER GRAIN MILL PRODUCTS; SOYBEAN OIL MILLS Business NAICS classification: SOYBEAN PROCESSING.; OTHER OILSEED PROCESSING.; FATS AND OILS REFINING AND BLENDING. Organizations: ADM (CONTACT/OPERATOR)
Alternative names: ADM WEST PLT, ARCHER DANIEL MIDLAND-WEST, ARCHER DANIELS-DECATUR WEST, ARCHER DANIELS MIDLAND company DECATUR WEST PLANT
ARCHER DANIELS MIDLAND CO (3700 E. DIVISION ST. in DECATUR, IL)
STATE MASTER (Illinois EPA Project) - SOLID WASTE PROGRAM, HAZARDOUS WASTE PROGRAM, AIR PROGRAM AIR MAJOR (AIRS/AFS) - ICIS-, ENFORCEMENT/COMPLIANCE ACTIVITY CRITERIA AND HAZARDOUS AIR POLLUTANT INVENTORY (Inventory of air pollution sources) National Pollutant Discharge Elimination System NON-MAJOR (Tracking pollutant discharge elimination systems) - permit HAZARDOUS WASTE BIENNIAL REPORTER (Resource Conservation and Recovery Act (tracking hazardous waste)) Large Quantity Generators, more that 1000 kg of hazardous waste/month (Resource Conservation and Recovery Act (tracking hazardous waste)) - notification Small Quantity Generators, between 100 kg and 1000 kg of hazardous waste/month (Resource Conservation and Recovery Act (tracking hazardous waste)) - notification Business SIC classification: SOYBEAN OIL MILLS; MEDICINAL CHEMICALS AND BOTANICAL PRODUCTS Business NAICS classification: MEDICINAL AND BOTANICAL MANUFACTURING. Organizations: ADM VITAMIN E PLANT (CONTACT/OPERATOR)
, ARCHER DANIELS MIDLAND COMPANY (CONTACT/OWNER)
Alternative names: ARCHER DANIELS MIDLAND VIT E MONOGLYCERIDE PLANT, ARCHER DANIELS MIDLAND VIT E MONOGLYCERIDE PLANT, ARCHER DANIELS-NORTH PLANT
LEIHSER PARKINSON CO (2345 EAST GARFIELD in DECATUR, IL)
STATE MASTER (Illinois EPA Project) - AIR PROGRAM STATE MASTER (Illinois EPA Project) - National Pollutant Discharge Elimination System Permit AIR MINOR (AIRS/AFS) CRITERIA AND HAZARDOUS AIR POLLUTANT INVENTORY (Inventory of air pollution sources) National Pollutant Discharge Elimination System NON-MAJOR (Tracking pollutant discharge elimination systems) - permit Business SIC classification: PETROLEUM BULK STATIONS AND TERMINALS Organizations: LEIHSER-PARKINSON CO. (CONTACT/OWNER)
HSI SYSTEMS INC (2230 BRUSH COLLEGE ROAD in DECATUR, IL)
STATE MASTER (Illinois EPA Project) - SOLID WASTE PROGRAM, HAZARDOUS WASTE PROGRAM, AIR PROGRAM, National Pollutant Discharge Elimination System Permit AIR MINOR (AIRS/AFS) CRITERIA AND HAZARDOUS AIR POLLUTANT INVENTORY (Inventory of air pollution sources) National Pollutant Discharge Elimination System NON-MAJOR (Tracking pollutant discharge elimination systems) - permit Small Quantity Generators, between 100 kg and 1000 kg of hazardous waste/month (Resource Conservation and Recovery Act (tracking hazardous waste)) - notification TRI REPORTER (Tracking of toxic chemicals releasing facilities) Business SIC classification: FARM MACHINERY AND EQUIPMENT Organizations: DEMIRJIAN J GERALD (CONTACT/OWNER)
, H AND S SYSTEMS OF DECATUR INC (CONTACT/OWNER)
Alternative names: AIRFLOAT SYSTEMS, H AND S SYSTEMS OF DECATUR INC
ADM CO (2100 N. JASPER ST. in DECATUR, IL)
STATE MASTER (Illinois EPA Project) - SOLID WASTE PROGRAM, HAZARDOUS WASTE PROGRAM, AIR PROGRAM AIR MINOR (AIRS/AFS) ENFORCEMENT/COMPLIANCE ACTIVITY (Integrated Compliance Information System) National Pollutant Discharge Elimination System NON-MAJOR (Tracking pollutant discharge elimination systems) - permit Small Quantity Generators, between 100 kg and 1000 kg of hazardous waste/month (Resource Conservation and Recovery Act (tracking hazardous waste)) - notification TRI REPORTER (Tracking of toxic chemicals releasing facilities) Business SIC classification: FABRICATED PLATE WORK (BOILER SHOPS) Organizations: ARCHER DANIELS MIDLAND (CONTACT/OWNER)
Alternative names: ADM MASON SHOP MACHANICAL FAB., ADM MASON SHOP MECHANICAL FAB., ADM MECHANICAL, ADM MECHANICAL DIV, ARCHER DANIELS MIDLAND-MECHANI
GRIGOLEIT CO (2000 WOODFORD STREET in DECATUR, IL)
STATE MASTER (Illinois EPA Project) - SOLID WASTE PROGRAM, HAZARDOUS WASTE PROGRAM, AIR PROGRAM AIR MINOR (AIRS/AFS) CRITERIA AND HAZARDOUS AIR POLLUTANT INVENTORY (Inventory of air pollution sources) Large Quantity Generators, more that 1000 kg of hazardous waste/month (Resource Conservation and Recovery Act (tracking hazardous waste)) TRI REPORTER (Tracking of toxic chemicals releasing facilities) Business SIC classification: SIGNS AND ADVERTISING SPECIALTIES Organizations: NA (CONTACT/OWNER)
CLIMATE CONTROL INC (2120 NORTH 22ND STREET in DECATUR, IL)
STATE MASTER (Illinois EPA Project) - SOLID WASTE PROGRAM, AIR PROGRAM, National Pollutant Discharge Elimination System Permit, HAZARDOUS WASTE PROGRAM AIR MAJOR (AIRS/AFS) CRITERIA AND HAZARDOUS AIR POLLUTANT INVENTORY (Inventory of air pollution sources) National Pollutant Discharge Elimination System NON-MAJOR (Tracking pollutant discharge elimination systems) - permit Small Quantity Generators, between 100 kg and 1000 kg of hazardous waste/month (Resource Conservation and Recovery Act (tracking hazardous waste)) - notification TRI REPORTER (Tracking of toxic chemicals releasing facilities) Business SIC classification: AIR-CONDITIONING AND WARM AIR HEATING EQUIPMENT AND COMMERCIAL AND INDUSTRIAL REFRIGERATION EQUIPMENT Organizations: DEMIRJIAN GERALD (CONTACT/OWNER)
Alternative names: CLIMATE CONTROL INC-DECATUR, CLIMATE CONTROL A DIVISION OF DEMIRCO INDUSTRIES LLC, DEMIRCO INDS. L.L.C., T/CCI MANUFACTURING, T/CCI MANUFACTURING, LLC
DECATUR CONSTRUCTION SERVICES INC (2501 N. MARTIN LUTHER KING in DECATUR, IL)
STATE MASTER (Illinois EPA Project) - AIR PROGRAM AIR MINOR (AIRS/AFS) CRITERIA AND HAZARDOUS AIR POLLUTANT INVENTORY (Inventory of air pollution sources) National Pollutant Discharge Elimination System NON-MAJOR (Tracking pollutant discharge elimination systems) - permit Business SIC classification: READY-MIXED CONCRETE Business NAICS classification: READY-MIX CONCRETE MANUFACTURING. Organizations: GROHNE CONCRETE PRODUCTS CO. (CONTACT/OWNER)
Alternative names: GROHNE CONCRETE, GROHNE CONCRETE PRODUCTS CO.
OVERNITE TRANSPORTATION COMPAN (1680 HUBBARD AVE in DECATUR, IL)
STATE MASTER (Illinois EPA Project) - HAZARDOUS WASTE PROGRAM, National Pollutant Discharge Elimination System Permit National Pollutant Discharge Elimination System NON-MAJOR (Tracking pollutant discharge elimination systems) - permit (Resource Conservation and Recovery Act (tracking hazardous waste))
MUELLER CO (1226 E. GARFIELD AVE. in DECATUR, IL)
STATE MASTER (Illinois EPA Project) - SOLID WASTE PROGRAM, HAZARDOUS WASTE PROGRAM, AIR PROGRAM AIR MAJOR (AIRS/AFS) CRITERIA AND HAZARDOUS AIR POLLUTANT INVENTORY (Inventory of air pollution sources) HAZARDOUS WASTE BIENNIAL REPORTER (Resource Conservation and Recovery Act (tracking hazardous waste)) Large Quantity Generators, more that 1000 kg of hazardous waste/month (Resource Conservation and Recovery Act (tracking hazardous waste)) - notification TRI REPORTER (Tracking of toxic chemicals releasing facilities) Business SIC and NAICS classification: COPPER FOUNDRIES Alternative names: MUELLER CO., PLANT #4
CURRY READY MIX OF DECATUR INC (2200 N WOODFORD ST in DECATUR, IL)
STATE MASTER (Illinois EPA Project) - AIR PROGRAM, National Pollutant Discharge Elimination System Permit AIR MINOR (AIRS/AFS) CRITERIA AND HAZARDOUS AIR POLLUTANT INVENTORY (Inventory of air pollution sources) National Pollutant Discharge Elimination System NON-MAJOR (Tracking pollutant discharge elimination systems) - permit Business SIC classification: READY-MIXED CONCRETE Business NAICS classification: READY-MIX CONCRETE MANUFACTURING. Organizations: CURRY READY MIX, INC. (CONTACT/OWNER)
Alternative names: CURRY READY MIX, INC
DECATUR CONCRETE RECYCLING CO (2750 NORTH JASPER STREET in DECATUR, IL)
STATE MASTER (Illinois EPA Project) - AIR PROGRAM AIR MINOR (AIRS/AFS) CRITERIA AND HAZARDOUS AIR POLLUTANT INVENTORY (Inventory of air pollution sources) National Pollutant Discharge Elimination System NON-MAJOR (Tracking pollutant discharge elimination systems) - permit Business SIC classification: CONCRETE PRODUCTS, EXCEPT BLOCK AND BRICK Organizations: MACC OF ILL, INC. (CONTACT/OWNER)
DECATUR WILBERT VAULT CO (945 W ELDORADO ST in DECATUR, IL)
STATE MASTER (Illinois EPA Project) - HAZARDOUS WASTE PROGRAM National Pollutant Discharge Elimination System NON-MAJOR (Tracking pollutant discharge elimination systems) - permit Large Quantity Generators, more that 1000 kg of hazardous waste/month (Resource Conservation and Recovery Act (tracking hazardous waste)) - notification Organizations: DECATUR WILBERT VAULT COMPANY (CONTACT/OWNER)
, BICKES JEFF AND WAYNE (CONTACT/OWNER)
Housing units lacking complete plumbing facilities: 3.3% Housing units lacking complete kitchen facilities: 3.8%
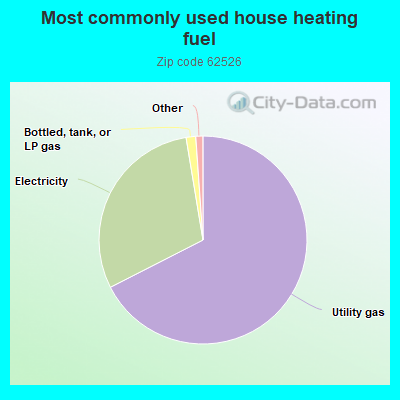
67.5%Utility gas
29.9%Electricity
1.5%Bottled, tank, or LP gas
Population in 1990: 39,674.
Place of birth for U.S.-born residents:
This state: 22,758
Northeast: 301
Midwest: 2,186
South: 3,023
West: 716
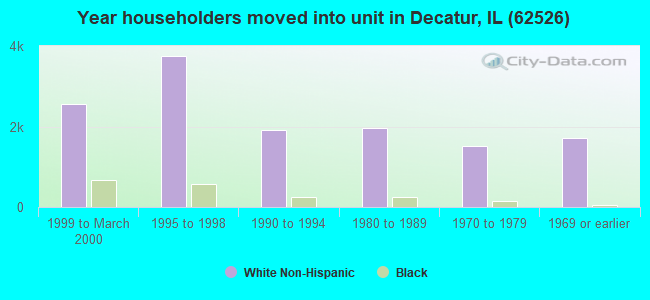
53% of the 62526 zip code residents lived in the same house 5 years ago. Out of people who lived in different houses, 70% lived in this county. Out of people who lived in different counties, 50% lived in Illinois.
87% of the 62526 zip code residents lived in the same house 1 year ago. Out of people who lived in different houses, 56% moved from this county. Out of people who lived in different houses, 27% moved from different county within same state. Out of people who lived in different houses, 16% moved from different state. Out of people who lived in different houses, 1% moved from abroad.
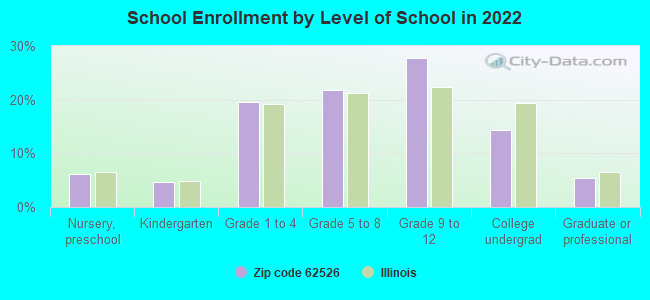
Private vs. public school enrollment:
Students in private schools in grades 1 to 8 (elementary and middle school): 414
Here:
19.1%
Illinois:
13.3%
Students in private schools in grades 9 to 12 (high school): 89
Here:
6.2%
Illinois:
9.9%
Students in private undergraduate colleges: 192
Here:
25.8%
Illinois:
27.4%
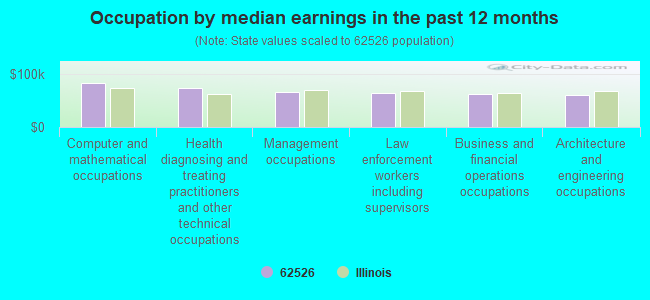
Occupation by median earnings in the past 12 months ($)
83,094Computer and mathematical occupations
73,878Health diagnosing and treating practitioners and other technical occupations
65,821Management occupations
63,568Law enforcement workers including supervisors
61,448Business and financial operations occupations
59,515Architecture and engineering occupations
Companies with federal contracts located in this zip code (DECATUR, IL):
MCSHERRY COMPANY, INC (4705 N BEARSDALE RD; small business) : $53,745 in 11 contractsfrom 2001 to 2006
Contracts for Landscaping/Groundskeeping Services by Navy Signed by year:2000: $0; 2001: $4,700; 2002: $4,172; 2003: $5,159; 2004: $9,651; 2005: $9,374; 2006: $20,689.
Biggest contracts:
$11,525 with Navy for Landscaping/Groundskeeping Services. Signed on 2006-05-01. Completion date: 2011-04-30.
$9,164, same as above.Signed on 2006-03-30. Completion date: 2011-03-30.
$8,751, same as above.Signed on 2004-03-16. Completion date: 2004-03-31.
$5,774, same as above.Signed on 2005-03-23. Completion date: 2004-03-31.
KING-LAR COMPANY (2020 E OLIVE ST) : $45,200 in 2 contractsin 2005
$22,600 with U.S. Army Corps of Engineers - civil program financing only for Air Purification Equipment. Signed on 2005-05-09. Completion date: 2005-09-30.
$22,600 with Army for Air Purification Equipment. Signed on 2005-05-09. Completion date: 2005-09-30.
BINDER PLUMBING & HEATING INC (1975 E PERSHING RD; small business)
$35,235 with Army for Maintenance, Repair or Alteration of Real Property -- Other Non-Building Facilities. Signed on 2001-09-19. Completion date: 2002-01-17.
CONTINENTAL CARBONIC PRODUCTS (2550 N BRUSH COLLEGE RD; small business) : $26,600 in 2 contractsfrom 2004 to 2005
$13,300 with Defense Logistics Agency for Gases: Compressed and Liquefied. Signed on 2005-10-26. Completion date: 2005-10-26.
$13,300 with Defense Logistics Agency for Gases: Compressed and Liquefied. Taking place in MN. Signed on 2004-10-01. Completion date: 2004-10-30.
BLACK, LESLIE (3231 HOLLY DR; small business) : $13,575 in 13 contractsfrom 2003 to 2006
Contracts for Operation of Government-Owned Facilities -- Recreation Facilities (Non-Building) by Army, U.S. Army Corps of Engineers - civil program financing only Signed by year:2000: $0; 2001: $0; 2002: $0; 2003: $2,393; 2004: $4,484; 2005: $4,496; 2006: $2,202.
Biggest contracts:
$2,306 with Army for Operation of Government-Owned Facilities -- Recreation Facilities (Non-Building). Signed on 2005-02-08. Completion date: 2003-03-24.
$2,306 with U.S. Army Corps of Engineers - civil program financing only for Operation of Government-Owned Facilities -- Recreation Facilities (Non-Building). Signed on 2005-02-08. Completion date: 2003-03-24.
$2,300 with Army for Operation of Government-Owned Facilities -- Recreation Facilities (Non-Building). Signed on 2004-01-23. Completion date: 2003-03-24.
$2,300 with U.S. Army Corps of Engineers - civil program financing only for Operation of Government-Owned Facilities -- Recreation Facilities (Non-Building). Signed on 2004-01-23. Completion date: 2003-03-24.
DOVER AVIATION (303 E PERSHING RD; small business)
$5,400 with Defense Logistics Agency for Fans, Air Circulators, and Blower Equipment. Taking place in MD. Signed on 2004-10-08. Completion date: 2005-01-27.
THOMAS, DENNIS (2901 N WATER STE A; small business) : $5,311 in 2 contractsin 2005
$4,263 with Office of Assistant Secretary for Health except national centers (disused code) for Training Aids. Taking place in DC. Signed on 2005-06-21. Completion date: 2005-06-21.
$1,048 with Army for Clothing, Special Purpose. Signed on 2005-09-30. Completion date: 2005-10-21.
300 BELOW INC (2999 E PARKWAY DR)
$2,805 with Army for Vortex Tubes and Other Related Cooling Tubes. Signed on 2005-07-21. Completion date: 2005-07-27.
PERRY DYNAMICS INC (2810 N JASPER ST; small business) : $1,200 in 2 contractsin 2006
$1,200 with Army for Medical and Surgical Instruments, Equipment, and Supplies. Taking place in DC. Signed on 2006-03-17. Completion date: 2006-01-10.
$0, same as above.Signed on 2006-03-17. Completion date: 2006-01-10.
Top industries in this zip code by the number of employees in 2005:
2002 - 2018 National Fire Incident Reporting System (NFIRS) incidents
According to the data from the years 2002 - 2018 the average number of fire incidents per year is 171. The highest number of fire incidents - 207 took place in 2014, and the least - 115 in 2016. The data has a growing trend.
When looking into fire subcategories, the most reports belonged to: Structure Fires (47.4%), and Outside Fires (28.8%).
Fire incident types reported to NFIRS in Zip Code 62526

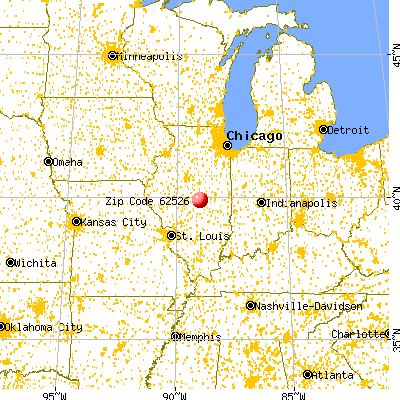


 Nearest zip codes: 62535, 62523, 62522, 62573, 62521, 62554.


 According to the data from the years 2002 - 2018 the average number of fire incidents per year is 171. The highest number of fire incidents - 207 took place in 2014, and the least - 115 in 2016. The data has a growing trend.
 When looking into fire subcategories, the most reports belonged to: Structure Fires (47.4%), and Outside Fires (28.8%).