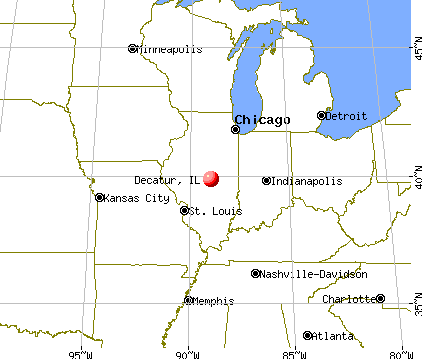
Decatur, Illinois
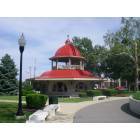
Decatur: The Transfer House - Central Park
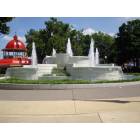
Decatur: Central Park Fountain

Decatur: 12 4 2006 iced tree in Decatur IL
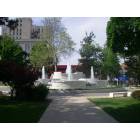
Decatur: Central Park Fountain
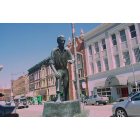
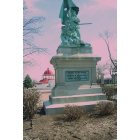
Decatur: Llincoln Statue
Decatur: Macon County Remembers
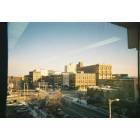
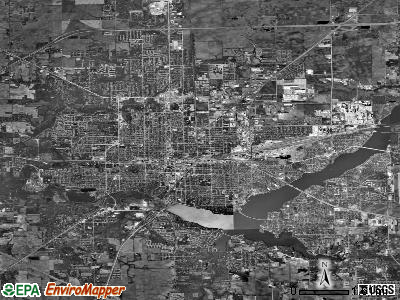
Decatur: Dec 4 2006 View of downtown Decatur IL
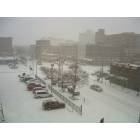
Decatur: Feb 6 07 snowstorm in Decatur IL downtown view from County Building
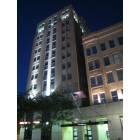
Decatur: The Barnes Citizens Building (left) with the older Citizens Building (c. 1920) on the right.
Decatur: Decatur Lake
Decatur: Downtown Decatur from WAND's towercam
- add
your
Submit your own pictures of this city and show them to the world
- OSM Map
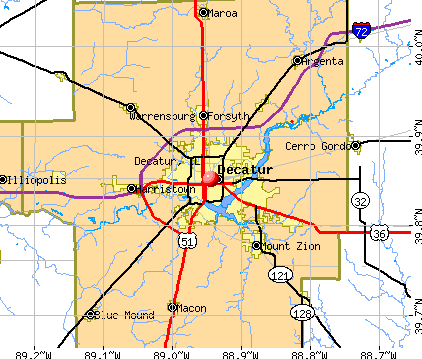
- General Map
- Google Map
- MSN Map
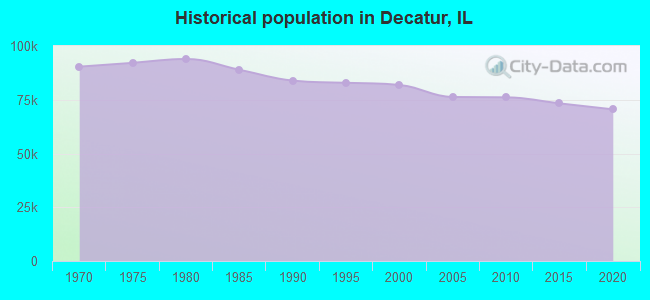
Population change since 2000: -15.6%
 |
| Males: 33,088 | |
| Females: 36,009 |
| Median resident age: | 39.6 years |
| Illinois median age: | 39.1 years |
Zip codes: 62521, 62522, 62523, 62526, 62535, 62554.
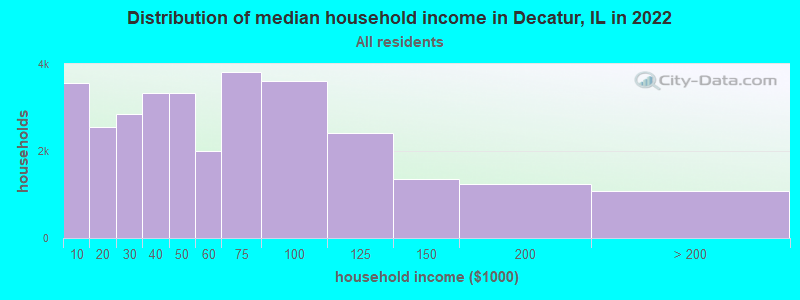
Decatur Zip Code Map| Decatur: | $49,714 |
| IL: | $76,708 |
Estimated per capita income in 2022: $29,824 (it was $19,009 in 2000)
Decatur city income, earnings, and wages data
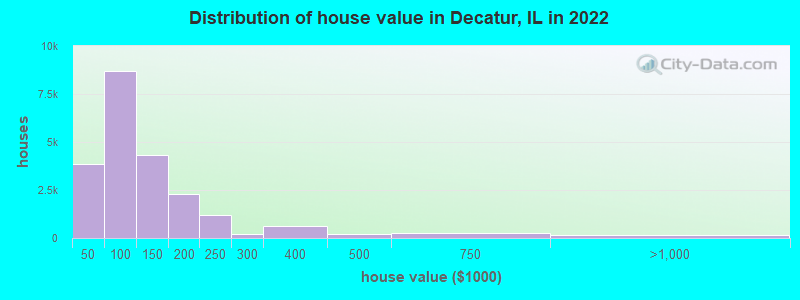
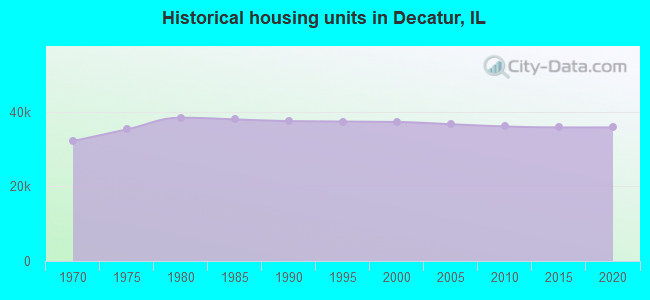
Estimated median house or condo value in 2022: $92,200 (it was $60,600 in 2000)
| Decatur: | $92,200 |
| IL: | $251,600 |
Mean prices in 2022: all housing units: $118,793; detached houses: $120,303; townhouses or other attached units: $178,353; in 2-unit structures: $51,007; in 3-to-4-unit structures: $44,728; in 5-or-more-unit structures: $120,247; mobile homes: $22,334
Median gross rent in 2022: $776.
(15.4% for White Non-Hispanic residents, 33.2% for Black residents, 30.4% for Hispanic or Latino residents, 60.0% for American Indian residents, 5.0% for Native Hawaiian and other Pacific Islander residents, 41.8% for other race residents, 21.3% for two or more races residents)
Detailed information about poverty and poor residents in Decatur, IL


Compare current foreclosures in Decatur, IL:
| Photo | Address | Area | Beds / Baths | Price | Details |
|---|---|---|---|---|---|

|
#1
W Mark Ave
Decatur, IL 62526
|
1,781 sq. feet
|
2 baths 3 beds |
$195,000
|
show details |

|
#2
N University Ave
Decatur, IL 62522
|
- sq. feet
|
1 baths 2 beds |
$13,500
|
show details |

|
#3
E Lake Shore Dr
Decatur, IL 62521
|
- sq. feet
|
1 baths 3 beds |
$34,900
|
show details |

|
#4
W William St
Decatur, IL 62522
|
1,705 sq. feet
|
2 baths 3 beds |
show details | |

|
#5
N Glendale Ave
Decatur, IL 62521
|
1,543 sq. feet
|
1 baths 2 beds |
show details | |

|
#6
W Marietta St
Decatur, IL 62522
|
840 sq. feet
|
1 baths 2 beds |
show details | |

|
#7
W Pershing Rd
Decatur, IL 62526
|
- sq. feet
|
- baths 2 beds |
$35,500
|
show details |

|
#8
N Graceland Ave
Decatur, IL 62526
|
1,400 sq. feet
|
3 baths 3 beds |
show details | |

|
#9
NE Carroll Dr
Decatur, IL 62526
|
1,997 sq. feet
|
2 baths 3 beds |
show details | |

|
#10
Wedgewood Ct
Decatur, IL 62526
|
4,402 sq. feet
|
4 baths 5 beds |
show details |
| Photo | Address | Area | Beds / Baths | Price | Details |
|---|---|---|---|---|---|

|
#11
N Oakland Ave
Decatur, IL 62522
|
1,008 sq. feet
|
1 baths - beds |
show details | |

|
#12
S File Dr
Decatur, IL 62521
|
1,560 sq. feet
|
1 baths - beds |
show details | |

|
#13
N 35th St
Decatur, IL 62521
|
- sq. feet
|
- baths - beds |
show details | |

|
#14
N Martin Luther King Jr Dr Apt 104
Decatur, IL 62526
|
- sq. feet
|
- baths - beds |
show details | |

|
#15
W Decatur St
Decatur, IL 62522
|
- sq. feet
|
- baths - beds |
show details | |

|
#16
W Olive St
Decatur, IL 62526
|
- sq. feet
|
- baths - beds |
show details | |

|
#17
N Woodford St
Decatur, IL 62526
|
- sq. feet
|
- baths - beds |
show details | |

|
#18
N Fairlawn Ave
Decatur, IL 62522
|
- sq. feet
|
- baths - beds |
show details | |

|
#19
N Fairlawn Ave
Decatur, IL 62522
|
- sq. feet
|
- baths - beds |
show details | |

|
#20
E Wood St
Decatur, IL 62521
|
- sq. feet
|
- baths - beds |
show details |
| Photo | Address | Area | Beds / Baths | Price | Details |
|---|---|---|---|---|---|

|
#21
E Main St
Decatur, IL 62521
|
- sq. feet
|
- baths - beds |
show details | |

|
#22
E Pearl St
Decatur, IL 62521
|
- sq. feet
|
- baths - beds |
show details | |

|
#23
N Dennis Ave
Decatur, IL 62526
|
- sq. feet
|
- baths - beds |
show details | |

|
#24
S 19th St
Decatur, IL 62521
|
- sq. feet
|
- baths - beds |
show details | |

|
#25
E Walnut St
Decatur, IL 62526
|
- sq. feet
|
- baths - beds |
show details | |

|
#26
S 22nd St
Decatur, IL 62521
|
- sq. feet
|
- baths - beds |
show details | |

|
#27
N Main C1
Decatur, IL 62523
|
- sq. feet
|
- baths - beds |
show details | |

|
#28
N Main St
Decatur, IL 62523
|
- sq. feet
|
- baths - beds |
show details | |

|
#29
N Water St Apt 8
Decatur, IL 62526
|
- sq. feet
|
- baths - beds |
show details | |

|
#30
N Union St
Decatur, IL 62526
|
- sq. feet
|
- baths - beds |
show details |
| Photo | Address | Area | Beds / Baths | Price | Details |
|---|---|---|---|---|---|

|
#31
E William St
Decatur, IL 62521
|
- sq. feet
|
- baths - beds |
show details | |

|
#32
S Haworth Ave
Decatur, IL 62522
|
- sq. feet
|
- baths - beds |
show details | |

|
#33
W Packard St
Decatur, IL 62521
|
- sq. feet
|
- baths - beds |
show details | |

|
#34
W Green St
Decatur, IL 62522
|
- sq. feet
|
- baths - beds |
show details | |

|
#35
W Leafland Ave
Decatur, IL 62522
|
- sq. feet
|
- baths - beds |
show details | |

|
#36
N Monroe St
Decatur, IL 62522
|
- sq. feet
|
- baths - beds |
show details | |

|
#37
N University Ave
Decatur, IL 62526
|
- sq. feet
|
- baths - beds |
show details | |

|
#38
N Northhaven Ct Apt 2f
Decatur, IL 62526
|
- sq. feet
|
- baths - beds |
show details | |

|
#39
W Hickory Point Rd Apt 4
Decatur, IL 62526
|
- sq. feet
|
- baths - beds |
show details | |

|
#40
Hummingbird Dr
Decatur, IL 62526
|
- sq. feet
|
- baths - beds |
show details |
| Photo | Address | Area | Beds / Baths | Price | Details |
|---|---|---|---|---|---|

|
#41
W Macon St
Decatur, IL 62522
|
- sq. feet
|
- baths - beds |
show details | |

|
#42
W Marietta St
Decatur, IL 62521
|
- sq. feet
|
- baths - beds |
show details | |

|
#43
5th Dr
Decatur, IL 62521
|
- sq. feet
|
- baths - beds |
show details | |

|
#44
E Division St
Decatur, IL 62526
|
- sq. feet
|
- baths - beds |
show details | |

|
#45
E Lincoln Ave
Decatur, IL 62521
|
- sq. feet
|
- baths - beds |
show details | |

|
#46
N Church St
Decatur, IL 62526
|
- sq. feet
|
- baths - beds |
show details | |

|
#47
W Cerro Gordo St
Decatur, IL 62522
|
- sq. feet
|
- baths - beds |
show details | |

|
#48
N Union St
Decatur, IL 62526
|
- sq. feet
|
- baths - beds |
show details | |

|
#49
W Cushing St
Decatur, IL 62526
|
- sq. feet
|
- baths - beds |
show details | |

|
Check over 1 million property listings on Foreclosure.com!
|
browse all offers | |||


- 46,31165.8%White alone
- 16,45623.4%Black alone
- 4,3066.1%Two or more races
- 2,3683.4%Hispanic
- 6721.0%Asian alone
- 2830.4%Other race alone

Races in Decatur detailed stats: ancestries, foreign born residents, place of birth
According to our research of Illinois and other state lists, there were 329 registered sex offenders living in Decatur, Illinois as of April 26, 2024.
The ratio of all residents to sex offenders in Decatur is 224 to 1.
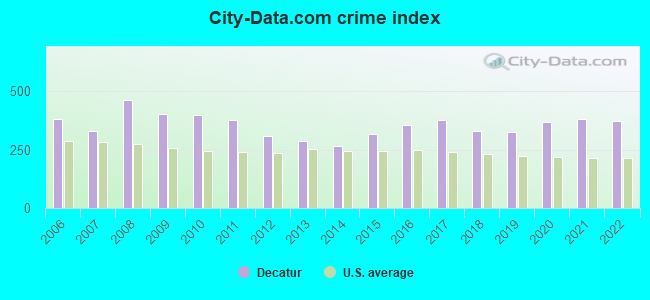
The City-Data.com crime index weighs serious crimes and violent crimes more heavily. Higher means more crime, U.S. average is 246.1. It adjusts for the number of visitors and daily workers commuting into cities.
- means the value is smaller than the state average.- means the value is about the same as the state average.
- means the value is bigger than the state average.
- means the value is much bigger than the state average.
Crime rate in Decatur detailed stats: murders, rapes, robberies, assaults, burglaries, thefts, arson
Full-time law enforcement employees in 2021, including police officers: 149 (138 officers - 124 male; 14 female).
| Officers per 1,000 residents here: | 1.99 |
| Illinois average: | 2.84 |
 Recent articles from our blog. Our writers, many of them Ph.D. graduates or candidates, create easy-to-read articles on a wide variety of topics.

 | If Chicago was removed, would Illinois be a red or purple state? (44 replies) |
| Do any other non-Chicagoans hate being call "down staters"? (21 replies) |
| Chicago comes in Twos (48 replies) |
| Illinois......are you staying or leaving? (277 replies) |
| Finally, some good news about the State (42 replies) |
| Decatur, IL (3 replies) |
Latest news from Decatur, IL collected exclusively by city-data.com from local newspapers, TV, and radio stations
Ancestries: German (12.6%), American (11.6%), English (8.6%), Irish (5.3%), European (1.5%), Italian (1.3%).
Current Local Time: CST time zone
Incorporated on 05/03/1881
Elevation: 670 feet
Land area: 41.6 square miles.
Population density: 1,663 people per square mile (low).
1,932 residents are foreign born (1.0% Latin America, 1.0% Asia, 0.4% Africa).
| This city: | 2.8% |
| Illinois: | 14.1% |
Median real estate property taxes paid for housing units with mortgages in 2022: $2,353 (2.4%)
Median real estate property taxes paid for housing units with no mortgage in 2022: $1,773 (2.1%)
Nearest city with pop. 200,000+: St. Louis, MO  (109.6 miles , pop. 348,189).
Nearest city with pop. 1,000,000+: Chicago, IL (152.7 miles , pop. 2,896,016).
Nearest cities:
), ), ), ), ), )Latitude: 39.85 N, Longitude: 88.94 W
Daytime population change due to commuting: +10,349 (+14.7%)
Workers who live and work in this city: 23,623 (81.2%)
Area code: 217
Decatur tourist attractions:
Decatur, Illinois accommodation & food services, waste management - Economy and Business Data
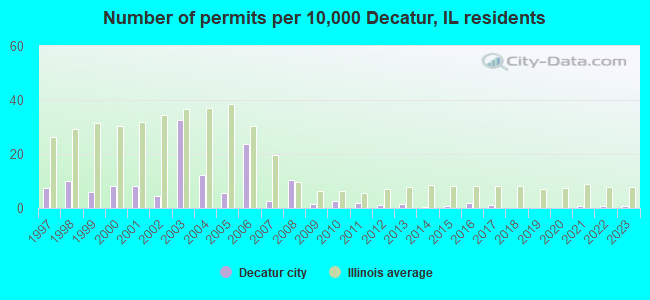
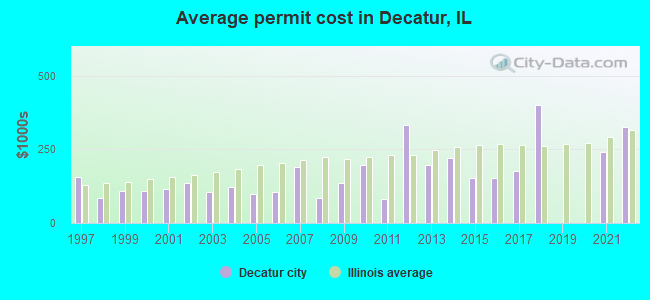
Single-family new house construction building permits:
- 2022: 5 buildings, average cost: $324,500
- 2021: 6 buildings, average cost: $240,900
- 2018: 1 building, cost: $400,000
- 2017: 8 buildings, average cost: $175,500
- 2016: 15 buildings, average cost: $151,000
- 2015: 6 buildings, average cost: $153,300
- 2014: 2 buildings, average cost: $220,300
- 2013: 13 buildings, average cost: $194,900
- 2012: 9 buildings, average cost: $331,400
- 2011: 16 buildings, average cost: $81,700
- 2010: 20 buildings, average cost: $195,400
- 2009: 13 buildings, average cost: $134,600
- 2008: 86 buildings, average cost: $85,000
- 2007: 22 buildings, average cost: $188,800
- 2006: 195 buildings, average cost: $103,600
- 2005: 47 buildings, average cost: $99,900
- 2004: 101 buildings, average cost: $122,500
- 2003: 268 buildings, average cost: $105,700
- 2002: 35 buildings, average cost: $135,900
- 2001: 68 buildings, average cost: $114,800
- 2000: 68 buildings, average cost: $109,000
- 1999: 48 buildings, average cost: $107,400
- 1998: 82 buildings, average cost: $86,200
- 1997: 62 buildings, average cost: $154,700
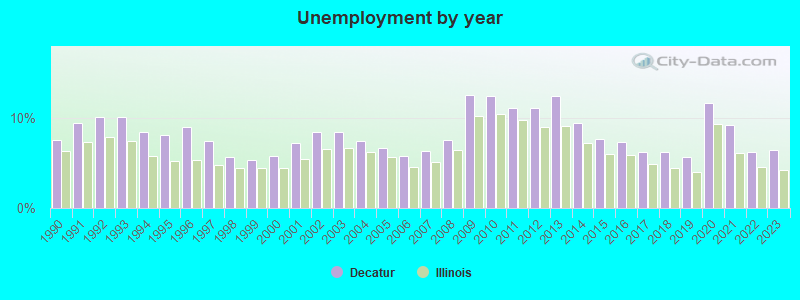
| Here: | 6.5% |
| Illinois: | 4.2% |
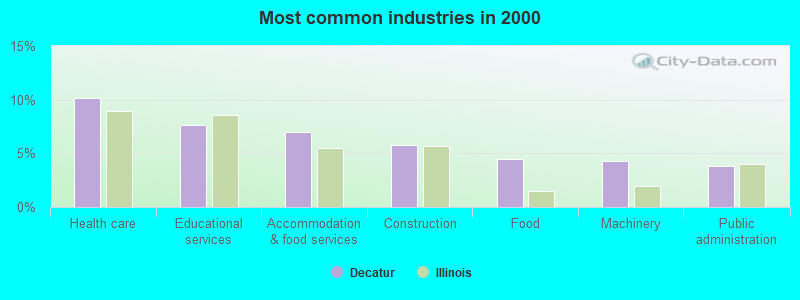
- Health care (10.2%)
- Educational services (7.6%)
- Accommodation & food services (7.0%)
- Construction (5.8%)
- Food (4.5%)
- Machinery (4.3%)
- Public administration (3.8%)
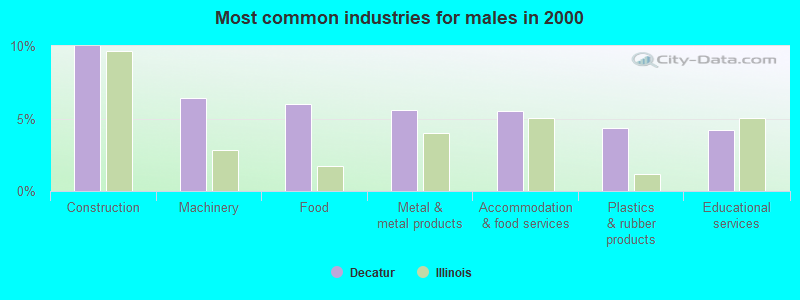
- Construction (10.0%)
- Machinery (6.4%)
- Food (6.0%)
- Metal & metal products (5.6%)
- Accommodation & food services (5.5%)
- Plastics & rubber products (4.3%)
- Educational services (4.2%)
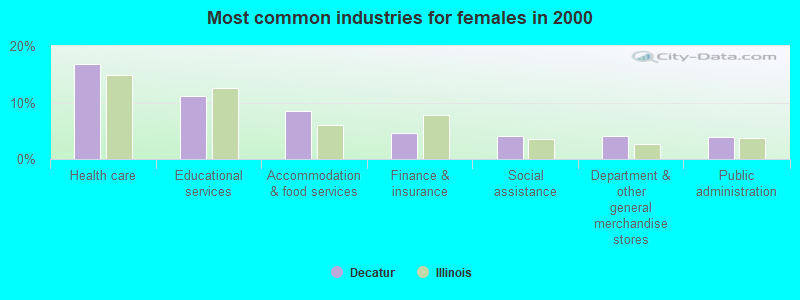
- Health care (16.9%)
- Educational services (11.1%)
- Accommodation & food services (8.5%)
- Finance & insurance (4.6%)
- Social assistance (4.1%)
- Department & other general merchandise stores (4.1%)
- Public administration (4.0%)
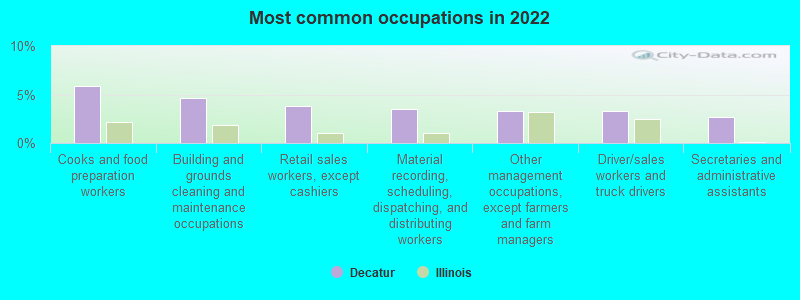
- Cooks and food preparation workers (5.9%)
- Building and grounds cleaning and maintenance occupations (4.6%)
- Retail sales workers, except cashiers (3.8%)
- Material recording, scheduling, dispatching, and distributing workers (3.5%)
- Other management occupations, except farmers and farm managers (3.3%)
- Driver/sales workers and truck drivers (3.3%)
- Secretaries and administrative assistants (2.7%)
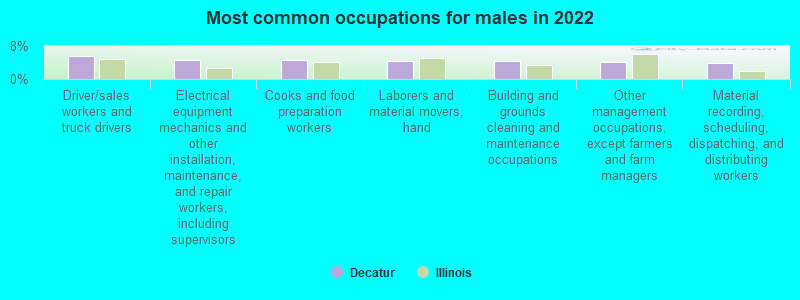
- Driver/sales workers and truck drivers (5.5%)
- Electrical equipment mechanics and other installation, maintenance, and repair workers, including supervisors (4.7%)
- Cooks and food preparation workers (4.6%)
- Laborers and material movers, hand (4.4%)
- Building and grounds cleaning and maintenance occupations (4.3%)
- Other management occupations, except farmers and farm managers (4.1%)
- Material recording, scheduling, dispatching, and distributing workers (3.8%)
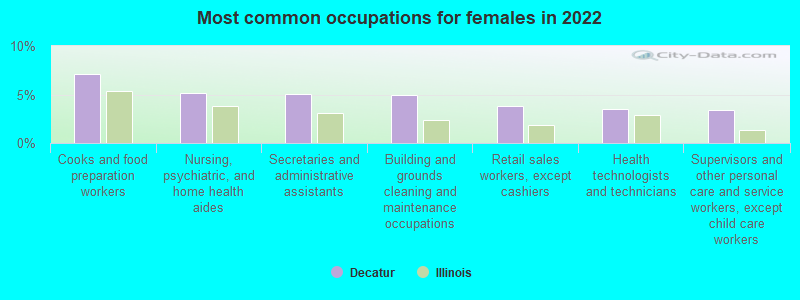
- Cooks and food preparation workers (7.1%)
- Nursing, psychiatric, and home health aides (5.1%)
- Secretaries and administrative assistants (5.1%)
- Building and grounds cleaning and maintenance occupations (5.0%)
- Retail sales workers, except cashiers (3.8%)
- Health technologists and technicians (3.5%)
- Supervisors and other personal care and service workers, except child care workers (3.4%)
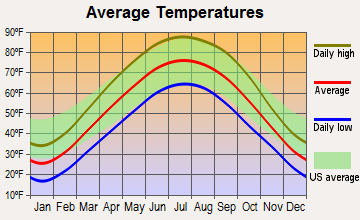
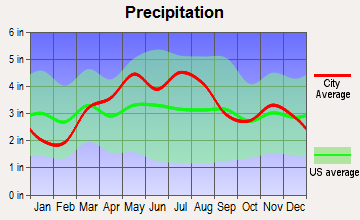
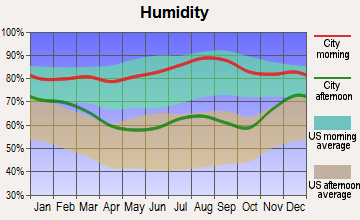
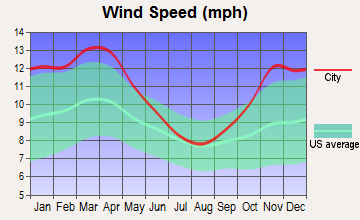
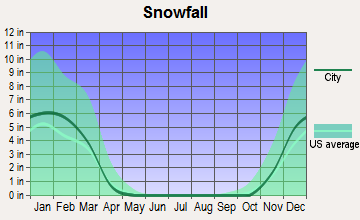
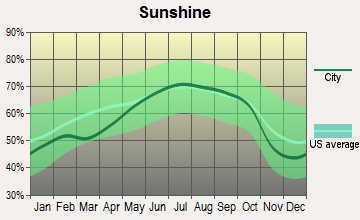
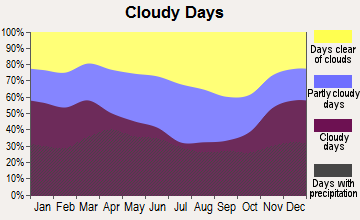
Average climate in Decatur, Illinois
Based on data reported by over 4,000 weather stations
|
|


(lower is better)
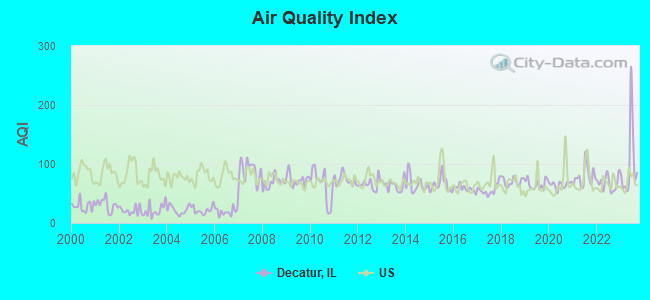
Air Quality Index (AQI) level in 2023 was 100. This is worse than average.
| City: | 100 |
| U.S.: | 73 |
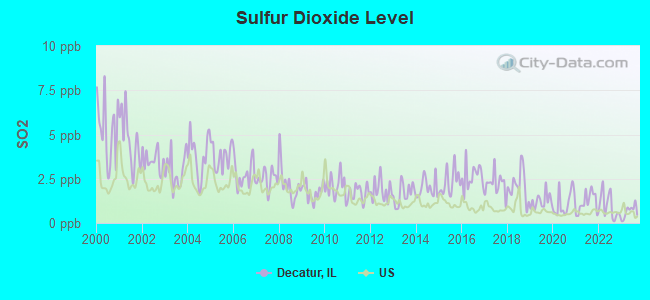
Sulfur Dioxide (SO2) [ppb] level in 2023 was 0.647. This is significantly better than average. Closest monitor was 0.9 miles away from the city center.
| City: | 0.647 |
| U.S.: | 1.515 |
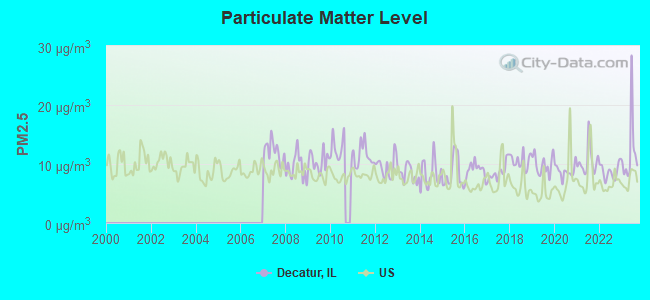
Particulate Matter (PM2.5) [µg/m3] level in 2023 was 11.9. This is significantly worse than average. Closest monitor was 1.4 miles away from the city center.
| City: | 11.9 |
| U.S.: | 8.1 |
Tornado activity:
Decatur-area historical tornado activity is slightly above Illinois state average. It is 89% greater than the overall U.S. average.
On 3/20/1976, a category F4 (max. wind speeds 207-260 mph) tornado 8.5 miles away from the Decatur city center injured 18 people and caused between $500,000 and $5,000,000 in damages.
On 4/19/1996, a category F3 (max. wind speeds 158-206 mph) tornado 2.3 miles away from the city center injured 29 people and caused $9 million in damages.
Earthquake activity:
Decatur-area historical earthquake activity is significantly above Illinois state average. It is 181% greater than the overall U.S. average.On 4/18/2008 at 09:36:59, a magnitude 5.4 (5.1 MB, 4.8 MS, 5.4 MW, 5.2 MW, Class: Moderate, Intensity: VI - VII) earthquake occurred 112.2 miles away from the city center
On 4/18/2008 at 09:36:59, a magnitude 5.2 (5.2 MW, Depth: 8.9 mi) earthquake occurred 112.2 miles away from Decatur center
On 6/10/1987 at 23:48:54, a magnitude 5.1 (4.9 MB, 4.4 MS, 4.6 MS, 5.1 LG) earthquake occurred 91.1 miles away from the city center
On 6/18/2002 at 17:37:15, a magnitude 5.0 (4.3 MB, 4.6 MW, 5.0 LG) earthquake occurred 143.4 miles away from the city center
On 4/18/2008 at 15:14:16, a magnitude 4.8 (4.5 MB, 4.8 MW, 4.6 MW, Class: Light, Intensity: IV - V) earthquake occurred 111.9 miles away from the city center
On 4/3/1974 at 23:05:02, a magnitude 4.7 (4.5 MB, 4.7 LG) earthquake occurred 98.3 miles away from Decatur center
Magnitude types: regional Lg-wave magnitude (LG), body-wave magnitude (MB), surface-wave magnitude (MS), moment magnitude (MW)
Natural disasters:
The number of natural disasters in Macon County (9) is smaller than the US average (15).Major Disasters (Presidential) Declared: 6
Emergencies Declared: 2
Causes of natural disasters: Storms: 5, Floods: 3, Tornadoes: 3, Hurricane: 1, Snow: 1, Winter Storm: 1, Other: 1 (Note: some incidents may be assigned to more than one category).
Main business address for: ILLINOIS POWER CO (ELECTRIC & OTHER SERVICES COMBINED), ARCHER DANIELS MIDLAND CO (FATS & OILS).
Hospitals in Decatur:
- BEACON STREET PLACE (4838 BEACON DRIVE)
- DECATUR MEMORIAL HOSPITAL (Voluntary non-profit - Other, provides emergency services, 2300 NORTH EDWARD STREET)
- DMH HOME HEALTH SERVICES HOSPICE (2300 N EDWARD ST GEN SERV BLDG)
- EAST SIDE TERRACE (3850 EAST FULTON)
- FORTY-FOURTH STREET PLACE (1479 SOUTH 44TH STREET)
- HICKORY STREET PLACE (3905 EAST HICKORY STREET)
- JAMES R THOMPSON HOUSE (805 EAST JOHNS STREET)
- SOUTHSIDE MANOR (729 SOUTH WEBSTER)
- SPRING CREEK TERRACE (3155 EAST MOUND ROAD)
- ST MARYS HOSPITAL (Voluntary non-profit - Private, 1800 E LAKE SHORE DR)
- VNA HOSPICE (3122 BRETTWOOD CIRCLE)
Airports and heliports located in Decatur:
- Decatur Airport (DEC) (Runways: 3, Commercial Ops: 2, Air Taxi Ops: 3,902, Itinerant Ops: 11,382, Local Ops: 17,026, Military Ops: 10,367)
- Decatur Conference Center And Hotel Heliport (49LL)
- Decatur Memorial Hospital Heliport (8IS6)
- Refreshment Services Inc Heliport (9LL8)
- St Mary's Hospital - Decatur Heliport (9IS3)
Colleges/Universities in Decatur:
- Richland Community College (Full-time enrollment: 2,434; Location: One College Pk; Public; Website: www.richland.edu)
- Millikin University (Full-time enrollment: 2,419; Location: 1184 W Main St; Private, not-for-profit; Website: www.millikin.edu; Offers Doctor's degree)
- Mr John's School of Cosmetology Esthetics & Nails-Decatur (Full-time enrollment: 98; Location: 1745 E Eldorado St.; Private, for-profit; Website: www.mrjohns.com)
- Shear Learning Academy of Cosmetology (Full-time enrollment: 38; Location: 241 North Main Street; Private, for-profit; Website: www.shearlearning.com)
Other colleges/universities with over 2000 students near Decatur:
- Lincoln Land Community College (about 37 miles; Springfield, IL; Full-time enrollment: 5,460)
- University of Illinois at Springfield (about 37 miles; Springfield, IL; FT enrollment: 3,748)
- Parkland College (about 40 miles; Champaign, IL; FT enrollment: 7,326)
- Lake Land College (about 42 miles; Mattoon, IL; FT enrollment: 7,499)
- University of Illinois at Urbana-Champaign (about 42 miles; Champaign, IL; FT enrollment: 47,528)
- Illinois Wesleyan University (about 45 miles; Bloomington, IL; FT enrollment: 2,323)
- Illinois State University (about 46 miles; Normal, IL; FT enrollment: 18,804)
Public high schools in Decatur:
- MACARTHUR HIGH SCHOOL (Students: 1,261, Location: 1 EDUCATIONAL PARK, Grades: 9-12)
- EISENHOWER HIGH SCHOOL (Students: 1,222, Location: 1200 S 16TH ST, Grades: 9-12)
- FUTURES UNLIMITED (Students: 128, Location: 250 E WILLIAM ST, Grades: 9-12)
- PHOENIX ENRICHMENT CENTER (Students: 52, Location: 1900 E CLEVELAND AVE, Grades: 7-12)
- MILLIGAN ACADEMY RSSP (Students: 23, Location: 432 N WATER ST, Grades: 7-11)
- ST MARYS ADOLESCENT ED PROGRAM (Location: 1800 E LAKE SHORE DR, Grades: 1-11)
Private high schools in Decatur:
Biggest public elementary/middle schools in Decatur:
- THOMAS JEFFERSON MIDDLE SCHOOL (Students: 550, Location: 4735 E CANTRELL ST, Grades: 7-8)
- JOHNS HILL MAGNET SCHOOL (Students: 511, Location: 1025 E JOHNS AVE, Grades: KG-8)
- STEPHEN DECATUR MIDDLE SCHOOL (Students: 496, Location: 300 E ELDORADO ST, Grades: 7-8)
- HOPE ACADEMY (Students: 441, Location: 955 N ILLINOIS ST, Grades: PK-8)
- GARFIELD MONTESSORI SCHOOL (Students: 365, Location: 300 MEADOW TERRACE PL, Grades: PK-8)
- SOUTH SHORES ELEM SCHOOL (Students: 364, Location: 2500 S FRANKLIN STREET RD, Grades: KG-6)
- MICHAEL E BAUM ELEM SCHOOL (Students: 362, Location: 801 S LAKE RIDGE AVE, Grades: PK-6)
- MARY W FRENCH ACADEMY (Students: 360, Location: 520 W WOOD ST, Grades: KG-6)
- MUFFLEY ELEM SCHOOL (Students: 360, Location: 88 S COUNTRY CLUB RD, Grades: PK-6)
- PARSONS ACCELERATED SCHOOL (Students: 305, Location: 3591 N MACARTHUR RD, Grades: KG-6)
Private elementary/middle schools in Decatur:
- HOLY FAMILY CATHOLIC SCHOOL (Students: 252, Location: 2400 S FRANKLIN STREET RD, Grades: PK-8)
- OUR LADY OF LOURDES SCHOOL (Students: 233, Location: 3950 LOURDES DR, Grades: PK-8)
- ST PATRICK SCHOOL (Students: 176, Location: 412 N JACKSON ST, Grades: PK-8)
- ANTIOCH CHRISTIAN ACADEMY (Students: 40, Location: 3475 N MAPLE AVE, Grades: PK-6)
Library in Decatur:
- DECATUR PUBLIC LIBRARY (Operating income: $3,934,338; Location: 130 NORTH FRANKLIN STREET; 304,733 books; 9,739 audio materials; 14,103 video materials; 25 local licensed databases; 18 state licensed databases; 1 other licensed databases; 602 print serial subscriptions; 3 electronic serial subscriptions)
User-submitted facts and corrections:
- The University of Illinois at Urban-Champaign is within 50 miles of Decatur. It is a major research institution with i6 colleges and over 40,000 student. The Library has the largest public university collection in the world.
- Mound Middle School and Washington Grade School have closed added by Robyn
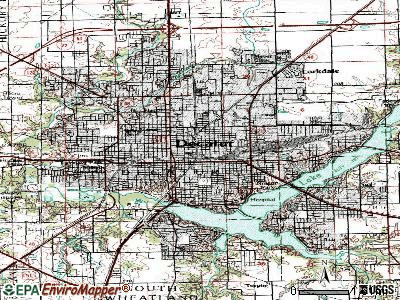
Points of interest:
Notable locations in Decatur: Greens Switch (A), Virginia Anderson Girl Scout Camp (B), Robert Faries Boy Scout Camp (C), Decatur Industry Technology Center (D), Saint Joseph Hall (E), Decatur City Water Works (F), Brush College Industrial Park (G), Hickory Point Golf Course (H), Northeast Industrial Park (I), Moose Country Club (J), Airport Industrial Park (K), Elks Country Club (L), South Side Country Club (M), Scovill Municipal Golf Course (N), Decatur Country Club (O), Cresthaven Country Club (P), Alston Hall (Q), Blackburn Hall (R), Decatur Indoor Sports Center (S), Gorin Hall (T). Display/hide their locations on the map
Shopping Centers: South Towne Shopping Center (1), South Shores Shopping Center (2), Airport Plaza Shopping Center (3), Spring Creek Plaza Shopping Center (4), Spring Creek Plaza Shopping Center (5), Northland Shopping Center (6), Brettwood Village Shopping Center (7), Moundford Plaza Shopping Center (8), Pines Shopping Center (9). Display/hide their locations on the map
Main business address in Decatur include: ILLINOIS POWER CO (A), ARCHER DANIELS MIDLAND CO (B). Display/hide their locations on the map
Churches in Decatur include: Faith Baptist Church (A), Piling Chapel (B), First United Methodist Church (C), Grace United Methodist Church (D), Third United Methodist Church (E), Antioch Missionary Baptist Church (F), Baptist Bible Church (G), Central Christian Church (H), Central Church of God (I). Display/hide their locations on the map
Cemeteries: North Fork Cemetery (1), Calvary Cemetery (2), Saint Johns Lutheran Cemetery (3), Walnut Grove Cemetery (4), Wheeler Cemetery (5), Sharon Cemetery (6), Greenwood Cemetery (7). Display/hide their locations on the map
Lakes and reservoirs: Shady Lake (A), A E Staley Cooling Lake (B), Lake Decatur (C). Display/hide their locations on the map
Creeks: Long Creek (A), Stevens Creek (B), Finley Creek (C). Display/hide their locations on the map
Parks in Decatur include: Sanders Park (1), Frank M Lindsay Field (2), Fans Field (3), Firestone Football Field (4), Grant Park (5), Mueller Park (6), Bois Du Sangamon Nature Preserve (7), Scovill Gardens (8), Big Creek Park (9). Display/hide their locations on the map
Tourist attractions: Children's Museum of Illinois (55 South Country Club Road) (1), Decatur Genealogical Society (Cultural Attractions- Events- & Facilities; 1255 West South Side Drive) (2), AirWalk Action and Adventure (Arcades & Amusements; 1660 North Folk Street) (3), Franklin Travel Services (Tours & Charters; 304 South Franklin Street Suite 8) (4). Display/hide their approximate locations on the map
Hotels: Best Value Inn & Suites (450 East Pershing Road) (1), Cardwell & Randall Hospitality Services (4191 West US Highway 36) (2), Baymont Inn & Suites - Decatur (5100 Hickory Point Frontage Rd) (3), Best Western (450 E Pershing Rd) (4), Country Inn-Suites Decatur (5150 Hickory Point Frontage Road) (5), Decatur Inn (3035 North Water Street) (6), Baymont Inn (5100 Hickory Point Road) (7), Hawthorn Suites Limited (2370 South Mount Zion Road) (8), Holiday Inn of Decatur (4191 West US Highway 36) (9). Display/hide their approximate locations on the map
Courts: Federal Bureau Of Investigation (132 South Water Street) (1), Macon County - Probation & Court Services (253 East Wood Street) (2). Display/hide their approximate locations on the map
Birthplace of: Alison Krauss - Musical artist, Hugh Myers - Chess player, Gary Noffke - Artist, Al Ater - Politician, Chuck Dressen - Baseball player, Luke Harangody - Basketball player, Dante Ridgeway - 2005 NFL player (New York Jets, born: Apr 18, 1984), Emitt Rhodes - Multi-instrumentalist, James Whitley - 2005 NFL player (Carolina Panthers, born: May 13, 1979), James Whitley (American football) - Football player.
Drinking water stations with addresses in Decatur and their reported violations in the past:
RENDEZVOUS TAVERN (Population served: 100, Groundwater):Past health violations:TERRIS POUR HOUSE (Population served: 70, Groundwater):Past monitoring violations:
- MCL, Monthly (TCR) - Between JAN-2007 and DEC-2007, Contaminant: Coliform. Follow-up actions: St Site Visit (enforcement) (JUL-26-2007), St Compliance achieved (AUG-01-2007)
- One routine major monitoring violation
- One regular monitoring violation
Past monitoring violations:KOPETZ MANUFACTURING INC (Population served: 53, Groundwater):
- One regular monitoring violation
Past monitoring violations:
- One routine major monitoring violation
| This city: | 2.2 people |
| Illinois: | 2.6 people |
| This city: | 58.7% |
| Whole state: | 65.8% |
| This city: | 7.4% |
| Whole state: | 6.3% |
Likely homosexual households (counted as self-reported same-sex unmarried-partner households)
- Lesbian couples: 0.4% of all households
- Gay men: 0.2% of all households
People in group quarters in Decatur in 2010:
- 1,305 people in college/university student housing
- 1,005 people in nursing facilities/skilled-nursing facilities
- 501 people in state prisons
- 337 people in other noninstitutional facilities
- 238 people in local jails and other municipal confinement facilities
- 190 people in emergency and transitional shelters (with sleeping facilities) for people experiencing homelessness
- 112 people in correctional residential facilities
- 110 people in group homes intended for adults
- 57 people in workers' group living quarters and job corps centers
- 29 people in correctional facilities intended for juveniles
- 23 people in group homes for juveniles (non-correctional)
- 11 people in residential treatment centers for adults
People in group quarters in Decatur in 2000:
- 1,570 people in college dormitories (includes college quarters off campus)
- 903 people in nursing homes
- 380 people in state prisons
- 235 people in local jails and other confinement facilities (including police lockups)
- 107 people in other noninstitutional group quarters
- 100 people in homes for the mentally retarded
- 42 people in homes for abused, dependent, and neglected children
- 17 people in homes or halfway houses for drug/alcohol abuse
- 16 people in other nonhousehold living situations
- 15 people in homes for the mentally ill
- 14 people in other group homes
- 12 people in short-term care, detention or diagnostic centers for delinquent children
- 11 people in hospitals/wards and hospices for chronically ill
- 11 people in other hospitals or wards for chronically ill
- 10 people in homes for the physically handicapped
- 9 people in religious group quarters
- 7 people in mental (psychiatric) hospitals or wards
Banks with most branches in Decatur (2011 data):
- Soy Capital Bank and Trust Company: East Pershing Road Branch, First Federal Branch, Franklin Street Branch, Route 36 Branch, Messenger Service, Soy Capital Bank And Trust Company. Info updated 2006/11/03: Bank assets: $386.5 mil, Deposits: $276.3 mil, local headquarters, positive income, Commercial Lending Specialization, 11 total offices, Holding Company: Scb Bancorp, Inc.
- Busey Bank: First National Of Decatur Branch, First Bank North Facility, K-Mart Plaza-Financial Ctr. Facility, Ash Avenue Facility. Info updated 2010/01/25: Bank assets: $3,345.6 mil, Deposits: $2,767.4 mil, headquarters in Champaign, IL, positive income, Commercial Lending Specialization, 49 total offices, Holding Company: First Busey Corporation
- Hickory Point Bank and Trust, FSB: Mt Zion Branch, Hickory Point Bank And Trust, Fsb, Faries Branch, First Drive Branch. Info updated 2011/07/21: Bank assets: $632.1 mil, Deposits: $542.8 mil, local headquarters, positive income, Commercial Lending Specialization, 7 total offices
- Regions Bank: Kroger - Mt Zion Branch, Decatur Branch, East Pershing Branch, Decatur Fairview Plaza Banking Centr. Info updated 2011/02/24: Bank assets: $123,368.2 mil, Deposits: $98,301.3 mil, headquarters in Birmingham, AL, positive income, Commercial Lending Specialization, 1778 total offices, Holding Company: Regions Financial Corporation
- PNC Bank, National Association: South Shores Facility, Decatur Landmark Branch, Main/ Eldorado Branch, Water Street Branch. Info updated 2012/03/20: Bank assets: $263,309.6 mil, Deposits: $197,343.0 mil, headquarters in Wilmington, DE, positive income, Commercial Lending Specialization, 3085 total offices, Holding Company: Pnc Financial Services Group, Inc., The
- FIRST MID-ILLINOIS BANK & TRUST, NATIONAL ASSOCIATION: Decatur Branch at 100 South Water Street, branch established on 2000/05/01; Decatur Water Street Branch at 3101 North Water Street, branch established on 2009/09/21. Info updated 2010/09/16: Bank assets: $1,492.8 mil, Deposits: $1,192.9 mil, headquarters in Mattoon, IL, positive income, Commercial Lending Specialization, 37 total offices, Holding Company: First Mid-Illinois Bancshares, Inc.
- Prairie State Bank and Trust: Pershing Road Branch at 1000 West Pershing Road, branch established on 1998/12/01; Long Creek Banking Center Facility at 2028 S Mt. Zion Road, branch established on 1982/01/18. Info updated 2011/12/20: Bank assets: $633.0 mil, Deposits: $566.9 mil, headquarters in Mount Zion, IL, positive income, Commercial Lending Specialization, 21 total offices, Holding Company: American Central Bancorporation, Inc.
- Woodforest National Bank: Decatur Illinois Branch at 4224 North Prospect, branch established on 2010/01/09. Info updated 2011/05/10: Bank assets: $3,488.9 mil, Deposits: $3,097.6 mil, headquarters in Houston, TX, positive income, Commercial Lending Specialization, 766 total offices, Holding Company: Woodforest Financial Group Employee Stock Ownership Plan (With 401(K) Provisions)
- State Bank of Niantic: Decatur Branch at 3950 West Fountain Lane, branch established on 2009/11/30. Info updated 2006/11/03: Bank assets: $57.1 mil, Deposits: $48.6 mil, headquarters in Niantic, IL, positive income, 2 total offices, Holding Company: Scott Bancshares, Inc.
- 2 other banks with 2 local branches
For population 15 years and over in Decatur:
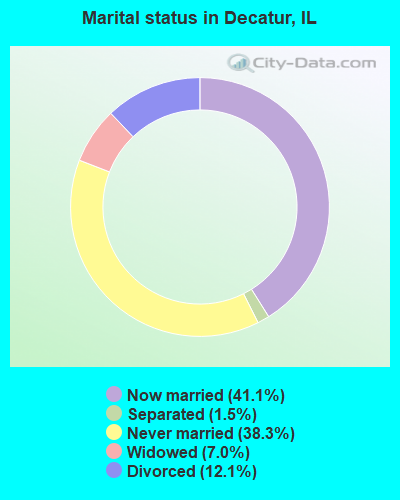
- Never married: 38.3%
- Now married: 41.1%
- Separated: 1.5%
- Widowed: 7.0%
- Divorced: 12.1%
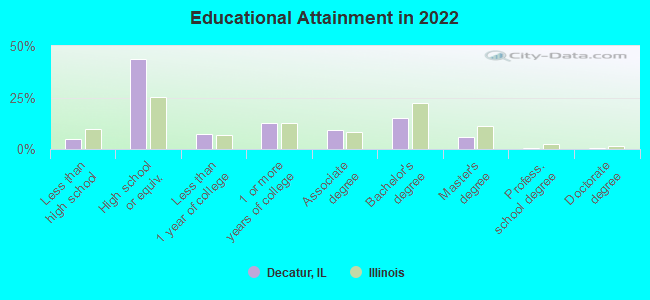
For population 25 years and over in Decatur:
- High school or higher: 95.0%
- Bachelor's degree or higher: 22.0%
- Graduate or professional degree: 6.8%
- Unemployed: 6.5%
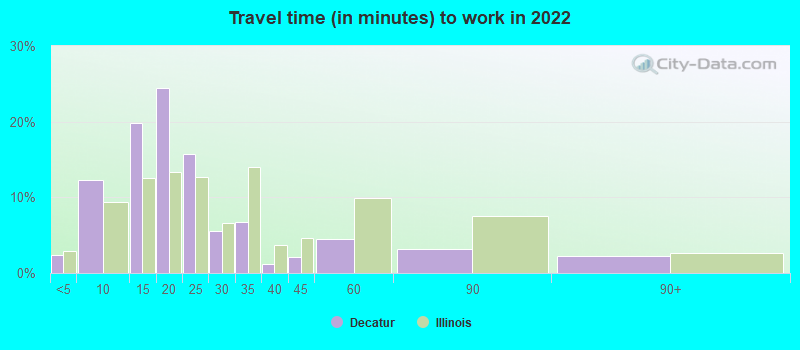
- Mean travel time to work (commute): 15.7 minutes
| Here: | 8.5 |
| Illinois average: | 12.5 |
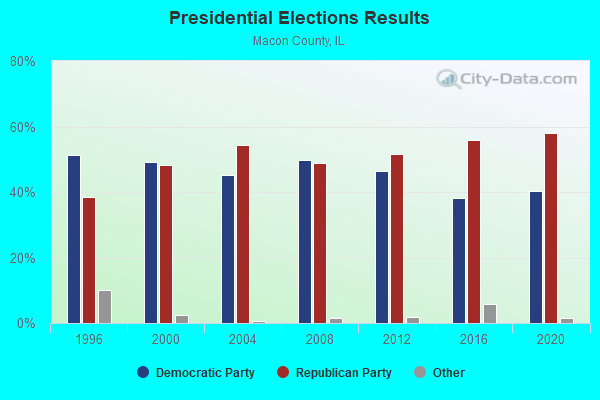
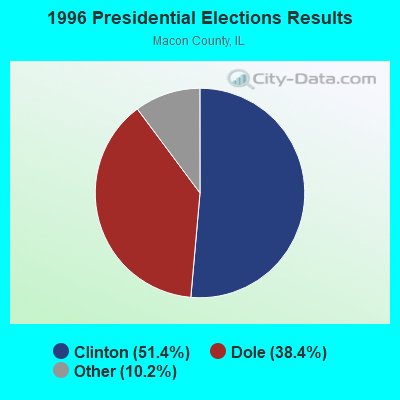
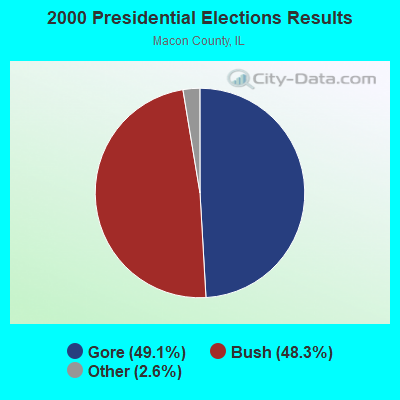
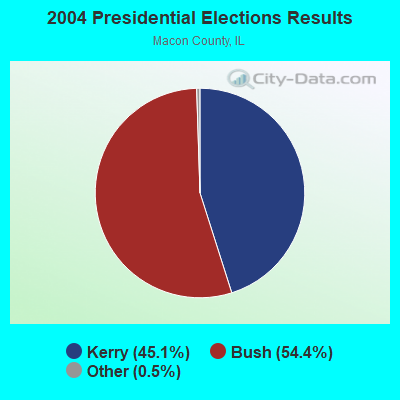
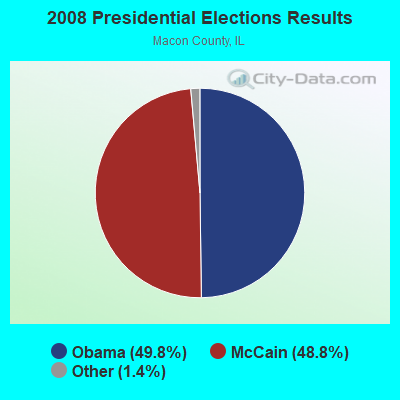
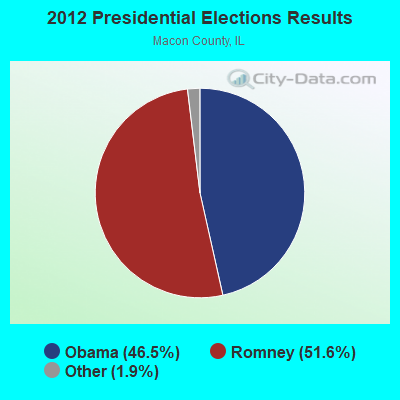
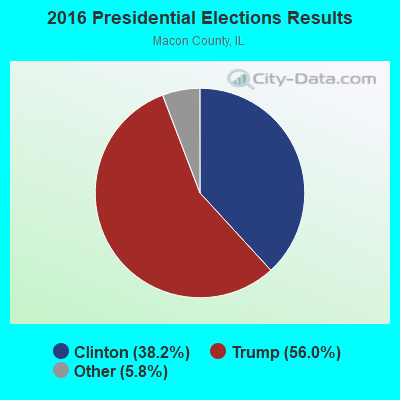
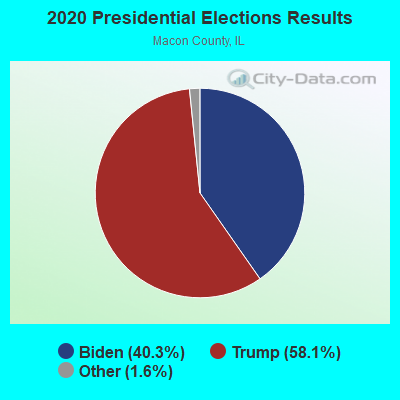
Graphs represent county-level data. Detailed 2008 Election Results
Religion statistics for Decatur, IL (based on Macon County data)
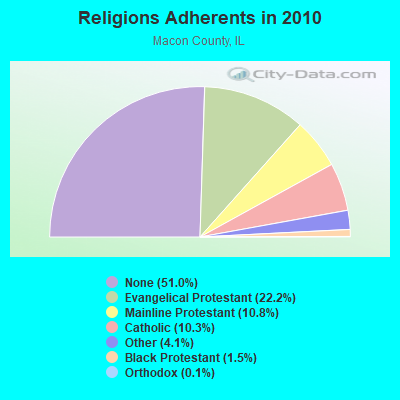
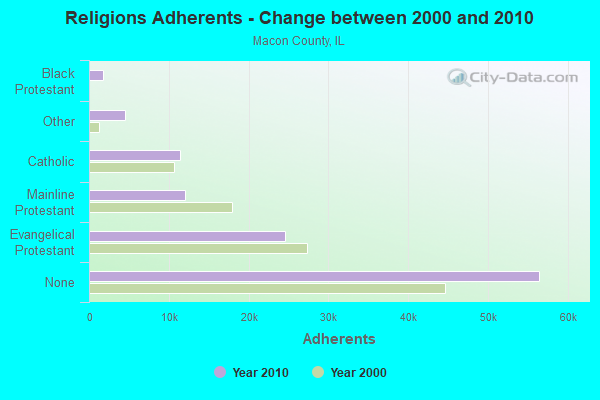
| Religion | Adherents | Congregations |
|---|---|---|
| Evangelical Protestant | 24,556 | 92 |
| Mainline Protestant | 11,982 | 41 |
| Catholic | 11,451 | 5 |
| Other | 4,490 | 11 |
| Black Protestant | 1,699 | 14 |
| Orthodox | 125 | 1 |
| None | 56,465 | - |
Food Environment Statistics:
| Here: | 1.20 / 10,000 pop. |
| Illinois: | 2.24 / 10,000 pop. |
| Macon County: | 0.28 / 10,000 pop. |
| Illinois: | 0.08 / 10,000 pop. |
| Here: | 0.92 / 10,000 pop. |
| Illinois: | 0.75 / 10,000 pop. |
| Macon County: | 3.59 / 10,000 pop. |
| Illinois: | 2.61 / 10,000 pop. |
| Here: | 5.71 / 10,000 pop. |
| State: | 6.86 / 10,000 pop. |
| Here: | 10.2% |
| Illinois: | 8.3% |
| Macon County: | 28.7% |
| State: | 25.2% |
| This county: | 12.4% |
| Illinois: | 14.5% |
Health and Nutrition:
| Here: | 50.5% |
| State: | 49.5% |
| Here: | 47.6% |
| Illinois: | 47.2% |
| Decatur: | 28.6 |
| Illinois: | 28.6 |
| Decatur: | 19.8% |
| Illinois: | 20.5% |
| This city: | 10.8% |
| Illinois: | 10.8% |
| Here: | 6.9 |
| State: | 6.8 |
| Decatur: | 33.8% |
| Illinois: | 33.4% |
| Here: | 56.4% |
| Illinois: | 56.4% |
| Decatur: | 78.7% |
| Illinois: | 79.9% |
More about Health and Nutrition of Decatur, IL Residents
| Local government employment and payroll (March 2022) | |||||
| Function | Full-time employees | Monthly full-time payroll | Average yearly full-time wage | Part-time employees | Monthly part-time payroll |
|---|---|---|---|---|---|
| Police Protection - Officers | 137 | $1,185,068 | $103,802 | 0 | $0 |
| Firefighters | 104 | $854,557 | $98,603 | 0 | $0 |
| Streets and Highways | 56 | $301,982 | $64,710 | 0 | $0 |
| Water Supply | 40 | $217,799 | $65,340 | 0 | $0 |
| Local Libraries | 28 | $120,105 | $51,474 | 9 | $15,547 |
| Financial Administration | 21 | $140,220 | $80,126 | 1 | $306 |
| Other and Unallocable | 20 | $115,019 | $69,011 | 0 | $0 |
| Other Government Administration | 14 | $70,317 | $60,272 | 1 | $177 |
| Housing and Community Development (Local) | 11 | $71,995 | $78,540 | 0 | $0 |
| Police - Other | 11 | $40,652 | $44,348 | 2 | $4,736 |
| Judicial and Legal | 8 | $56,234 | $84,351 | 0 | $0 |
| Parks and Recreation | 4 | $20,963 | $62,889 | 0 | $0 |
| Transit | 2 | $11,791 | $70,746 | 0 | $0 |
| Fire - Other | 1 | $4,639 | $55,668 | 0 | $0 |
| Totals for Government | 457 | $3,211,341 | $84,324 | 13 | $20,766 |
Decatur government finances - Expenditure in 2021 (per resident):
- Construction - Local Fire Protection: $1,492,000 ($21.59)
Financial Administration: $500,000 ($7.24)
Regular Highways: $113,000 ($1.64)
- Current Operations - Police Protection: $27,571,000 ($399.02)
Local Fire Protection: $19,500,000 ($282.21)
Regular Highways: $15,361,000 ($222.31)
Water Utilities: $11,487,000 ($166.24)
Financial Administration: $10,380,000 ($150.22)
General - Other: $8,271,000 ($119.70)
Transit Utilities: $7,844,000 ($113.52)
Libraries: $3,708,000 ($53.66)
Sewerage: $2,422,000 ($35.05)
Housing and Community Development: $29,000 ($0.42)
- General - Interest on Debt: $7,353,000 ($106.42)
- Intergovernmental to Local - Other - General - Other: $190,000 ($2.75)
- Total Salaries and Wages: $37,443,000 ($541.89)
Decatur government finances - Revenue in 2021 (per resident):
- Charges - Other: $6,670,000 ($96.53)
Sewerage: $6,231,000 ($90.18)
Solid Waste Management: $697,000 ($10.09)
- Federal Intergovernmental - General Local Government Support: $4,554,000 ($65.91)
Transit Utilities: $2,330,000 ($33.72)
- Miscellaneous - General Revenue - Other: $3,128,000 ($45.27)
Fines and Forfeits: $1,770,000 ($25.62)
Interest Earnings: $959,000 ($13.88)
- Revenue - Water Utilities: $33,171,000 ($480.06)
Transit Utilities: $326,000 ($4.72)
- State Intergovernmental - General Local Government Support: $24,299,000 ($351.67)
Transit Utilities: $6,837,000 ($98.95)
Other: $4,224,000 ($61.13)
Highways: $2,790,000 ($40.38)
Public Welfare: $80,000 ($1.16)
- Tax - Property: $16,622,000 ($240.56)
General Sales and Gross Receipts: $9,785,000 ($141.61)
Public Utilities Sales: $6,769,000 ($97.96)
Other Selective Sales: $6,639,000 ($96.08)
Other License: $1,238,000 ($17.92)
Decatur government finances - Debt in 2021 (per resident):
- Long Term Debt - Beginning Outstanding - Unspecified Public Purpose: $141,063,000 ($2041.52)
Outstanding Unspecified Public Purpose: $131,533,000 ($1903.60)
Retired Unspecified Public Purpose: $27,580,000 ($399.15)
Issue, Unspecified Public Purpose: $18,050,000 ($261.23)
Decatur government finances - Cash and Securities in 2021 (per resident):
- Other Funds - Cash and Securities: $63,805,000 ($923.41)
| Businesses in Decatur, IL | ||||
| Name | Count | Name | Count | |
|---|---|---|---|---|
| ALDI | 2 | MasterBrand Cabinets | 5 | |
| AT&T | 2 | McDonald's | 6 | |
| Ace Hardware | 1 | Nissan | 1 | |
| Advance Auto Parts | 1 | Olive Garden | 1 | |
| Arby's | 3 | Panera Bread | 1 | |
| AutoZone | 3 | Papa John's Pizza | 1 | |
| Baymont Inn | 1 | Payless | 1 | |
| Blockbuster | 1 | Penske | 1 | |
| Burger King | 3 | Pizza Hut | 1 | |
| CVS | 3 | Popeyes | 1 | |
| Catherines | 1 | RadioShack | 1 | |
| Chevrolet | 1 | Ramada | 1 | |
| Circle K | 7 | Ruby Tuesday | 1 | |
| Cracker Barrel | 1 | SAS Shoes | 1 | |
| Dairy Queen | 3 | Sam's Club | 1 | |
| Days Inn | 1 | Sears | 1 | |
| Domino's Pizza | 2 | Sleep Inn | 1 | |
| Econo Lodge | 1 | Sprint Nextel | 1 | |
| Fashion Bug | 1 | Starbucks | 2 | |
| FedEx | 8 | Steak 'n Shake | 2 | |
| Firestone Complete Auto Care | 2 | Subway | 12 | |
| Ford | 1 | T-Mobile | 3 | |
| GameStop | 1 | T.J.Maxx | 1 | |
| H&R Block | 5 | Taco Bell | 2 | |
| Hardee's | 1 | Talbots | 1 | |
| Hawthorn | 1 | Target | 1 | |
| Hobby Lobby | 1 | The Room Place | 1 | |
| Holiday Inn | 1 | Toyota | 1 | |
| Honda | 1 | True Value | 1 | |
| Hyundai | 1 | U-Haul | 5 | |
| IHOP | 1 | U.S. Cellular | 3 | |
| Jimmy John's | 4 | UPS | 16 | |
| KFC | 2 | Walgreens | 5 | |
| Kmart | 1 | Walmart | 2 | |
| Kroger | 4 | Wendy's | 1 | |
| Little Caesars Pizza | 1 | YMCA | 1 | |
| Long John Silver's | 1 | |||
Strongest AM radio stations in Decatur:
- WSOY (1340 AM; 1 kW; DECATUR, IL; Owner: NM LICENSING, LLC)
- WDZ (1050 AM; 1 kW; DECATUR, IL; Owner: NM LICENSING, LLC)
- KXEN (1010 AM; 50 kW; FESTUS-ST. LOUIS, MO; Owner: BDJ RADIO ENTERPRISES, LLC)
- WILL (580 AM; 5 kW; URBANA, IL; Owner: UNIV. OF ILLINOIS BOARD OF TRUSTEES)
- KMOX (1120 AM; 50 kW; ST. LOUIS, MO; Owner: INFINITY BROADCASTING OPERATIONS, INC.)
- WLS (890 AM; 50 kW; CHICAGO, IL; Owner: WLS, INC.)
- WSCR (670 AM; 50 kW; CHICAGO, IL; Owner: INFINITY BROADCASTING OPERATIONS, INC.)
- WLBH (1170 AM; daytime; 5 kW; MATTOON, IL; Owner: MATTOON BROADCASTING COMPANY)
- WGN (720 AM; 50 kW; CHICAGO, IL; Owner: WGN CONTINENTAL BROADCASTING CO.)
- WYLL (1160 AM; 50 kW; CHICAGO, IL; Owner: SCA LICENSE CORPORATION)
- WBBM (780 AM; 50 kW; CHICAGO, IL; Owner: INFINITY BROADCASTING OPERATIONS, INC.)
- WIBC (1070 AM; 50 kW; INDIANAPOLIS, IN; Owner: EMMIS RADIO LICENSE CORPORATION)
- WMVP (1000 AM; 50 kW; CHICAGO, IL; Owner: ABC, INC.)
Strongest FM radio stations in Decatur:
- WSOY-FM (102.9 FM; DECATUR, IL; Owner: NM LICENSING, LLC)
- WXFM-FM (99.3 FM; MOUNT ZION, IL; Owner: TECHNICOM, INC.)
- W252AR (98.3 FM; DECATUR, IL; Owner: WEJT, INC.)
- WNLD (88.1 FM; DECATUR, IL; Owner: ILLINOIS BIBLE INSTITUTE)
- WYDS (93.1 FM; DECATUR, IL; Owner: WEJT, INC.)
- W203BD (88.5 FM; DECATUR, IL; Owner: EDUCATIONAL MEDIA FOUNDATION)
- WJMU (89.5 FM; DECATUR, IL; Owner: MILLIKIN UNIVERSITY)
- W261CQ (100.1 FM; DECATUR, IL; Owner: CORNERSTONE COMMUNITY RADIO)
- WDKR (107.3 FM; MAROA, IL; Owner: WDKR, INC.)
- WILL-FM (90.9 FM; URBANA, IL; Owner: UNIV. OF ILLINOIS BOARD OF TRUSTEES)
- WZUS (100.9 FM; MACON, IL; Owner: THE CROMWELL GROUP, INC. OF ILLINOIS)
- WDZQ (95.1 FM; DECATUR, IL; Owner: NM LICENSING, LLC)
- W213BI (90.5 FM; DECATUR, IL; Owner: CALVARY CHAPEL OF TWIN FALLS, INC.)
- WEJT (105.1 FM; SHELBYVILLE, IL; Owner: THE CROMWELL GROUP, INC. OF ILLINOIS)
- WZNX (106.7 FM; SULLIVAN, IL; Owner: WSHY, INC.)
- WMHX (93.9 FM; LINCOLN, IL; Owner: SAGA COMMUNICATIONS OF ILLINOIS, LLC)
- WDBR (103.7 FM; SPRINGFIELD, IL; Owner: SAGA COMMUNICATIONS OF ILLINOIS, LLC)
- WUIS (91.9 FM; SPRINGFIELD, IL; Owner: UNIVERSITY OF IL AT SPRINGFIELD)
- W217BB (91.3 FM; HICKORY POINT, IL; Owner: LIFE ON THE WAY COMMUNICATIONS, INC.)
- WCZQ (105.5 FM; MONTICELLO, IL; Owner: NM LICENSING, LLC)
TV broadcast stations around Decatur:
- W29BG (Channel 29; DECATUR, IL; Owner: TRINITY BROADCASTING NETWORK, INC.)
- WBUI (Channel 23; DECATUR, IL; Owner: ACME TV LICENSES OF ILLINOIS, LLC)
- WAND (Channel 17; DECATUR, IL; Owner: WAND(TV) PARTNERSHIP)
- WCIA (Channel 3; CHAMPAIGN, IL; Owner: NEXSTAR BROADCASTING OF CHAMPAIGN, L.L.C.)
- WILL-TV (Channel 12; URBANA, IL; Owner: UNIV. OF ILLINOIS BD. OF TRUSTEES)
- WRSP-TV (Channel 55; SPRINGFIELD, IL; Owner: SPRINGFIELD BROADCASTING PARTNERS)
- WICS (Channel 20; SPRINGFIELD, IL; Owner: WICS LICENSEE, LLC)
- W52BR (Channel 52; CHAMPAIGN-URBANA, IL; Owner: MARCIA COHEN)
- WCFN (Channel 49; SPRINGFIELD, IL; Owner: NEXSTAR BROADCASTING OF CHAMPAIGN, L.L.C.)
- National Bridge Inventory (NBI) Statistics
- 157Number of bridges
- 1,893ft / 577mTotal length
- $33,994,000Total costs
- 927,425Total average daily traffic
- 94,922Total average daily truck traffic
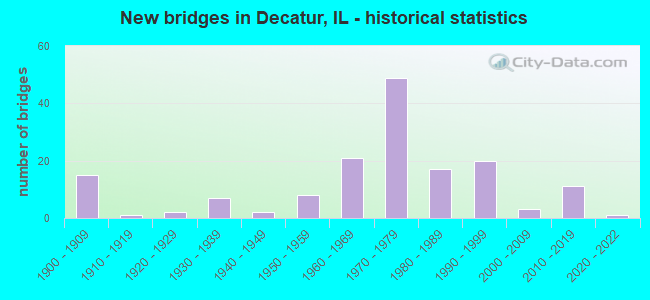
- New bridges - historical statistics
- 151900-1909
- 11910-1919
- 21920-1929
- 71930-1939
- 21940-1949
- 81950-1959
- 211960-1969
- 491970-1979
- 171980-1989
- 201990-1999
- 32000-2009
- 112010-2019
- 12020-2022
FCC Registered Antenna Towers: 367 (See the full list of FCC Registered Antenna Towers)
FCC Registered Commercial Land Mobile Towers: 8 (See the full list of FCC Registered Commercial Land Mobile Towers in Decatur, IL)
FCC Registered Private Land Mobile Towers: 10 (See the full list of FCC Registered Private Land Mobile Towers)
FCC Registered Broadcast Land Mobile Towers: 121 (See the full list of FCC Registered Broadcast Land Mobile Towers)
FCC Registered Microwave Towers: 136 (See the full list of FCC Registered Microwave Towers in this town)
FCC Registered Paging Towers: 10 (See the full list of FCC Registered Paging Towers)
FCC Registered Maritime Coast & Aviation Ground Towers: 13 (See the full list of FCC Registered Maritime Coast & Aviation Ground Towers)
FCC Registered Amateur Radio Licenses: 353 (See the full list of FCC Registered Amateur Radio Licenses in Decatur)
FAA Registered Aircraft: 50 (See the full list of FAA Registered Aircraft in Decatur)
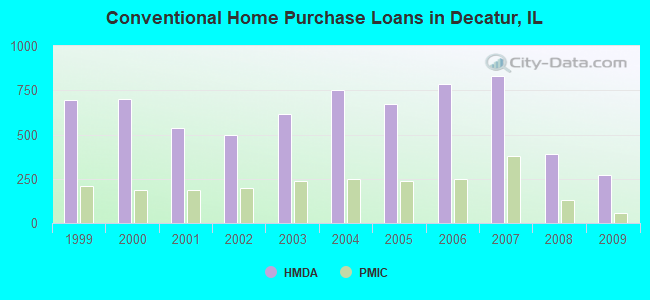
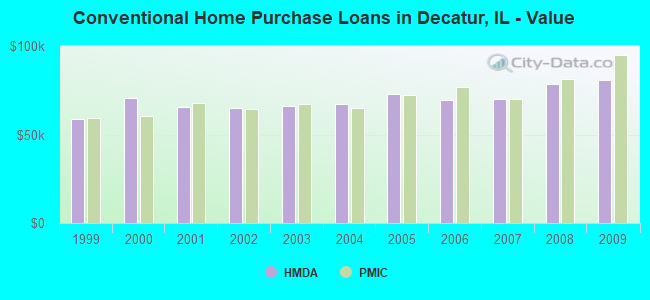
| Home Mortgage Disclosure Act Aggregated Statistics For Year 2009 (Based on 17 full and 13 partial tracts) | ||||||||||||||
| A) FHA, FSA/RHS & VA Home Purchase Loans | B) Conventional Home Purchase Loans | C) Refinancings | D) Home Improvement Loans | E) Loans on Dwellings For 5+ Families | F) Non-occupant Loans on < 5 Family Dwellings (A B C & D) | G) Loans On Manufactured Home Dwelling (A B C & D) | ||||||||
|---|---|---|---|---|---|---|---|---|---|---|---|---|---|---|
| Number | Average Value | Number | Average Value | Number | Average Value | Number | Average Value | Number | Average Value | Number | Average Value | Number | Average Value | |
| LOANS ORIGINATED | 230 | $77,331 | 271 | $80,956 | 788 | $106,090 | 87 | $28,041 | 3 | $180,113 | 128 | $58,223 | 2 | $19,770 |
| APPLICATIONS APPROVED, NOT ACCEPTED | 7 | $75,676 | 13 | $94,495 | 56 | $114,098 | 9 | $37,794 | 0 | $0 | 7 | $79,713 | 1 | $27,590 |
| APPLICATIONS DENIED | 33 | $67,992 | 34 | $43,202 | 240 | $84,076 | 65 | $21,481 | 1 | $100,000 | 22 | $54,731 | 2 | $21,705 |
| APPLICATIONS WITHDRAWN | 13 | $98,172 | 16 | $85,508 | 201 | $90,330 | 15 | $39,302 | 0 | $0 | 10 | $55,003 | 0 | $0 |
| FILES CLOSED FOR INCOMPLETENESS | 0 | $0 | 1 | $37,600 | 17 | $102,818 | 2 | $64,945 | 0 | $0 | 1 | $37,600 | 0 | $0 |
Detailed mortgage data for all 28 tracts in Decatur, IL
| Private Mortgage Insurance Companies Aggregated Statistics For Year 2009 (Based on 13 full and 13 partial tracts) | ||||||
| A) Conventional Home Purchase Loans | B) Refinancings | C) Non-occupant Loans on < 5 Family Dwellings (A & B) | ||||
|---|---|---|---|---|---|---|
| Number | Average Value | Number | Average Value | Number | Average Value | |
| LOANS ORIGINATED | 58 | $94,965 | 41 | $103,595 | 0 | $0 |
| APPLICATIONS APPROVED, NOT ACCEPTED | 13 | $88,897 | 15 | $128,723 | 1 | $18,090 |
| APPLICATIONS DENIED | 3 | $251,420 | 3 | $128,420 | 0 | $0 |
| APPLICATIONS WITHDRAWN | 3 | $99,817 | 2 | $122,575 | 0 | $0 |
| FILES CLOSED FOR INCOMPLETENESS | 1 | $95,000 | 1 | $94,120 | 0 | $0 |
2002 - 2018 National Fire Incident Reporting System (NFIRS) incidents
- Fire incident types reported to NFIRS in Decatur, IL
- 3,15649.9%Structure Fires
- 1,91830.3%Outside Fires
- 1,12017.7%Mobile Property/Vehicle Fires
- 1282.0%Other
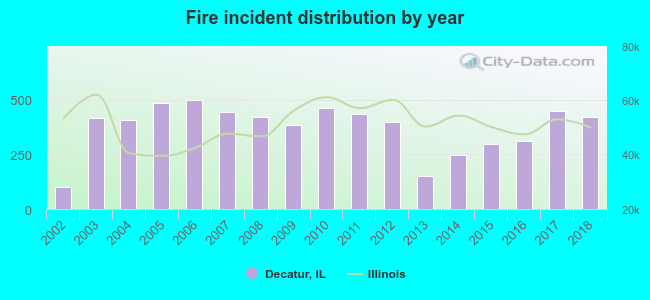 According to the data from the years 2002 - 2018 the average number of fires per year is 372. The highest number of fire incidents - 497 took place in 2006, and the least - 99 in 2002. The data has an increasing trend.
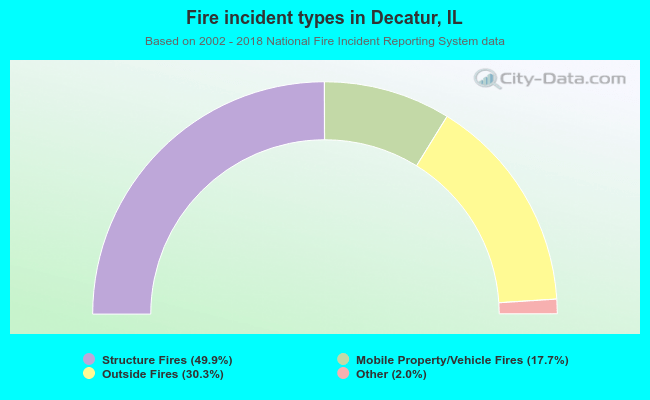 When looking into fire subcategories, the most incidents belonged to: Structure Fires (49.9%), and Outside Fires (30.3%).
Fire-safe hotels and motels in Decatur, Illinois:
- Red Carpet Inn Decatur, 3035 N Water St, Decatur, Illinois 62526 , Phone: (217) 877-3380
- Americas Best Value Inn And Suites, 333 N Wyckles Rd, Decatur, Illinois 62522 , Phone: (217) 422-5900, Fax: (217) 422-5900
- America's Best Value Inn, 450 E Pershing Rd, Decatur, Illinois 62526 , Phone: (217) 877-7255, Fax: (217) 875-4085
- Green Valley Motel, 145 W Pershing Rd, Decatur, Illinois 62526 , Phone: (217) 877-3123
- Tri-Manor Motel, 3420 N 22ND St, Decatur, Illinois 62526 , Phone: (217) 877-6900, Fax: (217) 877-6905
- Country Inn & Suites, 5150 Hickory Pt Frontage Rd, Decatur, Illinois 62526 , Phone: (217) 872-2402, Fax: (217) 872-2403
- Lakeview Motel, 16 S Country Club Rd, Decatur, Illinois 62521 , Phone: (217) 428-4677, Fax: (217) 428-2682
- Super 8 Motel Decatur, 3141 N Water St, Decatur, Illinois 62526 , Phone: (217) 877-8888, Fax: (217) 877-8888
- 3 other hotels and motels
| Most common first names in Decatur, IL among deceased individuals | ||
| Name | Count | Lived (average) |
|---|---|---|
| William | 837 | 75.4 years |
| Mary | 827 | 79.4 years |
| John | 750 | 74.6 years |
| Robert | 697 | 70.6 years |
| James | 607 | 71.3 years |
| Charles | 589 | 74.5 years |
| Helen | 407 | 80.3 years |
| Dorothy | 375 | 77.9 years |
| George | 354 | 76.1 years |
| Ruth | 352 | 80.3 years |
| Most common last names in Decatur, IL among deceased individuals | ||
| Last name | Count | Lived (average) |
|---|---|---|
| Smith | 399 | 75.3 years |
| Johnson | 229 | 75.0 years |
| Brown | 226 | 73.7 years |
| Miller | 219 | 76.1 years |
| Jones | 200 | 74.6 years |
| Taylor | 186 | 75.5 years |
| Williams | 179 | 76.0 years |
| Davis | 158 | 76.2 years |
| Moore | 149 | 76.5 years |
| White | 130 | 74.5 years |
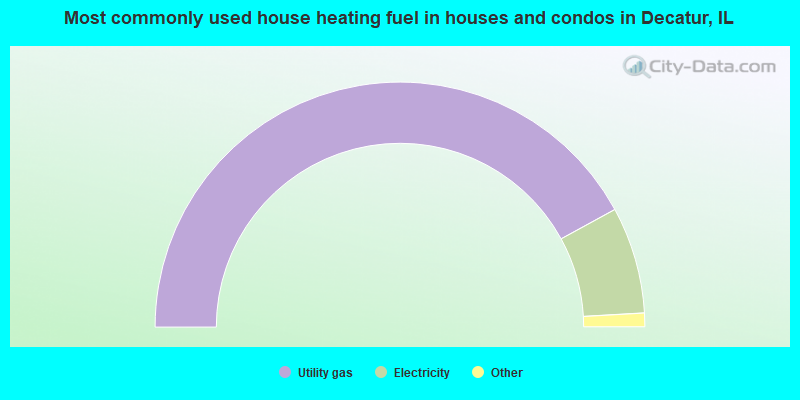
- 84.1%Utility gas
- 14.1%Electricity
- 1.0%Bottled, tank, or LP gas
- 0.3%Other fuel
- 0.2%Wood
- 0.1%Coal or coke
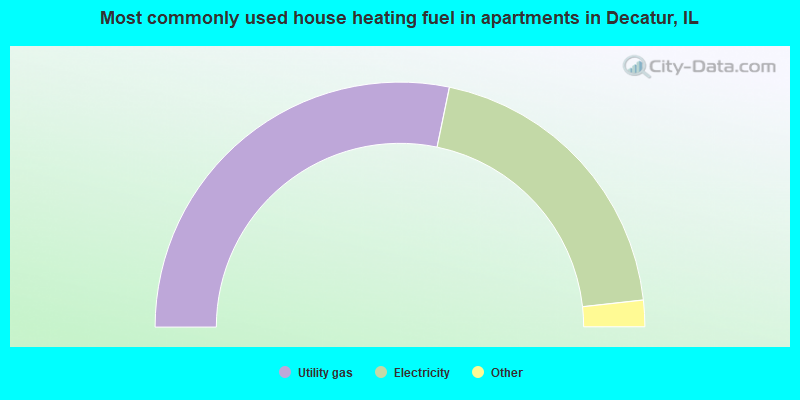
- 56.5%Utility gas
- 40.0%Electricity
- 1.9%No fuel used
- 1.1%Bottled, tank, or LP gas
- 0.5%Other fuel
Decatur compared to Illinois state average:
- Median household income below state average.
- Median house value significantly below state average.
- Unemployed percentage below state average.
- Hispanic race population percentage significantly below state average.
- Foreign-born population percentage significantly below state average.
- Length of stay since moving in below state average.
- Institutionalized population percentage above state average.
Decatur on our top lists:
- #3 on the list of "Top 101 cities with the largest city-data.com crime index decrease from 2011 to 2012 (population 50,000+)"
- #3 on the list of "Top 101 cities with the largest wind speed differences during a year (population 50,000+)"
- #4 on the list of "Top 101 cities with the most people born in the same U.S. state as the city (population 50,000+)"
- #11 on the list of "Top 101 cities with the highest percentage of English-only speaking households, population 50,000+"
- #11 on the list of "Top 101 cities with largest percentage of females in industries: utilities (population 50,000+)"
- #13 on the list of "Top 101 cities with largest percentage of males in industries: management of companies and enterprises (population 50,000+)"
- #15 on the list of "Top 100 cities with declining populations from 2000 to 2014 (pop. 50,000+)"
- #15 on the list of "Top 101 cities with largest percentage of females in occupations: community and social service occupations (population 50,000+)"
- #18 on the list of "Top 101 cities with the largest percentage population decrease from 2000 (population 50,000+)"
- #33 on the list of "Top 101 cities with largest percentage of males in industries: utilities (population 50,000+)"
- #34 on the list of "Top 100 cities with lowest ratio of median house value to median household income (pop. 50,000+)"
- #35 on the list of "Top 101 cities with largest percentage of females in occupations: extraction workers (population 50,000+)"
- #35 on the list of "Top 101 cities with largest percentage of females in occupations: fishing and hunting, and forest and logging workers (population 50,000+)"
- #35 on the list of "Top 101 cities with largest percentage of females in industries: farm product raw materials merchant wholesalers (population 50,000+)"
- #35 on the list of "Top 101 cities with largest percentage of males in industries: manufacturing (population 50,000+)"
- #36 on the list of "Top 101 cities with largest percentage of females in industries: broadcasting, internet publishing, and telecommunications services (population 50,000+)"
- #36 on the list of "Top 101 cities with largest percentage of males in industries: wholesale electronic markets and agents and brokers (population 50,000+)"
- #36 on the list of "Top 101 cities with largest percentage of females in industries: wholesale electronic markets and agents and brokers (population 50,000+)"
- #36 on the list of "Top 101 cities with largest percentage of males in industries: broadcasting, internet publishing, and telecommunications services (population 50,000+)"
- #40 on the list of "Top 100 cities with the largest percentage of females (pop. 50,000+)"
- #10 on the list of "Top 101 counties with the lowest percentage of residents relocating from foreign countries between 2010 and 2011"
- #56 on the list of "Top 101 counties with the highest Sulfur Oxides Annual air pollution readings in 2012 (µg/m3)"
- #60 on the list of "Top 101 counties with the largest increase in the number of births per 1000 residents 2000-2006 to 2007-2013 (pop 50,000+)"
- #95 on the list of "Top 101 counties with the lowest percentage of residents relocating from other counties between 2010 and 2011 (pop. 50,000+)"
- #99 on the list of "Top 101 counties with the lowest percentage of residents relocating to other counties in 2011 (pop. 50,000+)"

|
|
Total of 313 patent applications in 2008-2024.