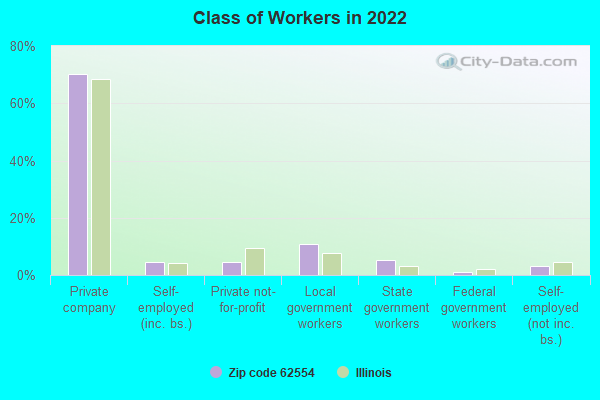
Estimated zip code population in 2022: 1,703 Zip code population in 2010: 1,563 Zip code population in 2000: 1,710
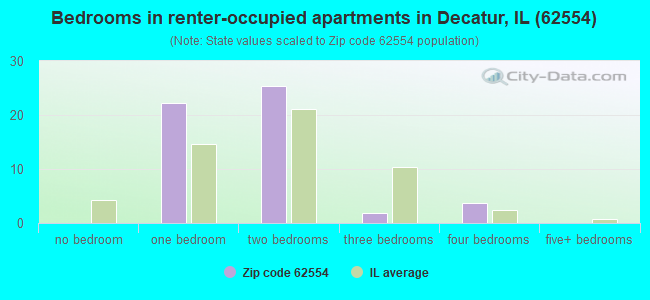
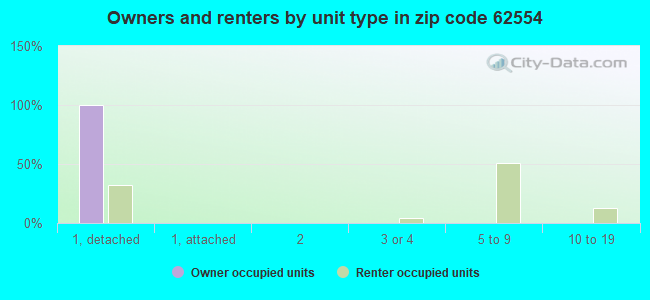
Houses and condos: 716 Renter-occupied apartments: 53
% of renters here:
8%
State:
33%
March 2022 cost of living index in zip code 62554: 82.2 (low, U.S. average is 100)
Land area: 18.4 sq. mi. Water area: 0.4 sq. mi.
Population density: 92 people per square mile
(very low).
OSM Map
General Map
Google Map
MSN Map
OSM Map
General Map
Google Map
MSN Map
OSM Map
General Map
Google Map
MSN Map
OSM Map
General Map
Google Map
MSN Map
Please wait while loading the map...
Real estate property taxes paid for housing units in 2022:
This zip code:
1.8% ($2,569)
Illinois:
2.0% ($4,912)
Median real estate property taxes paid for housing units with mortgages in 2022: $2,628 (1.8%) Median real estate property taxes paid for housing units with no mortgage in 2022: $2,310 (1.7%)
Business Search- 14 Million verified businesses
Males: 734
(43.1%)
Females: 969
(56.9%)
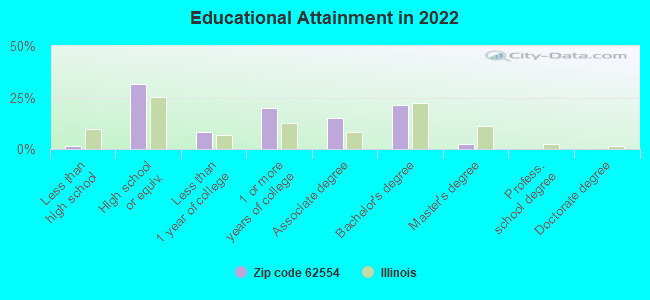
For population 25 years and over in 62554:
High school or higher: 97.7%
Bachelor's degree or higher: 23.4%
Graduate or professional degree: 2.5%
Unemployed: 2.0%
Mean travel time to work (commute): 19.9 minutes
For population 15 years and over in 62554:
Never married: 18.8%
Now married: 70.5%
Separated: 0.0%
Widowed: 2.7%
Divorced: 7.9%
Zip code 62554 compared to state average:
Median house value below state average.
Unemployed percentage below state average.
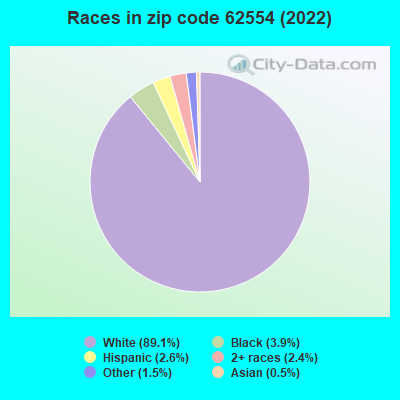
Black race population percentage significantly below state average.
Hispanic race population percentage significantly below state average.
Foreign-born population percentage significantly below state average.
Renting percentage significantly below state average.
Length of stay since moving in significantly above state average.
Percentage of population with a bachelor's degree or higher below state average.
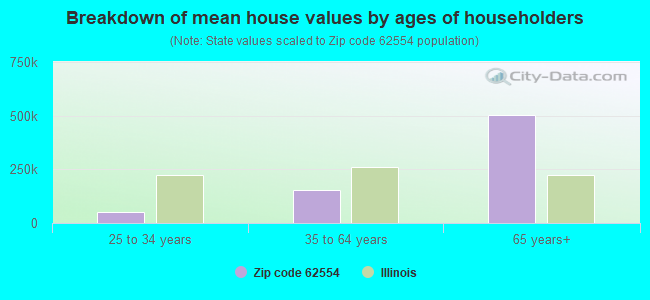
Estimated median house/condo value in 2022: $140,795
62554:
$140,795
Illinois:
$251,600
Median resident age:
This zip code:
41.8 years
Illinois median age:
39.1 years
Average household size:
This zip code:
2.6 people
Illinois:
2.4 people
Averages for the 2020 tax year for zip code 62554, filed in 2021:
Average Adjusted Gross Income (AGI) in 2020: $67,237 (Individual Income Tax Returns)
Here:
$67,237
State:
$82,626
Salary/wage: $58,433 (reported on 79.7% of returns)
Here:
$58,433
State:
$66,640
(% of AGI for various income ranges: 1100.0% for AGIs below $25k, 3175.4% for AGIs $25k-50k, 5604.4% for AGIs $50k-75k, 8312.5% for AGIs $75k-100k, 19451.0% for AGIs $100k-200k)
Taxable interest for individuals: $938 (reported on 43.0% of returns)
This zip code:
$938
Illinois:
$2,376
(% of AGI for various income ranges: 15.0% for AGIs below $25k, 48.5% for AGIs $25k-50k, 20.0% for AGIs $50k-75k, 60.0% for AGIs $75k-100k, 169.0% for AGIs $100k-200k)
Ordinary dividends: $3,850 (reported on 22.8% of returns)
Here:
$3,850
State:
$9,061
(% of AGI for various income ranges: 6.4% for AGIs below $25k, 52.3% for AGIs $25k-50k, 83.3% for AGIs $50k-75k, 111.2% for AGIs $75k-100k, 452.0% for AGIs $100k-200k)
Net capital gain/loss in AGI: +$2,721 (reported on 17.7% of returns)
Here:
+$2,721
State:
+$31,684
(% of AGI for various income ranges: 48.5% for AGIs $25k-50k, 44.4% for AGIs $50k-75k, 26.2% for AGIs $75k-100k, 257.0% for AGIs $100k-200k)
Profit/loss from business: +$3,500 (reported on 11.4% of returns)
Here:
+$3,500
State:
+$12,175
(% of AGI for various income ranges: 100.7% for AGIs below $25k, 60.0% for AGIs $50k-75k, 120.0% for AGIs $100k-200k)
Taxable individual retirement arrangement distribution: $17,709 (reported on 13.9% of returns)
62554:
$17,709
Illinois:
$21,613
(% of AGI for various income ranges: 84.3% for AGIs below $25k, 355.4% for AGIs $25k-50k, 565.0% for AGIs $75k-100k, 916.0% for AGIs $100k-200k)
Total itemized deductions: $25,525 (reported on 5.1% of returns)
Here:
$25,525
State:
$34,948
(% of AGI for various income ranges: 1276.2% for AGIs $75k-100k)
Charity contributions: $10,850 (reported on 2.5% of returns)
Here:
$10,850
State:
$13,122
(% of AGI for various income ranges: 271.2% for AGIs $75k-100k)
Taxes paid: $6,025 (reported on 5.1% of returns)
62554:
$6,025
State:
$8,563
(% of AGI for various income ranges: 301.2% for AGIs $75k-100k)
Earned income credit: $2,013 (reported on 10.1% of returns)
Here:
$2,013
State:
$2,311
(% of AGI for various income ranges: 68.6% for AGIs below $25k, 50.0% for AGIs $25k-50k)
Percentage of individuals using paid preparers for their 2020 taxes: 94.9%
Here:
95%
State:
93%
(% for various income ranges: 95.2% for AGIs below $25k, 94.1% for AGIs $25k-50k, 91.7% for AGIs $50k-75k, 100.0% for AGIs $75k-100k, 94.4% for AGIs $100k-200k)
Averages for the 2012 tax year for zip code 62554, filed in 2013:
Average Adjusted Gross Income (AGI) in 2012: $61,992 (Individual Income Tax Returns)
Here:
$61,992
State:
$68,058
Salary/wage: $54,988 (reported on 84.2% of returns)
Here:
$54,988
State:
$55,396
(% of AGI for various income ranges: 67.2% for AGIs below $25k, 76.7% for AGIs $25k-50k, 68.7% for AGIs $50k-75k, 77.2% for AGIs $75k-100k, 76.4% for AGIs $100k-200k)
Taxable interest for individuals: $550 (reported on 50.0% of returns)
This zip code:
$550
Illinois:
$1,969
(% of AGI for various income ranges: 0.6% for AGIs below $25k, 1.0% for AGIs $25k-50k, 0.4% for AGIs $50k-75k, 0.3% for AGIs $75k-100k, 0.4% for AGIs $100k-200k)
Ordinary dividends: $1,883 (reported on 23.7% of returns)
Here:
$1,883
State:
$7,786
(% of AGI for various income ranges: 1.0% for AGIs below $25k, 0.4% for AGIs $25k-50k, 0.7% for AGIs $50k-75k, 0.2% for AGIs $75k-100k, 1.0% for AGIs $100k-200k)
Net capital gain/loss in AGI: +$1,150 (reported on 15.8% of returns)
Here:
+$1,150
State:
+$22,183
(% of AGI for various income ranges: 0.7% for AGIs $100k-200k)
Profit/loss from business: +$5,478 (reported on 11.8% of returns)
Here:
+$5,478
State:
+$12,903
(% of AGI for various income ranges: 5.4% for AGIs $25k-50k, 0.8% for AGIs $75k-100k, 0.6% for AGIs $100k-200k)
Taxable individual retirement arrangement distribution: $9,511 (reported on 11.8% of returns)
62554:
$9,511
Illinois:
$17,929
(% of AGI for various income ranges: 6.3% for AGIs below $25k, 2.6% for AGIs $50k-75k, 4.8% for AGIs $75k-100k)
Total itemized deductions: $17,819 (18% of AGI, reported on 34.2% of returns)
Here:
$17,819
State:
$26,433
Here:
17.6% of AGI
State:
19.2% of AGI
(% of AGI for various income ranges: 8.1% for AGIs $25k-50k, 10.1% for AGIs $50k-75k, 10.2% for AGIs $75k-100k, 11.3% for AGIs $100k-200k)
Charity contributions: $4,365 (reported on 22.4% of returns)
Here:
$4,365
State:
$4,525
(% of AGI for various income ranges: 0.9% for AGIs $25k-50k, 1.4% for AGIs $50k-75k, 1.5% for AGIs $75k-100k, 2.1% for AGIs $100k-200k)
Taxes paid: $8,012 (reported on 34.2% of returns)
62554:
$8,012
State:
$11,968
(% of AGI for various income ranges: 2.7% for AGIs $25k-50k, 3.7% for AGIs $50k-75k, 4.4% for AGIs $75k-100k, 5.8% for AGIs $100k-200k)
Earned income credit: $2,214 (reported on 9.2% of returns)
Here:
$2,214
State:
$2,349
(% of AGI for various income ranges: 3.7% for AGIs below $25k, 1.0% for AGIs $25k-50k)
Percentage of individuals using paid preparers for their 2012 taxes: 57.9%
Here:
58%
State:
57%
(% for various income ranges: 52.2% for AGIs below $25k, 60.0% for AGIs $25k-50k, 64.3% for AGIs $50k-75k, 54.5% for AGIs $75k-100k, 61.5% for AGIs $100k-200k)
Averages for the 2004 tax year for zip code 62554, filed in 2005:
Average Adjusted Gross Income (AGI) in 2004: $48,729 (Individual Income Tax Returns)
Here:
$48,729
State:
$54,625
Salary/wage: $44,028 (reported on 85.1% of returns)
Here:
$44,028
State:
$46,811
(% of AGI for various income ranges: 83.3% for AGIs below $10k, 68.7% for AGIs $10k-25k, 66.3% for AGIs $25k-50k, 80.1% for AGIs $50k-75k, 83.0% for AGIs $75k-100k, 78.1% for AGIs over 100k)
Taxable interest for individuals: $949 (reported on 61.8% of returns)
This zip code:
$949
Illinois:
$2,101
(% of AGI for various income ranges: 4.1% for AGIs below $10k, 5.3% for AGIs $10k-25k, 1.8% for AGIs $25k-50k, 0.7% for AGIs $50k-75k, 0.6% for AGIs $75k-100k, 0.5% for AGIs over 100k)
Taxable dividends: $944 (reported on 28.2% of returns)
Here:
$944
State:
$4,306
(% of AGI for various income ranges: 0.5% for AGIs below $10k, 1.0% for AGIs $10k-25k, 0.7% for AGIs $25k-50k, 0.6% for AGIs $50k-75k, 0.3% for AGIs $75k-100k, 0.5% for AGIs over 100k)
Net capital gain/loss: +$891 (reported on 19.2% of returns)
Here:
+$891
State:
+$17,321
(% of AGI for various income ranges: 0.5% for AGIs $10k-25k, 0.1% for AGIs $25k-50k, -0.2% for AGIs $50k-75k, 0.2% for AGIs $75k-100k, 1.0% for AGIs over 100k)
Profit/loss from business: +$10,041 (reported on 12.7% of returns)
Here:
+$10,041
State:
+$11,771
(% of AGI for various income ranges: 3.2% for AGIs $10k-25k, 4.1% for AGIs $25k-50k, 2.5% for AGIs $50k-75k, 0.2% for AGIs $75k-100k, 3.3% for AGIs over 100k)
IRA payment deduction: $2,591 (reported on 2.9% of returns)
62554:
$2,591
Illinois:
$3,087
Total itemized deductions: $15,932 (19% of AGI, reported on 29.0% of returns)
Here:
$15,932
State:
$20,239
Here:
19.1% of AGI
State:
19.5% of AGI
(% of AGI for various income ranges: 9.6% for AGIs $10k-25k, 8.2% for AGIs $25k-50k, 8.9% for AGIs $50k-75k, 9.4% for AGIs $75k-100k, 11.2% for AGIs over 100k)
Charity contributions deductions: $3,612 (4% of AGI, reported on 23.9% of returns)
Here:
$3,612
State:
$3,719
Here:
4.1% of AGI
State:
3.4% of AGI
(% of AGI for various income ranges: 0.8% for AGIs $10k-25k, 1.2% for AGIs $25k-50k, 1.6% for AGIs $50k-75k, 1.6% for AGIs $75k-100k, 2.7% for AGIs over 100k)
Total tax: $6,423 (reported on 83.4% of returns)
62554:
$6,423
State:
$9,882
(% of AGI for various income ranges: 1.2% for AGIs below $10k, 4.4% for AGIs $10k-25k, 7.4% for AGIs $25k-50k, 8.8% for AGIs $50k-75k, 10.6% for AGIs $75k-100k, 17.1% for AGIs over 100k)
Earned income credit: $1,596 (reported on 6.8% of returns)
Here:
$1,596
State:
$1,788
Percentage of individuals using paid preparers for their 2004 taxes: 55.8%
Here:
56%
State:
61%
(% for various income ranges: 39.7% for AGIs below $10k, 57.7% for AGIs $10k-25k, 60.2% for AGIs $25k-50k, 58.3% for AGIs $50k-75k, 61.3% for AGIs $75k-100k, 57.9% for AGIs over 100k)
Household received Food Stamps/SNAP in the past 12 months: 62 Household did not receive Food Stamps/SNAP in the past 12 months: 595
Women who had a birth in the past 12 months: 114 (114 now married, 0 unmarried) Women who did not have a birth in the past 12 months: 332 (146 now married, 185 unmarried)
Housing units in zip code 62554 with a mortgage: 415 (30 second mortgage, 6 home equity loan, 24 both second mortgage and home equity loan) Houses without a mortgage: 3
Median monthly owner costs for units with a mortgage: $1,293 Median monthly owner costs for units without a mortgage: $511
Residents with income below the poverty level in 2022:
This zip code:
2.9%
Whole state:
11.9%
Residents with income below 50% of the poverty level in 2022:
This zip code:
2.7%
Whole state:
5.7%
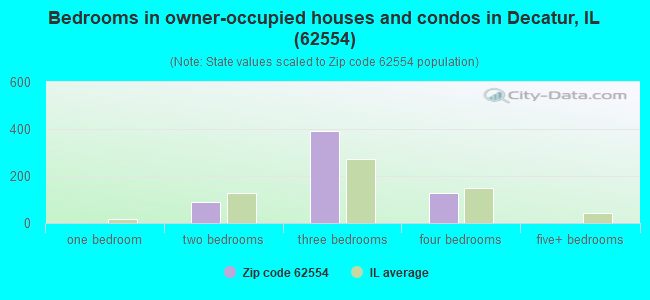
Median number of rooms in houses and condos:
Here:
6.3
State:
6.4
Median number of rooms in apartments:
Here:
3.2
State:
4.1
Notable locations in this zip code not listed on our city pages
Size of family households: 212 2-persons, 186 3-persons, 123 4-persons, 15 5-persons, 3 6-persons
Size of nonfamily households: 101 1-person, 15 2-persons
322 married couples with children.
45 single-parent households (3 men, 42 women).
96.0% of residents of 62554 zip code speak English at home.
0.5% of residents speak Spanish at home (38% very well, 62% well).
2.2% of residents speak other Indo-European language at home (85% very well, 15% well).
0.5% of residents speak Asian or Pacific Island language at home (100% well).
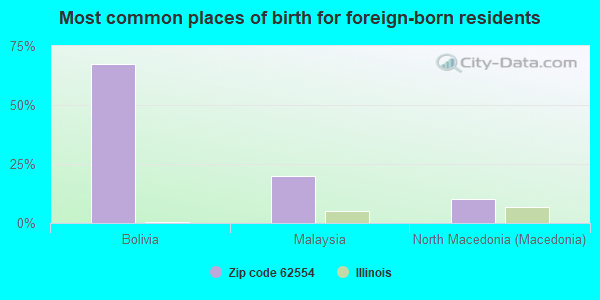
Foreign born population: 40 (2.4%) (77.6% of them are naturalized citizens)
This zip code:
2.4%
Whole state:
14.4%
68%Bolivia
20%Malaysia
10%North Macedonia (Macedonia)
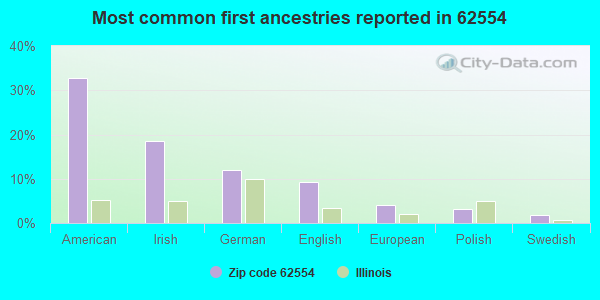
33%American
18%Irish
12%German
9%English
4%European
3%Polish
2%Swedish
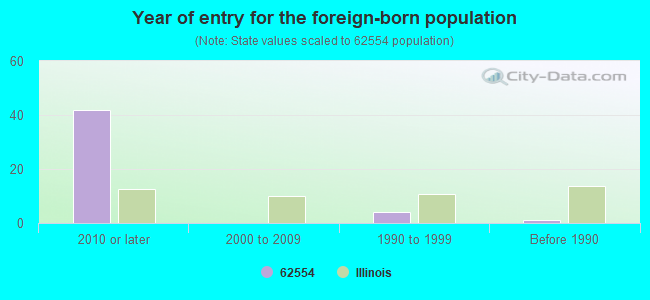
Year of entry for the foreign-born population
422010 or later
02000 to 2009
41990 to 1999
1Before 1990
Facilities with environmental interests located in this zip code:
ARGENTA-OREANA MIDDLE SCHOOL (400 WEST SOUTH STREET in OREANA, IL)
STATE MASTER (Illinois EPA Project) - National Pollutant Discharge Elimination System Permit National Pollutant Discharge Elimination System NON-MAJOR (Tracking pollutant discharge elimination systems) - permit National Pollutant Discharge Elimination System NON-MAJOR (Tracking pollutant discharge elimination systems) - permit Business SIC classification: ELEMENTARY AND SECONDARY SCHOOLS
OREANA WTP (600 NE STREET in OREANA, IL)
STATE MASTER (Illinois EPA Project) - National Pollutant Discharge Elimination System Permit National Pollutant Discharge Elimination System NON-MAJOR (Tracking pollutant discharge elimination systems) - permit Business SIC classification: WATER SUPPLY Alternative names: OREANA WTP, CITY OF
ARGENTA-OREANA ELEMENTARY SCHOOL (400 W SOUTH ST in OREANA, IL)
(National Center for Education Statistics) - STATE ID-3905500102002 Organizations: ARGENTA-OREANA COMM UNIT SCH D 1 (SCHOOL DISTRICT)
OREANA WATER TOWER (100 BOWER in OREANA, IL)
Small Quantity Generators, between 100 kg and 1000 kg of hazardous waste/month (Resource Conservation and Recovery Act (tracking hazardous waste)) - notification Organizations: VILLAGE OF OREANA (CONTACT/OWNER)
DELS SUNOCO GAS STATION (311 S HWY 48 in OREANA, IL)
Small Quantity Generators, between 100 kg and 1000 kg of hazardous waste/month (Resource Conservation and Recovery Act (tracking hazardous waste)) - notification Organizations: WESTERMAN DON (CONTACT/OWNER)
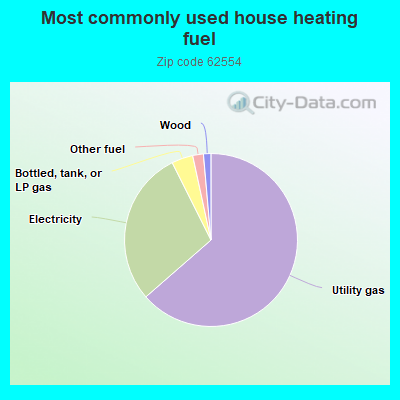
63.7%Utility gas
29.1%Electricity
4.0%Bottled, tank, or LP gas
2.0%Other fuel
1.4%Wood
Population in 1990: 1,554. Population change in the 1990s: +156 (+10.0%).
Place of birth for U.S.-born residents:
This state: 1,487
Northeast: 18
Midwest: 80
South: 37
West: 30
73% of the 62554 zip code residents lived in the same house 5 years ago. Out of people who lived in different houses, 72% lived in this county. Out of people who lived in different counties, 50% lived in Illinois.
95% of the 62554 zip code residents lived in the same house 1 year ago. Out of people who lived in different houses, 49% moved from this county. Out of people who lived in different houses, 51% moved from different county within same state.
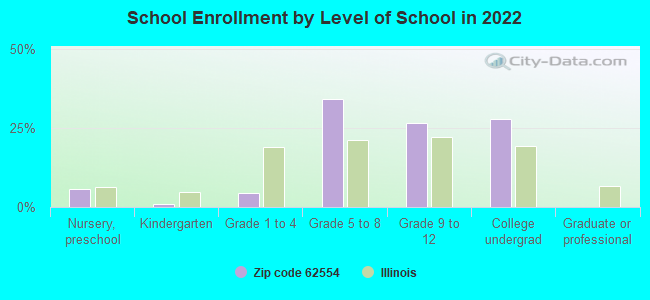
Private vs. public school enrollment:
Students in private schools in grades 1 to 8 (elementary and middle school): 8
Here:
5.9%
Illinois:
13.3%
Students in private schools in grades 9 to 12 (high school): 3
Here:
4.1%
Illinois:
9.9%
Students in private undergraduate colleges: 38
Here:
37.3%
Illinois:
27.4%
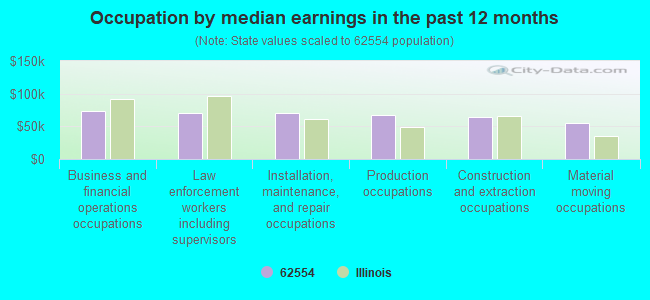
Occupation by median earnings in the past 12 months ($)
72,820Business and financial operations occupations
71,065Law enforcement workers including supervisors
69,713Installation, maintenance, and repair occupations
66,823Production occupations
63,649Construction and extraction occupations
54,658Material moving occupations
Top industries in this zip code by the number of employees in 2005:
Construction: Commercial and Institutional Building Construction (20-49 employees: 1 establishment, 1-4 employees: 1 establishment)
Wholesale Trade: Stationery and Office Supplies Merchant Wholesalers (5-9: 1)
Other Services (except Public Administration): Car Washes (5-9: 1)
Health Care and Social Assistance: Other Individual and Family Services (1-4: 1)
Construction: Plumbing, Heating, and Air-Conditioning Contractors (1-4: 1)
Professional, Scientific, and Technical Services: Administrative Management and General Management Consulting Services (1-4: 1)
Administrative and Support and Waste Management and Remediation Services: Office Administrative Services (1-4: 1)
Home Mortgage Disclosure Act Aggregated Statistics For Year 2009 (Based on 2 partial tracts)
A) FHA, FSA/RHS & VA Home Purchase Loans
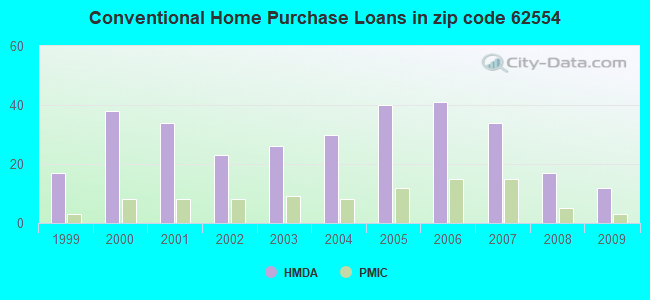
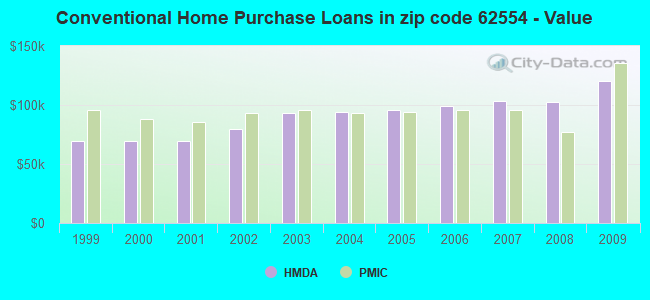
B) Conventional Home Purchase Loans
C) Refinancings
D) Home Improvement Loans
F) Non-occupant Loans on < 5 Family Dwellings (A B C & D)
Number
Average Value
Number
Average Value
Number
Average Value
Number
Average Value
Number
Average Value
LOANS ORIGINATED
10
$96,534
12
$120,152
58
$141,053
4
$67,012
4
$47,912
APPLICATIONS APPROVED, NOT ACCEPTED
0
$0
0
$0
3
$128,947
0
$0
0
$0
APPLICATIONS DENIED
2
$59,615
1
$104,660
15
$108,192
1
$11,920
0
$0
APPLICATIONS WITHDRAWN
1
$132,920
1
$56,970
9
$109,909
1
$67,120
0
$0
FILES CLOSED FOR INCOMPLETENESS
0
$0
0
$0
1
$95,390
0
$0
0
$0
Aggregated Statistics For Year 2008 (Based on 2 partial tracts)
A) FHA, FSA/RHS & VA Home Purchase Loans
B) Conventional Home Purchase Loans
C) Refinancings
D) Home Improvement Loans
F) Non-occupant Loans on < 5 Family Dwellings (A B C & D)
G) Loans On Manufactured Home Dwelling (A B C & D)
Number
Average Value
Number
Average Value
Number
Average Value
Number
Average Value
Number
Average Value
Number
Average Value
LOANS ORIGINATED
12
$94,208
17
$102,867
26
$139,749
6
$63,958
6
$44,748
0
$0
APPLICATIONS APPROVED, NOT ACCEPTED
0
$0
1
$68,890
4
$172,445
1
$121,440
0
$0
0
$0
APPLICATIONS DENIED
0
$0
2
$102,230
13
$123,172
7
$43,656
0
$0
1
$100,680
APPLICATIONS WITHDRAWN
1
$124,970
1
$90,970
7
$111,851
0
$0
0
$0
0
$0
FILES CLOSED FOR INCOMPLETENESS
0
$0
0
$0
3
$190,183
0
$0
0
$0
0
$0
Aggregated Statistics For Year 2007 (Based on 2 partial tracts)
A) FHA, FSA/RHS & VA Home Purchase Loans
B) Conventional Home Purchase Loans
C) Refinancings
D) Home Improvement Loans
F) Non-occupant Loans on < 5 Family Dwellings (A B C & D)
G) Loans On Manufactured Home Dwelling (A B C & D)
Number
Average Value
Number
Average Value
Number
Average Value
Number
Average Value
Number
Average Value
Number
Average Value
LOANS ORIGINATED
7
$94,566
34
$103,166
27
$124,139
6
$61,015
6
$77,353
1
$108,630
APPLICATIONS APPROVED, NOT ACCEPTED
0
$0
1
$160,740
3
$114,373
1
$77,280
0
$0
0
$0
APPLICATIONS DENIED
0
$0
4
$64,585
26
$83,615
12
$52,256
0
$0
1
$30,910
APPLICATIONS WITHDRAWN
0
$0
2
$49,240
15
$112,520
2
$158,975
1
$58,730
0
$0
FILES CLOSED FOR INCOMPLETENESS
0
$0
0
$0
2
$139,985
0
$0
0
$0
0
$0
Aggregated Statistics For Year 2006 (Based on 2 partial tracts)
A) FHA, FSA/RHS & VA Home Purchase Loans
B) Conventional Home Purchase Loans
C) Refinancings
D) Home Improvement Loans
F) Non-occupant Loans on < 5 Family Dwellings (A B C & D)
G) Loans On Manufactured Home Dwelling (A B C & D)
Number
Average Value
Number
Average Value
Number
Average Value
Number
Average Value
Number
Average Value
Number
Average Value
LOANS ORIGINATED
8
$78,936
41
$99,328
26
$91,904
6
$37,757
4
$51,005
1
$78,160
APPLICATIONS APPROVED, NOT ACCEPTED
0
$0
7
$83,021
4
$83,242
0
$0
0
$0
0
$0
APPLICATIONS DENIED
0
$0
7
$63,780
23
$84,365
5
$43,806
1
$31,800
1
$31,800
APPLICATIONS WITHDRAWN
0
$0
3
$146,610
19
$107,890
0
$0
0
$0
0
$0
FILES CLOSED FOR INCOMPLETENESS
0
$0
0
$0
4
$83,130
1
$22,960
0
$0
0
$0
Aggregated Statistics For Year 2005 (Based on 2 partial tracts)
A) FHA, FSA/RHS & VA Home Purchase Loans
B) Conventional Home Purchase Loans
C) Refinancings
D) Home Improvement Loans
F) Non-occupant Loans on < 5 Family Dwellings (A B C & D)
G) Loans On Manufactured Home Dwelling (A B C & D)
Number
Average Value
Number
Average Value
Number
Average Value
Number
Average Value
Number
Average Value
Number
Average Value
LOANS ORIGINATED
5
$75,956
40
$95,540
31
$95,015
10
$64,739
5
$51,756
0
$0
APPLICATIONS APPROVED, NOT ACCEPTED
1
$60,060
0
$0
10
$87,084
0
$0
0
$0
1
$87,000
APPLICATIONS DENIED
0
$0
8
$44,546
25
$81,378
4
$16,230
0
$0
4
$25,282
APPLICATIONS WITHDRAWN
0
$0
2
$108,855
19
$105,775
1
$169,130
0
$0
0
$0
FILES CLOSED FOR INCOMPLETENESS
0
$0
1
$91,850
6
$96,858
0
$0
0
$0
0
$0
Aggregated Statistics For Year 2004 (Based on 2 partial tracts)
A) FHA, FSA/RHS & VA Home Purchase Loans
B) Conventional Home Purchase Loans
C) Refinancings
D) Home Improvement Loans
F) Non-occupant Loans on < 5 Family Dwellings (A B C & D)
G) Loans On Manufactured Home Dwelling (A B C & D)
Number
Average Value
Number
Average Value
Number
Average Value
Number
Average Value
Number
Average Value
Number
Average Value
LOANS ORIGINATED
9
$73,747
30
$94,061
53
$95,735
8
$44,050
5
$69,154
1
$17,220
APPLICATIONS APPROVED, NOT ACCEPTED
0
$0
2
$94,725
9
$84,002
0
$0
0
$0
0
$0
APPLICATIONS DENIED
0
$0
9
$54,414
29
$79,077
4
$31,242
1
$78,600
3
$15,750
APPLICATIONS WITHDRAWN
0
$0
1
$36,210
17
$89,801
0
$0
0
$0
0
$0
FILES CLOSED FOR INCOMPLETENESS
0
$0
0
$0
0
$0
0
$0
0
$0
0
$0
Aggregated Statistics For Year 2003 (Based on 2 partial tracts)
A) FHA, FSA/RHS & VA Home Purchase Loans
B) Conventional Home Purchase Loans
C) Refinancings
D) Home Improvement Loans
F) Non-occupant Loans on < 5 Family Dwellings (A B C & D)
Number
Average Value
Number
Average Value
Number
Average Value
Number
Average Value
Number
Average Value
LOANS ORIGINATED
10
$66,637
26
$93,382
115
$88,040
8
$19,982
4
$35,660
APPLICATIONS APPROVED, NOT ACCEPTED
0
$0
1
$41,950
9
$71,049
0
$0
0
$0
APPLICATIONS DENIED
0
$0
3
$93,620
21
$72,654
4
$7,950
0
$0
APPLICATIONS WITHDRAWN
0
$0
1
$168,690
19
$74,561
0
$0
0
$0
FILES CLOSED FOR INCOMPLETENESS
0
$0
1
$84,350
1
$57,410
0
$0
0
$0
Aggregated Statistics For Year 2002 (Based on 2 partial tracts)
A) FHA, FSA/RHS & VA Home Purchase Loans
B) Conventional Home Purchase Loans
C) Refinancings
D) Home Improvement Loans
F) Non-occupant Loans on < 5 Family Dwellings (A B C & D)
Number
Average Value
Number
Average Value
Number
Average Value
Number
Average Value
Number
Average Value
LOANS ORIGINATED
9
$74,483
23
$79,430
76
$91,551
9
$29,293
5
$48,752
APPLICATIONS APPROVED, NOT ACCEPTED
0
$0
1
$95,390
6
$108,118
1
$2,650
0
$0
APPLICATIONS DENIED
0
$0
6
$32,825
24
$77,409
3
$30,030
0
$0
APPLICATIONS WITHDRAWN
0
$0
1
$109,960
9
$71,244
0
$0
0
$0
FILES CLOSED FOR INCOMPLETENESS
0
$0
0
$0
2
$93,400
0
$0
0
$0
Aggregated Statistics For Year 2001 (Based on 2 partial tracts)
A) FHA, FSA/RHS & VA Home Purchase Loans
B) Conventional Home Purchase Loans
C) Refinancings
D) Home Improvement Loans
F) Non-occupant Loans on < 5 Family Dwellings (A B C & D)
Number
Average Value
Number
Average Value
Number
Average Value
Number
Average Value
Number
Average Value
LOANS ORIGINATED
11
$63,831
34
$69,305
71
$72,205
7
$13,121
3
$45,633
APPLICATIONS APPROVED, NOT ACCEPTED
0
$0
2
$75,295
7
$72,486
0
$0
0
$0
APPLICATIONS DENIED
0
$0
8
$30,581
27
$65,717
7
$7,823
1
$35,330
APPLICATIONS WITHDRAWN
0
$0
1
$68,890
8
$53,875
0
$0
0
$0
FILES CLOSED FOR INCOMPLETENESS
0
$0
0
$0
3
$52,110
0
$0
0
$0
Aggregated Statistics For Year 2000 (Based on 2 partial tracts)
A) FHA, FSA/RHS & VA Home Purchase Loans
B) Conventional Home Purchase Loans
C) Refinancings
D) Home Improvement Loans
F) Non-occupant Loans on < 5 Family Dwellings (A B C & D)
Number
Average Value
Number
Average Value
Number
Average Value
Number
Average Value
Number
Average Value
LOANS ORIGINATED
5
$64,208
38
$69,587
21
$61,004
7
$9,463
1
$33,560
APPLICATIONS APPROVED, NOT ACCEPTED
0
$0
3
$62,560
6
$49,092
3
$37,093
0
$0
APPLICATIONS DENIED
1
$87,000
13
$36,449
20
$50,453
8
$9,550
1
$22,520
APPLICATIONS WITHDRAWN
0
$0
1
$71,100
7
$45,863
1
$13,250
0
$0
FILES CLOSED FOR INCOMPLETENESS
0
$0
0
$0
1
$74,630
0
$0
0
$0
Aggregated Statistics For Year 1999 (Based on 1 partial tract)
A) FHA, FSA/RHS & VA Home Purchase Loans
B) Conventional Home Purchase Loans
C) Refinancings
D) Home Improvement Loans
F) Non-occupant Loans on < 5 Family Dwellings (A B C & D)
Detailed PMIC statistics for the following Tracts:0022.00
2002 - 2018 National Fire Incident Reporting System (NFIRS) incidents
According to the data from the years 2002 - 2018 the average number of fire incidents per year is 8. The highest number of fire incidents - 16 took place in 2003, and the least - 2 in 2005. The data has a growing trend.
When looking into fire subcategories, the most reports belonged to: Structure Fires (39.8%), and Other (29.3%).
Fire incident types reported to NFIRS in Zip Code 62554

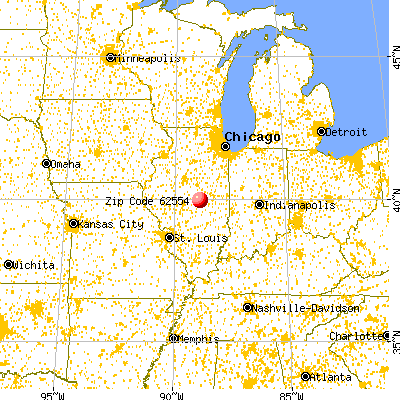


 Nearest zip codes: 62501, 62535, 62526, 62523, 61756, 62521.


 According to the data from the years 2002 - 2018 the average number of fire incidents per year is 8. The highest number of fire incidents - 16 took place in 2003, and the least - 2 in 2005. The data has a growing trend.
 When looking into fire subcategories, the most reports belonged to: Structure Fires (39.8%), and Other (29.3%).