Estimated zip code population in 2022: 28,384 Zip code population in 2010: 26,413 Zip code population in 2000: 23,221
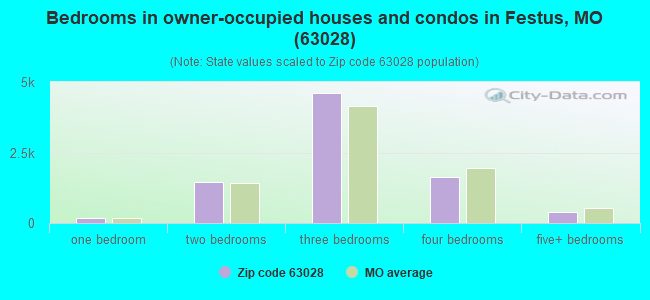
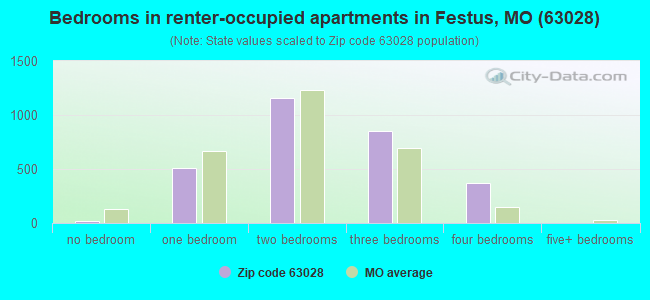
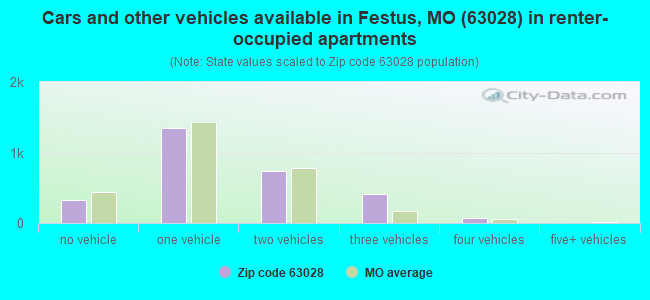
Houses and condos: 11,735 Renter-occupied apartments: 2,912
% of renters here:
26%
State:
32%
March 2022 cost of living index in zip code 63028: 95.4 (near average, U.S. average is 100)
Land area: 122.3 sq. mi. Water area: 1.3 sq. mi.
Population density: 232 people per square mile
(very low).
OSM Map
General Map
Google Map
MSN Map
OSM Map
General Map
Google Map
MSN Map
OSM Map
General Map
Google Map
MSN Map
OSM Map
General Map
Google Map
MSN Map
Please wait while loading the map...
Real estate property taxes paid for housing units in 2022:
This zip code:
0.7% ($1,498)
Missouri:
0.8% ($1,810)
Median real estate property taxes paid for housing units with mortgages in 2022: $1,698 (0.7%) Median real estate property taxes paid for housing units with no mortgage in 2022: $1,237 (0.7%)
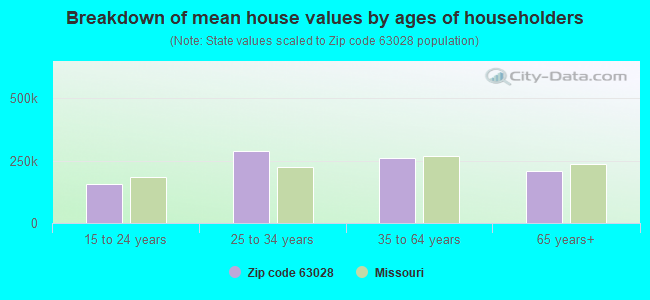
Estimated median house/condo value in 2022: $223,197
63028:
$223,197
Missouri:
$221,200
According to our research of Missouri and other state lists, there were 61 registered sex offenders living in 63028 zip code as of April 27, 2024. The ratio of all residents to sex offenders in zip code 63028 is 437 to 1. The ratio of registered sex offenders to all residents in this zip code is lower than the state average.
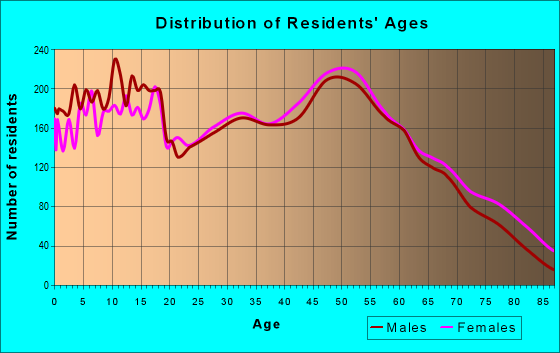
Median resident age:
This zip code:
40.4 years
Missouri median age:
39.1 years
Average household size:
This zip code:
2.5 people
Missouri:
2.4 people
Averages for the 2020 tax year for zip code 63028, filed in 2021:
Average Adjusted Gross Income (AGI) in 2020: $63,310 (Individual Income Tax Returns)
Here:
$63,310
State:
$68,151
Salary/wage: $56,527 (reported on 81.6% of returns)
Here:
$56,527
State:
$56,131
(% of AGI for various income ranges: 1140.5% for AGIs below $25k, 3459.1% for AGIs $25k-50k, 6115.1% for AGIs $50k-75k, 9109.8% for AGIs $75k-100k, 16988.9% for AGIs $100k-200k, 70715.0% for AGIs over 200k)
Taxable interest for individuals: $1,114 (reported on 28.9% of returns)
This zip code:
$1,114
Missouri:
$1,586
(% of AGI for various income ranges: 15.7% for AGIs below $25k, 20.6% for AGIs $25k-50k, 52.3% for AGIs $50k-75k, 56.9% for AGIs $75k-100k, 74.1% for AGIs $100k-200k, 823.3% for AGIs over 200k)
Ordinary dividends: $5,898 (reported on 18.0% of returns)
Here:
$5,898
State:
$10,947
(% of AGI for various income ranges: 24.4% for AGIs below $25k, 40.2% for AGIs $25k-50k, 101.0% for AGIs $50k-75k, 111.6% for AGIs $75k-100k, 200.3% for AGIs $100k-200k, 5963.3% for AGIs over 200k)
Net capital gain/loss in AGI: +$8,597 (reported on 15.2% of returns)
Here:
+$8,597
State:
+$18,453
(% of AGI for various income ranges: 7.9% for AGIs below $25k, 31.8% for AGIs $25k-50k, 73.1% for AGIs $50k-75k, 135.1% for AGIs $75k-100k, 371.1% for AGIs $100k-200k, 7440.8% for AGIs over 200k)
Profit/loss from business: +$11,248 (reported on 12.9% of returns)
Here:
+$11,248
State:
+$12,260
(% of AGI for various income ranges: 82.4% for AGIs below $25k, 93.4% for AGIs $25k-50k, 120.4% for AGIs $50k-75k, 211.9% for AGIs $75k-100k, 343.0% for AGIs $100k-200k, 4940.0% for AGIs over 200k)
Taxable individual retirement arrangement distribution: $18,963 (reported on 9.8% of returns)
63028:
$18,963
Missouri:
$19,719
(% of AGI for various income ranges: 54.2% for AGIs below $25k, 117.0% for AGIs $25k-50k, 267.1% for AGIs $50k-75k, 333.3% for AGIs $75k-100k, 686.1% for AGIs $100k-200k, 3240.8% for AGIs over 200k)
Self-employed (Keogh) retirement plans: $29,167 (reported on 0.2% of returns)
63028:
$29,167
Missouri:
$24,851
(% of AGI for various income ranges: 729.2% for AGIs over 200k)
Total itemized deductions: $31,187 (reported on 5.2% of returns)
Here:
$31,187
State:
$36,651
(% of AGI for various income ranges: 35.4% for AGIs below $25k, 72.1% for AGIs $25k-50k, 169.4% for AGIs $50k-75k, 212.6% for AGIs $75k-100k, 519.1% for AGIs $100k-200k, 5922.5% for AGIs over 200k)
Charity contributions: $9,644 (reported on 4.1% of returns)
Here:
$9,644
State:
$15,671
(% of AGI for various income ranges: 12.1% for AGIs $25k-50k, 20.0% for AGIs $50k-75k, 41.4% for AGIs $75k-100k, 136.4% for AGIs $100k-200k, 2050.0% for AGIs over 200k)
Taxes paid: $7,559 (reported on 5.1% of returns)
63028:
$7,559
State:
$7,608
(% of AGI for various income ranges: 2.9% for AGIs below $25k, 10.1% for AGIs $25k-50k, 36.7% for AGIs $50k-75k, 56.9% for AGIs $75k-100k, 158.8% for AGIs $100k-200k, 1304.2% for AGIs over 200k)
Earned income credit: $2,157 (reported on 14.7% of returns)
Here:
$2,157
State:
$2,315
(% of AGI for various income ranges: 83.9% for AGIs below $25k, 65.8% for AGIs $25k-50k, 1.7% for AGIs $50k-75k)
Percentage of individuals using paid preparers for their 2020 taxes: 93.7%
Here:
94%
State:
93%
(% for various income ranges: 93.4% for AGIs below $25k, 93.7% for AGIs $25k-50k, 94.2% for AGIs $50k-75k, 93.7% for AGIs $75k-100k, 94.5% for AGIs $100k-200k, 90.2% for AGIs over 200k)
Averages for the 2012 tax year for zip code 63028, filed in 2013:
Average Adjusted Gross Income (AGI) in 2012: $51,102 (Individual Income Tax Returns)
Here:
$51,102
State:
$55,896
Salary/wage: $46,076 (reported on 84.7% of returns)
Here:
$46,076
State:
$46,205
(% of AGI for various income ranges: 73.2% for AGIs below $25k, 76.8% for AGIs $25k-50k, 77.8% for AGIs $50k-75k, 81.0% for AGIs $75k-100k, 79.8% for AGIs $100k-200k, 60.7% for AGIs over 200k)
Taxable interest for individuals: $950 (reported on 32.9% of returns)
This zip code:
$950
Missouri:
$1,559
(% of AGI for various income ranges: 1.2% for AGIs below $25k, 0.7% for AGIs $25k-50k, 0.6% for AGIs $50k-75k, 0.5% for AGIs $75k-100k, 0.4% for AGIs $100k-200k, 0.6% for AGIs over 200k)
Ordinary dividends: $3,069 (reported on 19.1% of returns)
Here:
$3,069
State:
$7,410
(% of AGI for various income ranges: 1.7% for AGIs below $25k, 1.1% for AGIs $25k-50k, 0.9% for AGIs $50k-75k, 0.9% for AGIs $75k-100k, 1.1% for AGIs $100k-200k, 1.8% for AGIs over 200k)
Net capital gain/loss in AGI: +$3,095 (reported on 13.9% of returns)
Here:
+$3,095
State:
+$11,579
(% of AGI for various income ranges: 0.4% for AGIs $25k-50k, 0.2% for AGIs $50k-75k, 0.5% for AGIs $75k-100k, 0.7% for AGIs $100k-200k, 4.5% for AGIs over 200k)
Profit/loss from business: +$10,646 (reported on 12.2% of returns)
Here:
+$10,646
State:
+$11,688
(% of AGI for various income ranges: 5.1% for AGIs below $25k, 2.0% for AGIs $25k-50k, 2.0% for AGIs $50k-75k, 1.0% for AGIs $75k-100k, 1.7% for AGIs $100k-200k, 6.5% for AGIs over 200k)
Taxable individual retirement arrangement distribution: $14,344 (reported on 10.3% of returns)
63028:
$14,344
Missouri:
$14,773
(% of AGI for various income ranges: 3.4% for AGIs below $25k, 2.6% for AGIs $25k-50k, 2.6% for AGIs $50k-75k, 2.7% for AGIs $75k-100k, 3.2% for AGIs $100k-200k, 3.0% for AGIs over 200k)
Self-employment retirement plans: $17,733 (reported on 0.3% of returns)
63028:
$17,733
Missouri:
$20,502
(% of AGI for various income ranges: 0.3% for AGIs $100k-200k)
Total itemized deductions: $19,285 (20% of AGI, reported on 31.0% of returns)
Here:
$19,285
State:
$22,730
Here:
20.4% of AGI
State:
19.2% of AGI
(% of AGI for various income ranges: 6.9% for AGIs below $25k, 9.2% for AGIs $25k-50k, 10.9% for AGIs $50k-75k, 12.7% for AGIs $75k-100k, 13.9% for AGIs $100k-200k, 13.6% for AGIs over 200k)
Charity contributions: $3,176 (reported on 23.3% of returns)
Here:
$3,176
State:
$4,745
(% of AGI for various income ranges: 0.6% for AGIs below $25k, 0.9% for AGIs $25k-50k, 1.1% for AGIs $50k-75k, 1.3% for AGIs $75k-100k, 1.7% for AGIs $100k-200k, 3.0% for AGIs over 200k)
Taxes paid: $6,225 (reported on 31.0% of returns)
63028:
$6,225
State:
$8,399
(% of AGI for various income ranges: 1.0% for AGIs below $25k, 1.9% for AGIs $25k-50k, 2.9% for AGIs $50k-75k, 4.0% for AGIs $75k-100k, 5.4% for AGIs $100k-200k, 5.9% for AGIs over 200k)
Earned income credit: $2,143 (reported on 16.9% of returns)
Here:
$2,143
State:
$2,288
(% of AGI for various income ranges: 5.9% for AGIs below $25k, 1.1% for AGIs $25k-50k)
Percentage of individuals using paid preparers for their 2012 taxes: 56.7%
Here:
57%
State:
55%
(% for various income ranges: 52.0% for AGIs below $25k, 55.5% for AGIs $25k-50k, 61.4% for AGIs $50k-75k, 60.0% for AGIs $75k-100k, 62.6% for AGIs $100k-200k, 78.9% for AGIs over 200k)
Averages for the 2004 tax year for zip code 63028, filed in 2005:
Average Adjusted Gross Income (AGI) in 2004: $43,343 (Individual Income Tax Returns)
Here:
$43,343
State:
$44,591
Salary/wage: $39,544 (reported on 87.7% of returns)
Here:
$39,544
State:
$38,941
(% of AGI for various income ranges: 97.0% for AGIs below $10k, 76.0% for AGIs $10k-25k, 81.6% for AGIs $25k-50k, 83.8% for AGIs $50k-75k, 86.7% for AGIs $75k-100k, 70.1% for AGIs over 100k)
Taxable interest for individuals: $1,196 (reported on 43.8% of returns)
This zip code:
$1,196
Missouri:
$1,801
(% of AGI for various income ranges: 3.8% for AGIs below $10k, 2.6% for AGIs $10k-25k, 1.1% for AGIs $25k-50k, 1.2% for AGIs $50k-75k, 0.6% for AGIs $75k-100k, 1.1% for AGIs over 100k)
Taxable dividends: $1,887 (reported on 22.8% of returns)
Here:
$1,887
State:
$3,677
(% of AGI for various income ranges: 2.3% for AGIs below $10k, 1.7% for AGIs $10k-25k, 1.0% for AGIs $25k-50k, 0.7% for AGIs $50k-75k, 0.8% for AGIs $75k-100k, 1.1% for AGIs over 100k)
Net capital gain/loss: +$5,727 (reported on 17.0% of returns)
Here:
+$5,727
State:
+$8,915
(% of AGI for various income ranges: -0.3% for AGIs below $10k, -0.1% for AGIs $10k-25k, 0.6% for AGIs $25k-50k, 0.6% for AGIs $50k-75k, 1.0% for AGIs $75k-100k, 7.1% for AGIs over 100k)
Profit/loss from business: +$8,076 (reported on 12.8% of returns)
Here:
+$8,076
State:
+$9,793
(% of AGI for various income ranges: 4.0% for AGIs below $10k, 3.9% for AGIs $10k-25k, 2.6% for AGIs $25k-50k, 1.5% for AGIs $50k-75k, 1.5% for AGIs $75k-100k, 3.1% for AGIs over 100k)
IRA payment deduction: $3,009 (reported on 2.0% of returns)
63028:
$3,009
Missouri:
$2,972
(% of AGI for various income ranges: 0.1% for AGIs $10k-25k, 0.2% for AGIs $25k-50k, 0.1% for AGIs $50k-75k, 0.1% for AGIs $75k-100k, 0.1% for AGIs over 100k)
Self-employed pension: $12,587 (reported on 0.4% of returns)
Here:
$12,587
Missouri:
$14,365
(% of AGI for various income ranges: 0.1% for AGIs $10k-25k, 0.1% for AGIs $50k-75k, 0.3% for AGIs over 100k)
Total itemized deductions: $15,892 (21% of AGI, reported on 33.2% of returns)
Here:
$15,892
State:
$18,261
Here:
20.7% of AGI
State:
20.5% of AGI
(% of AGI for various income ranges: 6.3% for AGIs below $10k, 7.1% for AGIs $10k-25k, 10.1% for AGIs $25k-50k, 12.6% for AGIs $50k-75k, 14.8% for AGIs $75k-100k, 13.7% for AGIs over 100k)
Charity contributions deductions: $2,354 (3% of AGI, reported on 27.3% of returns)
Here:
$2,354
State:
$3,665
Here:
2.9% of AGI
State:
3.9% of AGI
(% of AGI for various income ranges: 0.3% for AGIs below $10k, 0.7% for AGIs $10k-25k, 1.1% for AGIs $25k-50k, 1.3% for AGIs $50k-75k, 1.7% for AGIs $75k-100k, 2.2% for AGIs over 100k)
Total tax: $5,471 (reported on 76.8% of returns)
63028:
$5,471
State:
$6,999
(% of AGI for various income ranges: 2.5% for AGIs below $10k, 4.0% for AGIs $10k-25k, 6.5% for AGIs $25k-50k, 8.2% for AGIs $50k-75k, 9.7% for AGIs $75k-100k, 16.3% for AGIs over 100k)
Earned income credit: $1,611 (reported on 13.9% of returns)
Here:
$1,611
State:
$1,728
Percentage of individuals using paid preparers for their 2004 taxes: 62.3%
Here:
62%
State:
62%
(% for various income ranges: 52.3% for AGIs below $10k, 62.3% for AGIs $10k-25k, 63.6% for AGIs $25k-50k, 67.9% for AGIs $50k-75k, 63.1% for AGIs $75k-100k, 71.7% for AGIs over 100k)
Likely homosexual households (counted as self-reported same-sex unmarried-partner households)
Lesbian couples: 0.2% of all households
Gay men: 0.0% of all households
Household received Food Stamps/SNAP in the past 12 months: 792 Household did not receive Food Stamps/SNAP in the past 12 months: 10,436
Women who had a birth in the past 12 months: 259 (170 now married, 90 unmarried) Women who did not have a birth in the past 12 months: 5,860 (2,970 now married, 2,877 unmarried)
Housing units in zip code 63028 with a mortgage: 4,947 (295 second mortgage, 306 both second mortgage and home equity loan) Houses without a mortgage: 78
Median monthly owner costs for units with a mortgage: $1,392 Median monthly owner costs for units without a mortgage: $426
Residents with income below the poverty level in 2022:
This zip code:
8.4%
Whole state:
13.2%
Residents with income below 50% of the poverty level in 2022:
This zip code:
3.1%
Whole state:
6.8%
Median number of rooms in houses and condos:
Here:
6.1
State:
6.4
Median number of rooms in apartments:
Here:
4.7
State:
4.4
Notable locations in this zip code not listed on our city pages
Notable locations in zip code 63028: Selma (A), Rush Tower (B), Jefferson R - 7 Fire Protection District (C), Hematite Fire Protection District Station 2 (D), Festus Fire Department (E), Mapaville Fire Protection District (F), Hematite Fire Protection District (G). Display/hide their locations on the map
Churches in zip code 63028 include: Fairview Church (A), Old Plattin Church (B), Telegraph Church (C), Wesley Church (D), Charter Church (E). Display/hide their locations on the map
Cemeteries: Donnell Cemetery (1), Griffin Cemetery (2), Lucas Cemetery (3), Madison Cemetery (4), McClain Cemetery (5), McCormack Cemetery (6), McMullen Cemetery (7). Display/hide their locations on the map
Lakes and reservoirs: Hardys Lake (A), Harrison Lake (B), Lake Virginia (C), River Cement Company Lake (D), North Lake - Selma (E), Conservation Club Lake (F), Williams Lake (G). Display/hide their locations on the map
Streams, rivers, and creeks: Dry Creek (A), Buck Creek (B), Muddy Creek (C), Dry Fork (D), Joachim Creek (E), Plattin Creek (F), Little Creek (G), Rocky Branch (H), Haverstick Creek (I). Display/hide their locations on the map
In group quarters: 364 (-1 institutionalized population)
Size of family households: 3,412 2-persons, 1,802 3-persons, 1,484 4-persons, 697 5-persons, 226 6-persons, 85 7-or-more-persons
Size of nonfamily households: 2,892 1-person, 546 2-persons, 48 3-persons
4,642 married couples with children.
1,383 single-parent households (594 men, 789 women).
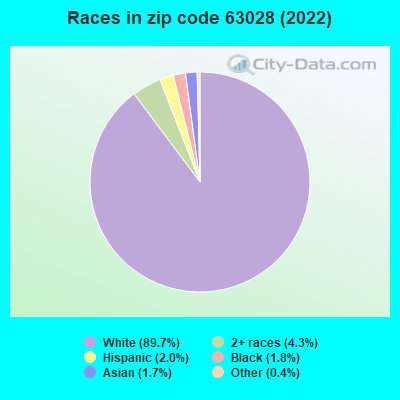
98.4% of residents of 63028 zip code speak English at home.
0.3% of residents speak Spanish at home (82% very well, 13% not well, 5% not at all).
0.2% of residents speak other Indo-European language at home (48% very well, 52% well).
0.7% of residents speak Asian or Pacific Island language at home (74% very well, 9% well, 16% not well).
0.3% of residents speak other language at home (49% very well, 51% well).
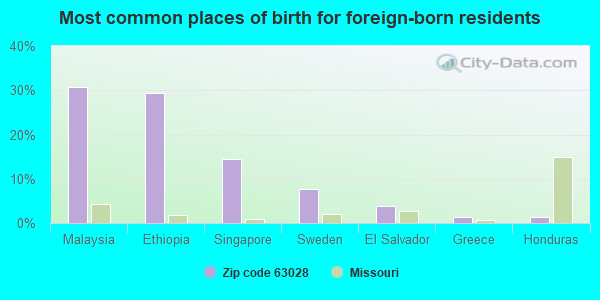
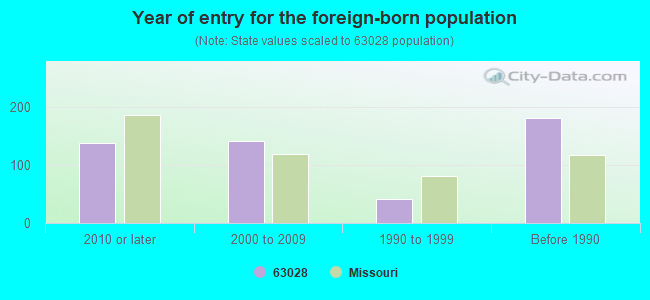
Foreign born population: 365 (1.3%) (77.7% of them are naturalized citizens)
Major facilities with environmental interests located in this zip code:
RIVER CEMENT COMPANY (1000 RIVER CEMENT ROAD in FESTUS, MO)
AIR MAJOR (AIRS/AFS) (Integrated Compliance Information System) - ICIS-07-1993-0413, FORMAL ENFORCEMENT ACTION, ICIS-07-1998-0057, ICIS-07-2003-0208, STATE MASTER (Missouri monitoring and compilance) - NEI-NTIMO0990002, AIR PROGRAM, RCRAINFO-MOD050232560, TSD, NEI-290990002, AIR PROGRAM, NET-290990002, ICIS-37600, ENFORCEMENT/COMPLIANCE ACTIVITY, TRIS-63028RVRCMSELMA, TRI REPORTER, NCDB-I07#20030514MO01T 1, COMPLIANCE ACTIVITY, PCS-MO0000035, NPDES NON-MAJOR, AIRS/AFS-MO0061591, AIR MAJOR, RCRAINFO-MOD050232560, CESQG, HAZARDOUS WASTE PROGRAM COMPLIANCE ACTIVITY (Tracking inspections of insecticide, fungicide, and rodenticide, and toxic substances) CRITERIA AND HAZARDOUS AIR POLLUTANT INVENTORY (Inventory of air pollution sources) National Pollutant Discharge Elimination System NON-MAJOR (Tracking pollutant discharge elimination systems) - permit Conditionally Exempt Small Quantity Generators, less than 100 kg/month of hazardous waste (Resource Conservation and Recovery Act (tracking hazardous waste)) HAZARDOUS WASTE BIENNIAL REPORTER (Resource Conservation and Recovery Act (tracking hazardous waste)) TSD (Resource Conservation and Recovery Act (tracking hazardous waste)) - notification TRI REPORTER (Tracking of toxic chemicals releasing facilities) Business SIC classification: CRUSHED AND BROKEN LIMESTONE; CEMENT, HYDRAULIC; CONCRETE PRODUCTS, EXCEPT BLOCK AND BRICK; REFUSE SYSTEMS Alternative names: BUZZI UNICEM USA - SELMA PLANT, RIVER CEMENT CO SELMA PLANT
RUSH ISLAND PLANT (100 BIG HOLLOW ROAD in FESTUS, MO)
AIR MAJOR (AIRS/AFS) AIR PROGRAM (Clean Air Markets Division Business System) STATE MASTER (Missouri monitoring and compilance) - NET-290990016, AIR PROGRAM, CAMDBS-6155, TRIS-63028RSHSL100BI, TRI REPORTER, PCS-MO0000043, NPDES MAJOR, AIRS/AFS-MO0061722, AIR MAJOR, RCRAINFO-MOD079888871, SQG, NEI-NTI12618, AIR PROGRAM, NTI-NTI12618, NEI-290990016, CRITERIA AND HAZARDOUS AIR POLLUTANT INVENTORY (Inventory of air pollution sources) National Pollutant Discharge Elimination System MAJOR (Tracking pollutant discharge elimination systems) - permit National Pollutant Discharge Elimination System NON-MAJOR (Tracking pollutant discharge elimination systems) - permit Small Quantity Generators, between 100 kg and 1000 kg of hazardous waste/month (Resource Conservation and Recovery Act (tracking hazardous waste)) - notification TRI REPORTER (Tracking of toxic chemicals releasing facilities) Business SIC classification: HEAVY CONSTRUCTION; ELECTRIC SERVICES; ELECTRIC AND OTHER SERVICES COMBINED Organizations: UNION ELECTRIC COMPANY DBA AMERENUE (CONTACT/OWNER)
, AMERENUE (CONTACT/OWNER)
, UNION ELECTRIC COMPANY (OWNER/OPERATOR)
Alternative names: AMEREN CORP. C/O STEVEN BURNS, AMEREN RUSH ISLAND POWER STATION, AMERENUE, AMERENUE - RUSH ISLAND PO, RUSH ISLAND POWER STATION, UE, RUSH ISLAND PP, UNION ELECTRIC CO, UNION ELECTRIC CO RUSH ISLAND
JEFFERSON CO REORG SCH #7 (2400 HWY 61 in FESTUS, MO)
STATE MASTER (Missouri monitoring and compilance) - PCS-MO0091057, NPDES NON-MAJOR (National Center for Education Statistics) - STATE ID-4020050007 National Pollutant Discharge Elimination System NON-MAJOR (Tracking pollutant discharge elimination systems) - permit Business SIC classification: ELEMENTARY AND SECONDARY SCHOOLS Organizations: JEFFERSON CO. R-VII (SCHOOL DISTRICT)
Alternative names: JEFFERSON CO R-VII SCH DI, PLATTIN PRIMARY SCHOOL
FRED WEBER INCORPORATED (838 VFW DRIVE in FESTUS, MO)
AIR SYNTHETIC MINOR (AIRS/AFS) STATE MASTER (Missouri monitoring and compilance) - PCS-MOG490131, NPDES NON-MAJOR, RCRAINFO-MOD980323372, CESQG, NEI-290990007, AIR PROGRAM, NET-290990007, NEI-290990008, NET-290990008, AIRS/AFS-MO0061665, AIR SYNTHETIC MINOR, AIRS/AFS-MO0061668, AIRS/AFS-MO0903990, AIR MINOR CRITERIA AND HAZARDOUS AIR POLLUTANT INVENTORY (Inventory of air pollution sources) National Pollutant Discharge Elimination System NON-MAJOR (Tracking pollutant discharge elimination systems) - permit Conditionally Exempt Small Quantity Generators, less than 100 kg/month of hazardous waste (Resource Conservation and Recovery Act (tracking hazardous waste)) - notification Business SIC classification: DIMENSION STONE; CRUSHED AND BROKEN LIMESTONE; ASPHALT PAVING MIXTURES AND BLOCKS Business NAICS classification: CRUSHED AND BROKEN LIMESTONE MINING AND QUARRYING.; ASPHALT PAVING MIXTURE AND BLOCK MANUFACTURING. Alternative names: FRED WEBER INC FESTUS STONE, FWI, FESTUS QUARRY
FESTUS (LANBERT HILLS in FESTUS, MO)
STATE MASTER (Missouri monitoring and compilance) - PCS-MO0091006, NPDES NON-MAJOR National Pollutant Discharge Elimination System NON-MAJOR (Tracking pollutant discharge elimination systems) - permit COMMUNITY WATER SYSTEM (SDWIS) - SDWIS-MO6010276 72157, WATER TREATMENT PLANT, SDWIS-MO6010276 72158, SDWIS-MO6010276 72159, SDWIS-MO6010276 72160, SDWIS-MO6010276 72161, Business SIC classification: LAND SUBDIVIDERS AND DEVELOPERS, EXCEPT CEMETERIES Alternative names: FESTUS,LAMBERT HILLS SUBD
HERSCHELLS DISCOUNT TIRE INCORPORATED (107 SOUTH MILL in FESTUS, MO)
AIR MINOR (AIRS/AFS) (Integrated Compliance Information System) - ICIS-07-1997-0075, FORMAL ENFORCEMENT ACTION STATE MASTER (Missouri monitoring and compilance) - ICIS-2291, ENFORCEMENT/COMPLIANCE ACTIVITY, AIRS/AFS-MO0939977, AIR MINOR Business SIC classification: AUTOMOTIVE REPAIR SHOPS
FESTUS R-VI SCHOOL DIST (1515 MID-MEADOW LANE in FESTUS, MO)
STATE MASTER (Missouri monitoring and compilance) - NCDB-C07#07-93-418, COMPLIANCE ACTIVITY, NCDB-I07#19930310N7001 1, NCDB-I07#19930310N7001 2, RCRAINFO-MOP000027532, NOT IN A UNIVERSE COMPLIANCE ACTIVITY (Tracking inspections of insecticide, fungicide, and rodenticide, and toxic substances) (Resource Conservation and Recovery Act (tracking hazardous waste)) Organizations: FESTUS R6 SCHOOL DISTRICT (CONTACT/OWNER)
Alternative names: FESTUS R6 SCHOOL DISTRICT, FESTUS SCHOOL DIST R-6, FESTUS SCHOOL DIST R-6 (ROTH)
FESTUS CITGO (614 N. MAIN in FESTUS, MO)
(Integrated Compliance Information System) - ICIS-07-1997-0248, FORMAL ENFORCEMENT ACTION STATE MASTER (Missouri monitoring and compilance) - ICIS-25212, ENFORCEMENT/COMPLIANCE ACTIVITY
ASHFORD PLACE WASTE WATER TREATMENT FACILITY (GAMEL CEMETERY ROAD in FESTUS, MO)
STATE MASTER (Missouri monitoring and compilance) - PCS-MO0118524, NPDES NON-MAJOR National Pollutant Discharge Elimination System NON-MAJOR (Tracking pollutant discharge elimination systems) - permit Business SIC classification: SEWERAGE SYSTEMS Organizations: FESTUS, CITY OF (CONTACT/OWNER)
Alternative names: FESTUS, FESTUS,ASHFORD PLACE WWTF
HEMATITE PROPERTY (3645 HILLSBORO HEMATITE in FESTUS, MO)
STATE MASTER (Missouri monitoring and compilance) - RCRAINFO-MOP000509810, SQG (Resource Conservation and Recovery Act (tracking hazardous waste)) Organizations: J C WILLS (CONTACT/OPERATOR)
ROCK CREEK PUB SEW DIST (IVY LANE in FESTUS, MO)
STATE MASTER (Missouri monitoring and compilance) - PCS-MO0058645, NPDES NON-MAJOR National Pollutant Discharge Elimination System NON-MAJOR (Tracking pollutant discharge elimination systems) - permit Business SIC classification: SEWERAGE SYSTEMS Organizations: ROCK CREEK SEW DIS (RCSD) (CONTACT/OWNER)
Alternative names: RCSD, GODFREY GARDENS
ATLAS SOUNDOLIER DIVISION (600 HORINE in FESTUS, MO)
AIR MINOR (AIRS/AFS) STATE MASTER (Missouri monitoring and compilance) - TRIS-63028TLSSN600HO, TRI REPORTER, AIRS/AFS-MO0061767, AIR MINOR, NTI-NTIT$FNP0755, AIR PROGRAM TRI REPORTER (Tracking of toxic chemicals releasing facilities) Business SIC classification: OFFICE FURNITURE, EXCEPT WOOD; HOUSEHOLD AUDIO AND VIDEO EQUIPMENT; ELECTRONIC COMPONENTS Alternative names: ATLAS-SOUNDOLIER
BRECKENRIDGE MATERIAL CO (1160 TRUMAN BOULEVARD in FESTUS, MO)
STATE MASTER (Missouri monitoring and compilance) - PCS-MOG490326, NPDES NON-MAJOR National Pollutant Discharge Elimination System NON-MAJOR (Tracking pollutant discharge elimination systems) - permit Business SIC classification: CRUSHED AND BROKEN LIMESTONE; READY-MIXED CONCRETE Organizations: BRECKENRIDGE MATERIAL CO. (CONTACT/OWNER)
Alternative names: MACLAY CONCRETE COMPANY, MACLAY CONCRETE CO PLNT#5
Housing units lacking complete plumbing facilities: 1.4% Housing units lacking complete kitchen facilities: 2.2%
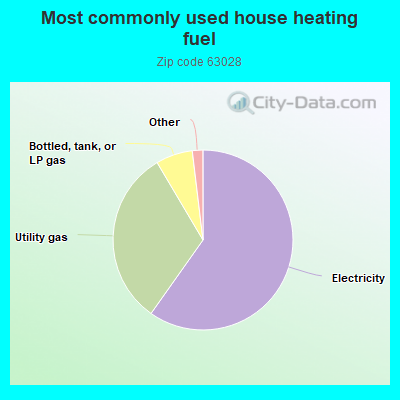
59.8%Electricity
31.7%Utility gas
6.6%Bottled, tank, or LP gas
0.8%Wood
0.5%Fuel oil, kerosene, etc.
Population in 1990: 22,497. Population change in the 1990s: +724 (+3.2%).
Place of birth for U.S.-born residents:
This state: 23,382
Northeast: 627
Midwest: 1,658
South: 1,678
West: 448
56% of the 63028 zip code residents lived in the same house 5 years ago. Out of people who lived in different houses, 68% lived in this county. Out of people who lived in different counties, 50% lived in Missouri.
91% of the 63028 zip code residents lived in the same house 1 year ago. Out of people who lived in different houses, 62% moved from this county. Out of people who lived in different houses, 28% moved from different county within same state. Out of people who lived in different houses, 9% moved from different state. Out of people who lived in different houses, 1% moved from abroad.
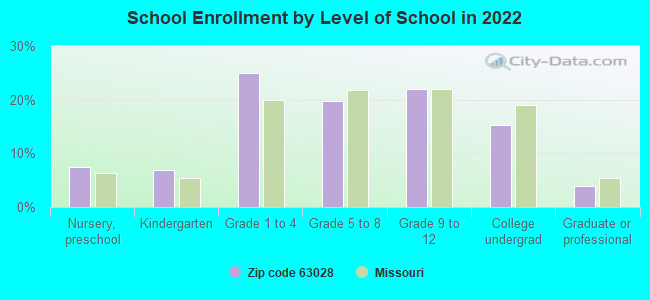
Private vs. public school enrollment:
Students in private schools in grades 1 to 8 (elementary and middle school): 338
Here:
11.8%
Missouri:
15.4%
Students in private schools in grades 9 to 12 (high school): 133
Here:
9.5%
Missouri:
13.9%
Students in private undergraduate colleges: 83
Here:
8.3%
Missouri:
22.6%
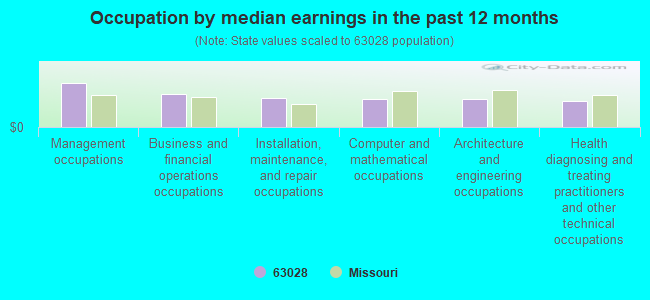
Occupation by median earnings in the past 12 months ($)
107,810Management occupations
81,076Business and financial operations occupations
72,147Installation, maintenance, and repair occupations
69,259Computer and mathematical occupations
69,115Architecture and engineering occupations
64,857Health diagnosing and treating practitioners and other technical occupations
Companies with federal contracts located in this zip code (FESTUS, MO):
D & S FENCING COMPANY, INC (2800 SUNNYSIDE ROAD; small business)
$11,985 with U.S. Army Corps of Engineers - civil program financing only for Maintenance, Repair or Alteration of Real Property -- Highways, Roads, Streets, Bridges, and Railways (includes resurfacing). Signed on 2003-07-29. Completion date: 2003-07-30.
CHRISTINA D HILL (810 VALENTINE ST)
$9,561 with Navy for Electrical Insulators and Insulating Materials. Signed on 2005-04-08. Completion date: 2005-04-20.
TUCKER, TIMOTHY L (2415 HIGHWAY 67; small business)
$6,292 with U.S. Army Corps of Engineers - civil program financing only for Diesel Engines and Components. Signed on 2003-07-22. Completion date: 2003-07-14.
MIDWEST CRISIS CLEANING (590 MEYERWOOD RD; small business)
$6,000 with Army for Other Housekeeping Services. Signed on 2006-03-24. Completion date: 2006-04-29.
GANNONS OF FESTUS, INC (1303 VETERANS BLVD; small business) : $4,334 in 3 contractsfrom 2004 to 2005
$3,779 with Army for Lodging - Hotel/Motel. Signed on 2004-12-27. Completion date: 2005-01-06.
$1,122, same as above.Signed on 2005-01-18. Completion date: 2005-01-06.
-$567, same as above.Signed on 2004-12-27. Completion date: 2005-01-06.
Top industries in this zip code by the number of employees in 2005:
2002 - 2018 National Fire Incident Reporting System (NFIRS) incidents
Based on the data from the years 2002 - 2018 the average number of fires per year is 176. The highest number of reported fire incidents - 255 took place in 2007, and the least - 37 in 2002. The data has a growing trend.
When looking into fire subcategories, the most reports belonged to: Structure Fires (50.5%), and Outside Fires (29.8%).
Fire incident types reported to NFIRS in Zip Code 63028
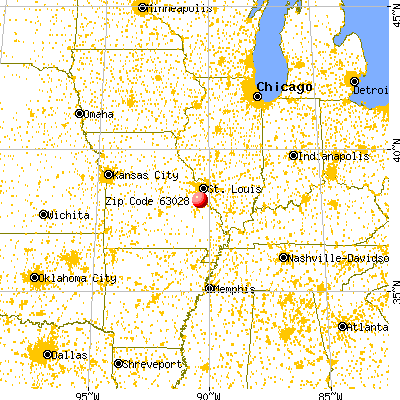


 Nearest zip codes: 63019, 63047, 63048, 63087, 63070, 63036.


 Based on the data from the years 2002 - 2018 the average number of fires per year is 176. The highest number of reported fire incidents - 255 took place in 2007, and the least - 37 in 2002. The data has a growing trend.
 When looking into fire subcategories, the most reports belonged to: Structure Fires (50.5%), and Outside Fires (29.8%).