Estimated zip code population in 2022: 10,368 Zip code population in 2010: 11,507 Zip code population in 2000: 16,688
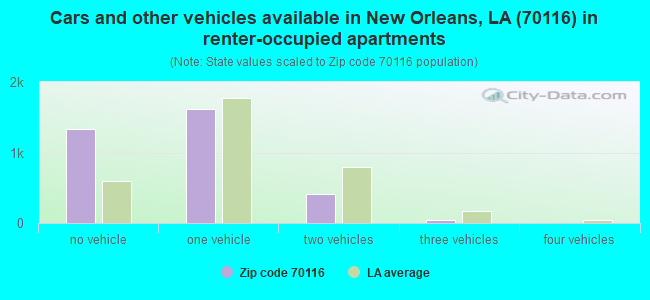
Houses and condos: 9,783 Renter-occupied apartments: 3,404
% of renters here:
59%
State:
32%
March 2022 cost of living index in zip code 70116: 101.8 (near average, U.S. average is 100)
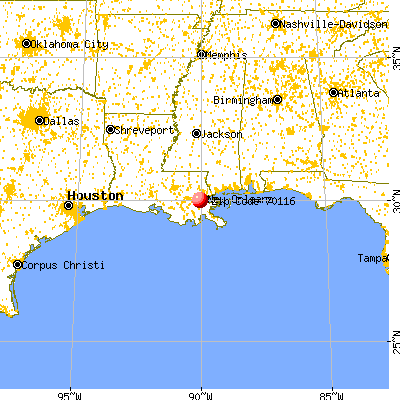
Land area: 1.3 sq. mi. Water area: 0.1 sq. mi.
Population density: 8,027 people per square mile
(high).
OSM Map
General Map
Google Map
MSN Map
OSM Map
General Map
Google Map
MSN Map
OSM Map
General Map
Google Map
MSN Map
OSM Map
General Map
Google Map
MSN Map
Please wait while loading the map...
Real estate property taxes paid for housing units in 2022:
This zip code:
0.6% ($2,561)
Louisiana:
0.5% ($1,127)
Median real estate property taxes paid for housing units with mortgages in 2022: $2,700 (0.7%) Median real estate property taxes paid for housing units with no mortgage in 2022: $2,456 (0.6%)
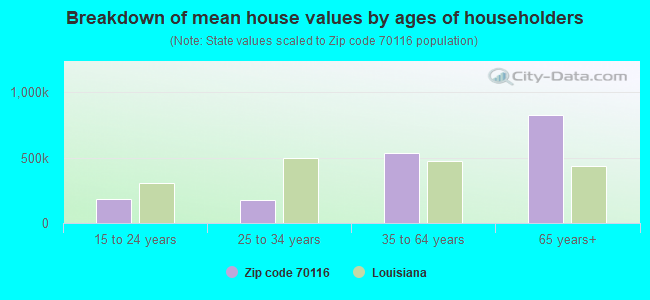
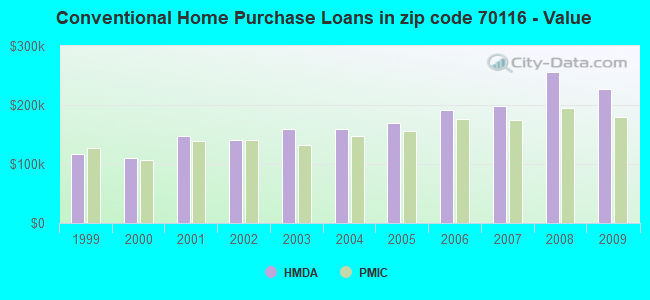
Estimated median house/condo value in 2022: $413,336
70116:
$413,336
Louisiana:
$209,200
According to our research of Louisiana and other state lists, there were 21 registered sex offenders living in 70116 zip code as of April 27, 2024. The ratio of all residents to sex offenders in zip code 70116 is 560 to 1. The ratio of registered sex offenders to all residents in this zip code is lower than the state average.
Median resident age:
This zip code:
45.0 years
Louisiana median age:
38.2 years
Average household size:
This zip code:
1.7 people
Louisiana:
2.5 people
Averages for the 2020 tax year for zip code 70116, filed in 2021:
Average Adjusted Gross Income (AGI) in 2020: $56,484 (Individual Income Tax Returns)
Here:
$56,484
State:
$60,757
Salary/wage: $41,260 (reported on 77.5% of returns)
Here:
$41,260
State:
$50,882
(% of AGI for various income ranges: 958.3% for AGIs below $25k, 3363.9% for AGIs $25k-50k, 7255.2% for AGIs $50k-75k, 10026.0% for AGIs $75k-100k, 18279.3% for AGIs $100k-200k, 93685.0% for AGIs over 200k)
Taxable interest for individuals: $2,654 (reported on 20.1% of returns)
This zip code:
$2,654
Louisiana:
$1,576
(% of AGI for various income ranges: 8.0% for AGIs below $25k, 8.5% for AGIs $25k-50k, 36.1% for AGIs $50k-75k, 176.7% for AGIs $75k-100k, 217.9% for AGIs $100k-200k, 4025.0% for AGIs over 200k)
Ordinary dividends: $13,926 (reported on 16.5% of returns)
Here:
$13,926
State:
$7,743
(% of AGI for various income ranges: 14.8% for AGIs below $25k, 28.9% for AGIs $25k-50k, 176.7% for AGIs $50k-75k, 524.0% for AGIs $75k-100k, 1115.7% for AGIs $100k-200k, 18492.5% for AGIs over 200k)
Net capital gain/loss in AGI: +$32,541 (reported on 15.0% of returns)
Here:
+$32,541
State:
+$16,917
(% of AGI for various income ranges: 18.5% for AGIs below $25k, 42.2% for AGIs $25k-50k, 163.6% for AGIs $50k-75k, 651.3% for AGIs $75k-100k, 1565.7% for AGIs $100k-200k, 46670.0% for AGIs over 200k)
Profit/loss from business: +$8,691 (reported on 26.3% of returns)
Here:
+$8,691
State:
+$7,679
(% of AGI for various income ranges: 108.9% for AGIs below $25k, 90.4% for AGIs $25k-50k, 220.3% for AGIs $50k-75k, 228.0% for AGIs $75k-100k, 1371.4% for AGIs $100k-200k, 12562.5% for AGIs over 200k)
Taxable individual retirement arrangement distribution: $22,060 (reported on 5.3% of returns)
70116:
$22,060
Louisiana:
$20,716
(% of AGI for various income ranges: 23.1% for AGIs below $25k, 64.5% for AGIs $25k-50k, 174.2% for AGIs $50k-75k, 377.3% for AGIs $75k-100k, 1161.4% for AGIs $100k-200k, 4317.5% for AGIs over 200k)
Self-employed (Keogh) retirement plans: $45,800 (reported on 0.4% of returns)
70116:
$45,800
Louisiana:
$27,459
(% of AGI for various income ranges: 654.3% for AGIs $100k-200k)
Total itemized deductions: $43,843 (reported on 7.4% of returns)
Here:
$43,843
State:
$36,265
(% of AGI for various income ranges: 39.8% for AGIs below $25k, 113.3% for AGIs $25k-50k, 280.0% for AGIs $50k-75k, 714.7% for AGIs $75k-100k, 1806.4% for AGIs $100k-200k, 22600.0% for AGIs over 200k)
Charity contributions: $22,200 (reported on 5.5% of returns)
Here:
$22,200
State:
$13,106
(% of AGI for various income ranges: 22.8% for AGIs $25k-50k, 63.3% for AGIs $50k-75k, 109.3% for AGIs $75k-100k, 362.1% for AGIs $100k-200k, 11682.5% for AGIs over 200k)
Taxes paid: $7,497 (reported on 7.2% of returns)
70116:
$7,497
State:
$6,643
(% of AGI for various income ranges: 6.2% for AGIs below $25k, 17.2% for AGIs $25k-50k, 67.6% for AGIs $50k-75k, 193.3% for AGIs $75k-100k, 509.3% for AGIs $100k-200k, 2625.0% for AGIs over 200k)
Earned income credit: $1,901 (reported on 26.9% of returns)
Here:
$1,901
State:
$2,671
(% of AGI for various income ranges: 104.4% for AGIs below $25k, 62.2% for AGIs $25k-50k)
Percentage of individuals using paid preparers for their 2020 taxes: 92.4%
Here:
92%
State:
92%
(% for various income ranges: 91.5% for AGIs below $25k, 93.5% for AGIs $25k-50k, 92.2% for AGIs $50k-75k, 95.8% for AGIs $75k-100k, 93.5% for AGIs $100k-200k, 89.5% for AGIs over 200k)
Averages for the 2012 tax year for zip code 70116, filed in 2013:
Average Adjusted Gross Income (AGI) in 2012: $59,437 (Individual Income Tax Returns)
Here:
$59,437
State:
$56,730
Salary/wage: $36,697 (reported on 81.0% of returns)
Here:
$36,697
State:
$45,545
(% of AGI for various income ranges: 76.8% for AGIs below $25k, 85.1% for AGIs $25k-50k, 73.9% for AGIs $50k-75k, 71.6% for AGIs $75k-100k, 61.2% for AGIs $100k-200k, 22.1% for AGIs over 200k)
Taxable interest for individuals: $2,489 (reported on 21.1% of returns)
This zip code:
$2,489
Louisiana:
$1,804
(% of AGI for various income ranges: 0.7% for AGIs below $25k, 0.6% for AGIs $25k-50k, 0.7% for AGIs $50k-75k, 0.7% for AGIs $75k-100k, 1.4% for AGIs $100k-200k, 0.9% for AGIs over 200k)
Ordinary dividends: $13,717 (reported on 14.5% of returns)
Here:
$13,717
State:
$7,610
(% of AGI for various income ranges: 1.6% for AGIs below $25k, 1.9% for AGIs $25k-50k, 2.5% for AGIs $50k-75k, 1.8% for AGIs $75k-100k, 2.5% for AGIs $100k-200k, 4.8% for AGIs over 200k)
Net capital gain/loss in AGI: +$50,159 (reported on 12.0% of returns)
Here:
+$50,159
State:
+$17,096
(% of AGI for various income ranges: 0.3% for AGIs below $25k, 0.4% for AGIs $25k-50k, 0.7% for AGIs $50k-75k, 2.7% for AGIs $75k-100k, 5.2% for AGIs $100k-200k, 19.7% for AGIs over 200k)
Profit/loss from business: +$16,612 (reported on 23.0% of returns)
Here:
+$16,612
State:
+$12,088
(% of AGI for various income ranges: 13.7% for AGIs below $25k, 4.3% for AGIs $25k-50k, 4.1% for AGIs $50k-75k, 5.8% for AGIs $75k-100k, 6.6% for AGIs $100k-200k, 5.8% for AGIs over 200k)
Taxable individual retirement arrangement distribution: $21,885 (reported on 5.1% of returns)
70116:
$21,885
Louisiana:
$16,085
(% of AGI for various income ranges: 0.9% for AGIs below $25k, 0.9% for AGIs $25k-50k, 1.9% for AGIs $50k-75k, 5.2% for AGIs $75k-100k, 3.7% for AGIs $100k-200k, 1.5% for AGIs over 200k)
Self-employment retirement plans: $25,817 (reported on 1.1% of returns)
70116:
$25,817
Louisiana:
$25,119
Total itemized deductions: $26,118 (14% of AGI, reported on 20.6% of returns)
Here:
$26,118
State:
$23,585
Here:
14.1% of AGI
State:
18.1% of AGI
(% of AGI for various income ranges: 6.1% for AGIs below $25k, 8.0% for AGIs $25k-50k, 10.9% for AGIs $50k-75k, 11.3% for AGIs $75k-100k, 14.6% for AGIs $100k-200k, 7.9% for AGIs over 200k)
Charity contributions: $5,600 (reported on 15.2% of returns)
Here:
$5,600
State:
$5,533
(% of AGI for various income ranges: 0.6% for AGIs below $25k, 1.1% for AGIs $25k-50k, 1.4% for AGIs $50k-75k, 1.4% for AGIs $75k-100k, 1.6% for AGIs $100k-200k, 1.7% for AGIs over 200k)
Taxes paid: $9,918 (reported on 20.0% of returns)
70116:
$9,918
State:
$6,282
(% of AGI for various income ranges: 1.1% for AGIs below $25k, 1.6% for AGIs $25k-50k, 2.6% for AGIs $50k-75k, 3.5% for AGIs $75k-100k, 5.1% for AGIs $100k-200k, 4.0% for AGIs over 200k)
Earned income credit: $2,147 (reported on 32.4% of returns)
Here:
$2,147
State:
$2,633
(% of AGI for various income ranges: 9.2% for AGIs below $25k, 0.7% for AGIs $25k-50k)
Percentage of individuals using paid preparers for their 2012 taxes: 48.8%
Here:
49%
State:
57%
(% for various income ranges: 46.8% for AGIs below $25k, 40.7% for AGIs $25k-50k, 50.0% for AGIs $50k-75k, 61.9% for AGIs $75k-100k, 65.5% for AGIs $100k-200k, 88.9% for AGIs over 200k)
Averages for the 2004 tax year for zip code 70116, filed in 2005:
Average Adjusted Gross Income (AGI) in 2004: $31,128 (Individual Income Tax Returns)
Here:
$31,128
State:
$39,411
Salary/wage: $25,141 (reported on 84.7% of returns)
Here:
$25,141
State:
$34,434
(% of AGI for various income ranges: 134.3% for AGIs below $10k, 88.3% for AGIs $10k-25k, 84.8% for AGIs $25k-50k, 73.9% for AGIs $50k-75k, 73.9% for AGIs $75k-100k, 40.1% for AGIs over 100k)
Taxable interest for individuals: $2,357 (reported on 21.6% of returns)
This zip code:
$2,357
Louisiana:
$1,606
(% of AGI for various income ranges: 4.2% for AGIs below $10k, 0.9% for AGIs $10k-25k, 1.1% for AGIs $25k-50k, 1.6% for AGIs $50k-75k, 1.4% for AGIs $75k-100k, 2.1% for AGIs over 100k)
Taxable dividends: $8,604 (reported on 12.2% of returns)
Here:
$8,604
State:
$3,235
(% of AGI for various income ranges: 2.5% for AGIs below $10k, 0.5% for AGIs $10k-25k, 1.0% for AGIs $25k-50k, 2.2% for AGIs $50k-75k, 1.6% for AGIs $75k-100k, 6.9% for AGIs over 100k)
Net capital gain/loss: +$24,737 (reported on 10.3% of returns)
Here:
+$24,737
State:
+$8,531
(% of AGI for various income ranges: -1.7% for AGIs below $10k, -0.1% for AGIs $10k-25k, 0.3% for AGIs $25k-50k, 1.1% for AGIs $50k-75k, 2.0% for AGIs $75k-100k, 20.7% for AGIs over 100k)
Profit/loss from business: +$9,279 (reported on 15.7% of returns)
Here:
+$9,279
State:
+$9,128
(% of AGI for various income ranges: 12.7% for AGIs below $10k, 5.3% for AGIs $10k-25k, 3.6% for AGIs $25k-50k, 3.9% for AGIs $50k-75k, 4.6% for AGIs $75k-100k, 4.4% for AGIs over 100k)
IRA payment deduction: $2,724 (reported on 2.2% of returns)
70116:
$2,724
Louisiana:
$3,055
(% of AGI for various income ranges: 0.2% for AGIs $10k-25k, 0.3% for AGIs $25k-50k, 0.4% for AGIs $50k-75k, 0.1% for AGIs over 100k)
Self-employed pension: $22,778 (reported on 0.6% of returns)
Here:
$22,778
Louisiana:
$17,274
Total itemized deductions: $22,989 (22% of AGI, reported on 14.9% of returns)
Here:
$22,989
State:
$18,222
Here:
21.8% of AGI
State:
20.3% of AGI
(% of AGI for various income ranges: 5.7% for AGIs below $10k, 4.0% for AGIs $10k-25k, 8.4% for AGIs $25k-50k, 13.0% for AGIs $50k-75k, 15.4% for AGIs $75k-100k, 15.6% for AGIs over 100k)
Charity contributions deductions: $6,098 (5% of AGI, reported on 12.3% of returns)
Here:
$6,098
State:
$4,190
Here:
5.4% of AGI
State:
4.4% of AGI
(% of AGI for various income ranges: 0.4% for AGIs below $10k, 0.5% for AGIs $10k-25k, 1.3% for AGIs $25k-50k, 2.6% for AGIs $50k-75k, 2.7% for AGIs $75k-100k, 4.2% for AGIs over 100k)
Total tax: $7,092 (reported on 56.4% of returns)
70116:
$7,092
State:
$6,529
(% of AGI for various income ranges: 3.5% for AGIs below $10k, 3.4% for AGIs $10k-25k, 8.3% for AGIs $25k-50k, 13.0% for AGIs $50k-75k, 14.7% for AGIs $75k-100k, 20.9% for AGIs over 100k)
Earned income credit: $2,141 (reported on 44.4% of returns)
Here:
$2,141
State:
$2,103
Percentage of individuals using paid preparers for their 2004 taxes: 63.0%
Here:
63%
State:
61%
(% for various income ranges: 66.1% for AGIs below $10k, 66.0% for AGIs $10k-25k, 52.2% for AGIs $25k-50k, 53.4% for AGIs $50k-75k, 55.6% for AGIs $75k-100k, 76.3% for AGIs over 100k)
Likely homosexual households (counted as self-reported same-sex unmarried-partner households)
Lesbian couples: 0.3% of all households
Gay men: 1.4% of all households
Household received Food Stamps/SNAP in the past 12 months: 947 Household did not receive Food Stamps/SNAP in the past 12 months: 4,878
Women who had a birth in the past 12 months: 68 (8 now married, 61 unmarried) Women who did not have a birth in the past 12 months: 2,323 (613 now married, 1,719 unmarried)
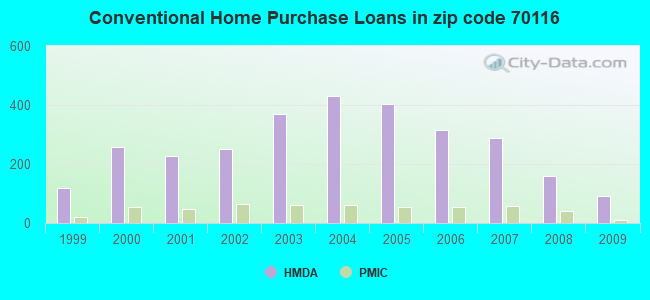
Housing units in zip code 70116 with a mortgage: 1,210 (62 second mortgage, 41 both second mortgage and home equity loan) Houses without a mortgage: 28
Median monthly owner costs for units with a mortgage: $2,009 Median monthly owner costs for units without a mortgage: $794
Residents with income below the poverty level in 2022:
This zip code:
24.6%
Whole state:
18.6%
Residents with income below 50% of the poverty level in 2022:
This zip code:
12.2%
Whole state:
10.1%
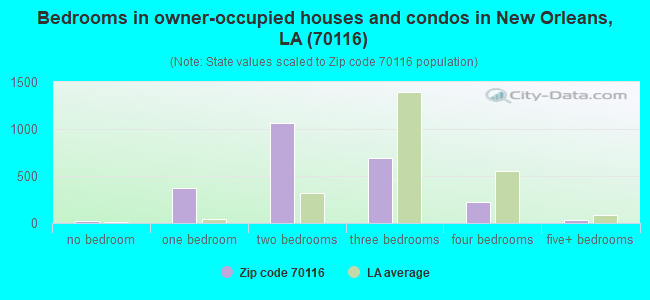
Median number of rooms in houses and condos:
Here:
5.3
State:
6.2
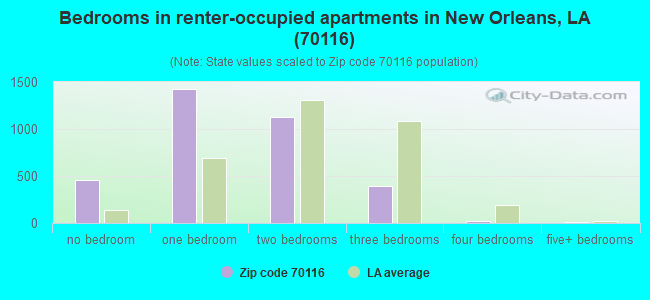
Median number of rooms in apartments:
Here:
3.6
State:
4.4
Notable locations in this zip code not listed on our city pages
Notable locations in zip code 70116: Treme Market (A), French Market (B), Delemore Market (C), Governor Nicholls Street Wharf (D), Mahalia Jackson Theater of the Performing Arts (E), Old United States Mint (F), New Orleans Historic Voodoo Museum (G), New Orleans African - American Museum of Art Culture and History (H), Musee Rosette Rochon (I), Louisiana Museum of African American History (J), Catholic Cultural Heritage Center (K), Beauregard - Keyes House (L), Backstreet Cultural Museum (M), North Ranpart Community Center (N), New Orleans Fire Department Engine 9 (O), Cabrini Day Care Center (P), Covenant House (Q), Cabildo (R), Louisiana State Museum Library (S), Municipal Auditorium (T). Display/hide their locations on the map
Churches in zip code 70116 include: Greater Saint Paul Missionary Baptist Church of New Orleans (A), Father's House Fellowship Church (B), Christian Light Missionary Church (C), Zion Hill Missionary Baptist Church (D), Saint Philip Church of God in Christ (E), Saint Mary Church (F), Saint Marks United Methodist Church (G), Saint John Divine Baptist Church (H), Saint Annas Episcopal Church (I). Display/hide their locations on the map
Parks in zip code 70116 include: New Orleans Jazz National Historical Park (1), Armstrong Park (2), Washington Square (3), Washington Artillery Park (4), Louis Armstrong Park (5), French Quarter Visitor Center (6), Cabrini Playground (7), Beauregard Square (8), Vieux Carre Historic District (9). Display/hide their locations on the map
Tourist attractions (not listed on the city page) : Musee Rochon-Don Richmond (Museums; 1515 Pauger Street), Louisiana State Museum (751 Place John Paul Deau), Marie Laveau House of Voodoo Museum (739 Bourbon Street), Beauregard-Keyes House and Garden (Museums; 1113 Chartres Street), St Louis Cathedral (Historical Places & Services; 615 Pere Antoine Alley), U S Government - Interior Dept- National Park Service- New Orleans Jazz National Historica (Recreation Areas; 916 North Peters Street), New Orleans Accommodations Locations (1000 Bourbon Street), All at Jazz Escorts (Tours & Charters; 734 Dumaine Street), Bloody's Mary's Tours (Tours & Charters; 725 Saint Peter Street).
258 married couples with children.
867 single-parent households (81 men, 786 women).
92.1% of residents of 70116 zip code speak English at home.
5.6% of residents speak Spanish at home (59% very well, 34% well, 4% not well, 4% not at all).
2.1% of residents speak other Indo-European language at home (93% very well, 7% well).
0.4% of residents speak Asian or Pacific Island language at home (100% very well).
0.1% of residents speak other language at home (100% well).
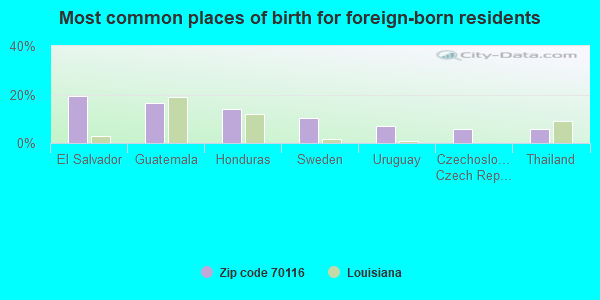
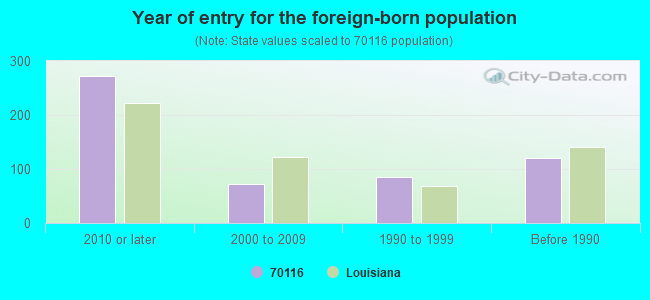
Foreign born population: 494 (4.8%) (44.3% of them are naturalized citizens)
This zip code:
4.8%
Whole state:
4.2%
19%El Salvador
17%Guatemala
14%Honduras
11%Sweden
7%Uruguay
6%Czechoslovakia (includes Czech Republic and Slovakia)
Major facilities with environmental interests located in this zip code:
A. P. TUREAUD ELEMENTARY SCHOOL (2021 PAUGER STREET in NEW ORLEANS, LA)
(National Center for Education Statistics) - STATE ID-036024 Organizations: ORLEANS PARISH SCHOOL BOARD (SCHOOL DISTRICT)
BEN FRANKLIN ELEMENTARY MATH-SCIENCE MAGNET (1301 NORTH DERBIGNEY in NEW ORLEANS, LA)
(National Center for Education Statistics) - STATE ID-036161 Organizations: ORLEANS PARISH SCHOOL BOARD (SCHOOL DISTRICT)
PETROCHEMICAL SVCS INC (2121 CHARTRES STREET in NEW ORLEANS, LA)
Small Quantity Generators, between 100 kg and 1000 kg of hazardous waste/month (Resource Conservation and Recovery Act (tracking hazardous waste)) Organizations: JAMES V BROADWELL (CONTACT/OPERATOR)
, CHARTRES CORP (CONTACT/OWNER)
Alternative names: CHARTRES CORP
DUPUY DRAYAGE CORP (2601 DECATUR ST in NEW ORLEANS, LA)
(Resource Conservation and Recovery Act (tracking hazardous waste))
FAST TAX (1940 ST CLAUDE AVE in NEW ORLEANS, LA)
Conditionally Exempt Small Quantity Generators, less than 100 kg/month of hazardous waste (Resource Conservation and Recovery Act (tracking hazardous waste)) - notification Organizations: ABDUL ALDAHIR (CONTACT/OWNER)
, HOLLY ALDAHIR (CONTACT/OWNER)
Alternative names: CLEAN & SAVE CLNRS
A TO Z AUTO CLINIC (1775 ST CLAUDE AVE in NEW ORLEANS, LA)
Conditionally Exempt Small Quantity Generators, less than 100 kg/month of hazardous waste (Resource Conservation and Recovery Act (tracking hazardous waste)) - notification Business NAICS classification: GENERAL AUTOMOTIVE REPAIR. Organizations: AHMED ESMAIAL (CONTACT/OWNER)
AFFORDABLE CAR CARE (2020 N CLAIBORNE ST in NEW ORLEANS, LA)
Conditionally Exempt Small Quantity Generators, less than 100 kg/month of hazardous waste (Resource Conservation and Recovery Act (tracking hazardous waste)) - notification Business NAICS classification: OTHER AUTOMOTIVE MECHANICAL AND ELECTRICAL REPAIR AND MAINTENANCE. Organizations: REGGIE THOMAS (CONTACT/OWNER)
ALS COLLISION CENTER (1137 N CLAIBORNE AVE in NEW ORLEANS, LA)
Small Quantity Generators, between 100 kg and 1000 kg of hazardous waste/month (Resource Conservation and Recovery Act (tracking hazardous waste)) - notification Business NAICS classification: AUTOMOTIVE BODY, PAINT, AND INTERIOR REPAIR AND MAINTENANCE. Organizations: ALBERT PETERSON (CONTACT/OWNER)
Alternative names: MERCEDES MEDIC INC
BELLSOUTH TEL INC J2205 (1740 FRANKLIN AVE in NEW ORLEANS, LA)
Small Quantity Generators, between 100 kg and 1000 kg of hazardous waste/month (Resource Conservation and Recovery Act (tracking hazardous waste)) - notification
MIKES AUTO CTR (1342 FRANKLIN AVE in NEW ORLEANS, LA)
Conditionally Exempt Small Quantity Generators, less than 100 kg/month of hazardous waste (Resource Conservation and Recovery Act (tracking hazardous waste)) - notification Business NAICS classification: OTHER AUTOMOTIVE MECHANICAL AND ELECTRICAL REPAIR AND MAINTENANCE. Organizations: FULTON WILLIAMS (CONTACT/OWNER)
PADDLEWHEEL PHOTOS (920 FRENCHMEN ST in NEW ORLEANS, LA)
Conditionally Exempt Small Quantity Generators, less than 100 kg/month of hazardous waste (Resource Conservation and Recovery Act (tracking hazardous waste)) - notification Organizations: MITCHEL OSBORNE (CONTACT/OWNER)
Q LEE LAUNDRY INC (1623-25 BASIN ST in NEW ORLEANS, LA)
Conditionally Exempt Small Quantity Generators, less than 100 kg/month of hazardous waste (Resource Conservation and Recovery Act (tracking hazardous waste)) - notification Organizations: QUONG LEE JR (CONTACT/OWNER)
FRENCH QUARTER CAMERA (809 DECATUR ST in NEW ORLEANS, LA)
Conditionally Exempt Small Quantity Generators, less than 100 kg/month of hazardous waste (Resource Conservation and Recovery Act (tracking hazardous waste)) - notification Business NAICS classification: PHOTOGRAPHY STUDIOS, PORTRAIT. Organizations: BEVERLY SCALA (CONTACT/OWNER)
Housing units lacking complete plumbing facilities: 5.6% Housing units lacking complete kitchen facilities: 5.8%
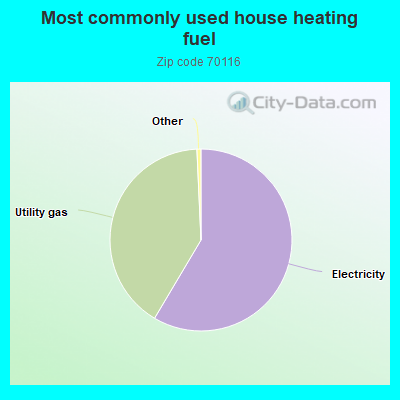
58.6%Electricity
40.8%Utility gas
Population in 1990: 16,592. Population change in the 1990s: +96 (+0.6%).
Place of birth for U.S.-born residents:
This state: 5,644
Northeast: 1,140
Midwest: 607
South: 1,984
West: 519
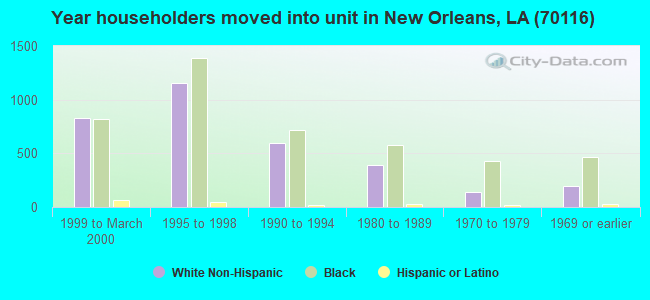
55% of the 70116 zip code residents lived in the same house 5 years ago. Out of people who lived in different houses, 71% lived in this county. Out of people who lived in different counties, 50% lived in Louisiana.
84% of the 70116 zip code residents lived in the same house 1 year ago. Out of people who lived in different houses, 56% moved from this county. Out of people who lived in different houses, 12% moved from different county within same state. Out of people who lived in different houses, 22% moved from different state. Out of people who lived in different houses, 9% moved from abroad.
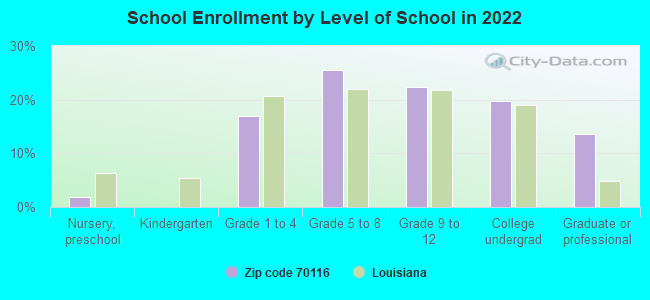
Private vs. public school enrollment:
Students in private schools in grades 1 to 8 (elementary and middle school): 91
Here:
13.4%
Louisiana:
19.6%
Students in private schools in grades 9 to 12 (high school): 18
Here:
5.1%
Louisiana:
18.3%
Students in private undergraduate colleges: 47
Here:
15.0%
Louisiana:
17.4%
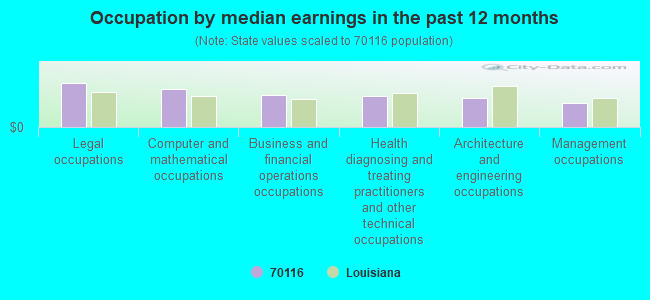
Occupation by median earnings in the past 12 months ($)
115,272Legal occupations
99,130Computer and mathematical occupations
82,910Business and financial operations occupations
81,218Health diagnosing and treating practitioners and other technical occupations
77,262Architecture and engineering occupations
63,625Management occupations
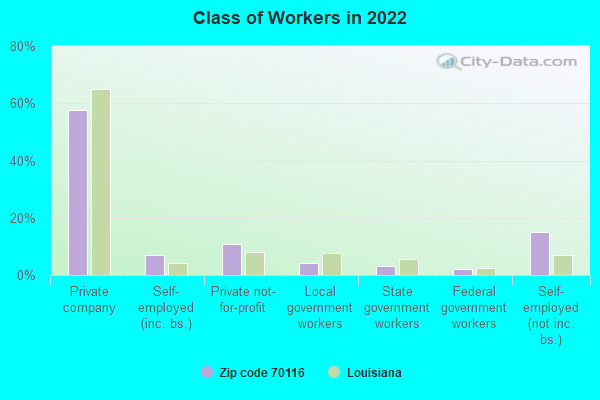
Companies with federal contracts located in this zip code:
METRO CONSULTING AND RESEARCH (1236 N CLAIBORNE AVE in NEW ORLEANS, LA; small business) : $3,800,075 in 55 contractsfrom 2002 to 2006
Contracts for Other Professional Services by U.S. Army Corps of Engineers - civil program financing only, Army Signed by year:2000: $0; 2001: $0; 2002: $848,603; 2003: $644,227; 2004: $820,536; 2005: $1,069,892; 2006: $416,817.
Biggest contracts:
$562,000 with U.S. Army Corps of Engineers - civil program financing only for Other Professional Services. Signed on 2002-05-08. Completion date: 2003-02-10.
$424,524, same as above.Signed on 2005-06-14. Completion date: 2005-11-14.
$424,524 with Army for Other Professional Services. Signed on 2005-06-14. Completion date: 2005-11-14.
$416,817, same as above.Signed on 2006-05-08. Completion date: 2006-05-05.
KW Esplanade Properties, LLC (1427 Bourbon Street in New Orleans, LA; small business)
$216,000 with Public Buildings Service for Lease or Rental of Facilities -- Office Buildings. Signed on 2006-01-20. Completion date: 2007-07-19.
CARRE, LAVIEUX CONSTRUCTION (1430 N RAMPART ST in NEW ORLEANS, LA; small business)
$38,748 with U.S. Army Corps of Engineers - civil program financing only for Construction of Structures and Facilities -- Other Non-Building Facilities. Signed on 2000-09-20. Completion date: 2000-11-10.
METRO-SOURCE LLC (1236 NORTH CLAIRBORNE AVE in NEW ORLEANS, LA; small business)
$27,000 with U.S. Army Corps of Engineers - civil program financing only for Other Architect and Engineering Services. Signed on 2001-08-08. Completion date: 2002-02-04.
TOTAL NETWORK TECHNOLOGIES (1910 URSALINES AVE in NEW ORLEANS, LA; small business) : $10,670 in 3 contractsin 2006
$20,885 with Army for Office Furniture. Signed on 2006-01-14. Completion date: 2006-01-31.
$10,670 with Army for Office Devices and Accessories. Signed on 2006-01-07. Completion date: 2006-01-18.
-$20,885 with Army for Office Furniture. Signed on 2006-05-26. Completion date: 2006-01-31.
Top industries in this zip code by the number of employees in 2005:
2002 - 2018 National Fire Incident Reporting System (NFIRS) incidents
Based on the data from the years 2002 - 2018 the average number of fire incidents per year is 68. The highest number of fire incidents - 137 took place in 2002, and the least - 0 in 2017. The data has a decreasing trend.
When looking into fire subcategories, the most incidents belonged to: Structure Fires (57.7%), and Outside Fires (19.4%).
Fire incident types reported to NFIRS in Zip Code 70116


 Nearest zip codes: 70112, 70139, 70163, 70119, 70130, 70113.


 Based on the data from the years 2002 - 2018 the average number of fire incidents per year is 68. The highest number of fire incidents - 137 took place in 2002, and the least - 0 in 2017. The data has a decreasing trend.
 When looking into fire subcategories, the most incidents belonged to: Structure Fires (57.7%), and Outside Fires (19.4%).