Estimated zip code population in 2022: 27,859 Zip code population in 2010: 25,560 Zip code population in 2000: 22,745
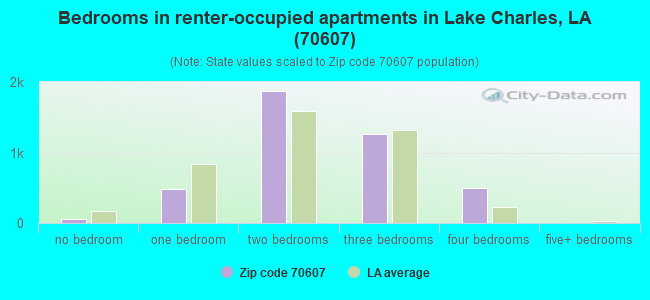
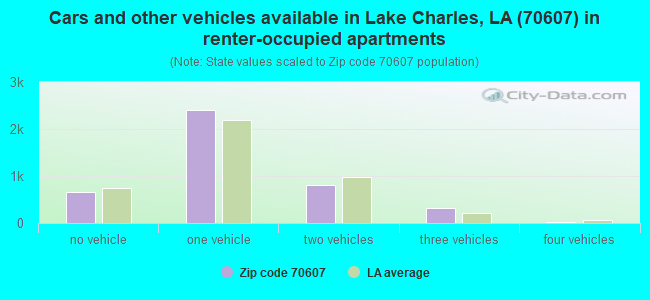
Houses and condos: 13,398 Renter-occupied apartments: 4,201
% of renters here:
40%
State:
32%
March 2022 cost of living index in zip code 70607: 85.6 (less than average, U.S. average is 100)
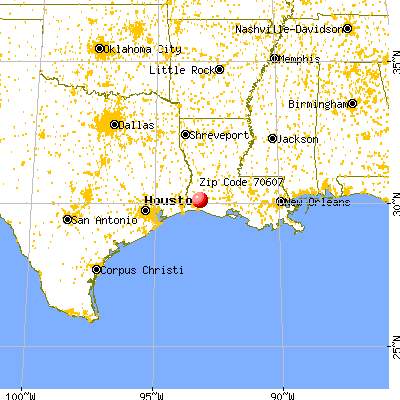
Land area: 118.6 sq. mi. Water area: 26.4 sq. mi.
Population density: 235 people per square mile
(very low).
OSM Map
General Map
Google Map
MSN Map
OSM Map
General Map
Google Map
MSN Map
OSM Map
General Map
Google Map
MSN Map
OSM Map
General Map
Google Map
MSN Map
Please wait while loading the map...
Real estate property taxes paid for housing units in 2022:
This zip code:
0.3% ($589)
Louisiana:
0.5% ($1,127)
Median real estate property taxes paid for housing units with mortgages in 2022: $717 (0.4%) Median real estate property taxes paid for housing units with no mortgage in 2022: $537 (0.3%)
Business Search- 14 Million verified businesses
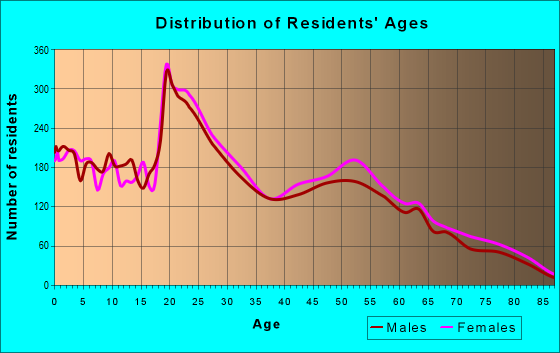
Males: 14,400
(51.7%)
Females: 13,457
(48.3%)
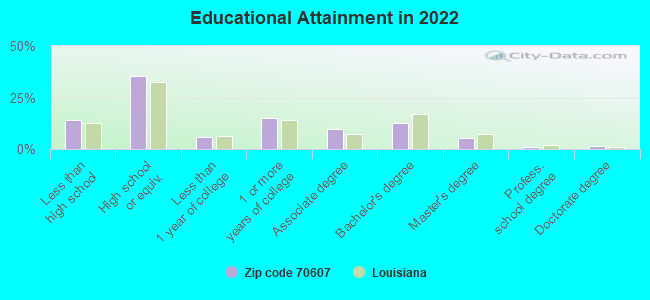
For population 25 years and over in 70607:
High school or higher: 85.2%
Bachelor's degree or higher: 19.6%
Graduate or professional degree: 7.3%
Unemployed: 7.4%
Mean travel time to work (commute): 22.0 minutes
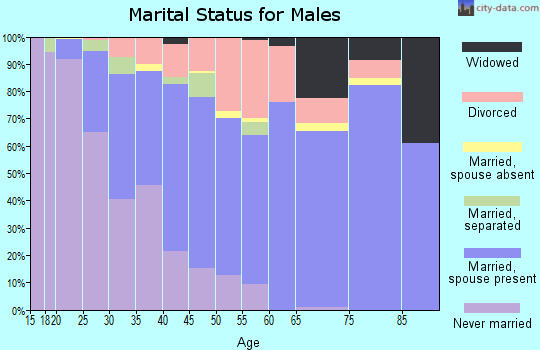
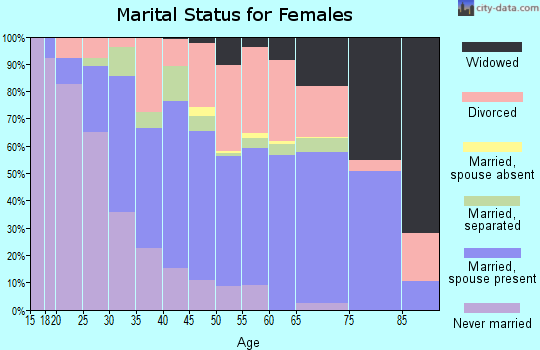
For population 15 years and over in 70607:
Never married: 42.0%
Now married: 36.4%
Separated: 2.9%
Widowed: 5.6%
Divorced: 13.2%
Zip code 70607 compared to state average:
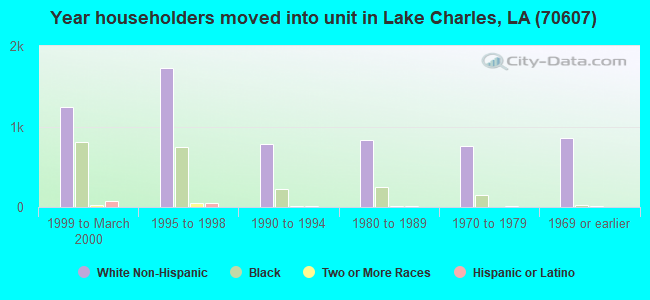
Length of stay since moving in significantly above state average.
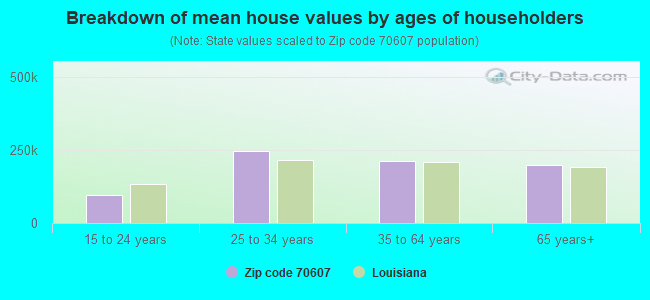
Estimated median house/condo value in 2022: $179,239
70607:
$179,239
Louisiana:
$209,200
According to our research of Louisiana and other state lists, there were 51 registered sex offenders living in 70607 zip code as of April 27, 2024. The ratio of all residents to sex offenders in zip code 70607 is 523 to 1. The ratio of registered sex offenders to all residents in this zip code is lower than the state average.
Median resident age:
This zip code:
35.4 years
Louisiana median age:
38.2 years
Average household size:
This zip code:
2.6 people
Louisiana:
2.5 people
Averages for the 2020 tax year for zip code 70607, filed in 2021:
Average Adjusted Gross Income (AGI) in 2020: $50,074 (Individual Income Tax Returns)
Here:
$50,074
State:
$60,757
Salary/wage: $43,930 (reported on 85.3% of returns)
Here:
$43,930
State:
$50,882
(% of AGI for various income ranges: 1119.6% for AGIs below $25k, 3428.2% for AGIs $25k-50k, 6526.1% for AGIs $50k-75k, 8939.2% for AGIs $75k-100k, 14877.7% for AGIs $100k-200k, 36892.0% for AGIs over 200k)
Taxable interest for individuals: $760 (reported on 20.8% of returns)
This zip code:
$760
Louisiana:
$1,576
(% of AGI for various income ranges: 4.5% for AGIs below $25k, 12.1% for AGIs $25k-50k, 32.5% for AGIs $50k-75k, 23.0% for AGIs $75k-100k, 40.8% for AGIs $100k-200k, 437.0% for AGIs over 200k)
Ordinary dividends: $4,283 (reported on 9.0% of returns)
Here:
$4,283
State:
$7,743
(% of AGI for various income ranges: 7.6% for AGIs below $25k, 18.2% for AGIs $25k-50k, 30.0% for AGIs $50k-75k, 35.6% for AGIs $75k-100k, 99.4% for AGIs $100k-200k, 2039.0% for AGIs over 200k)
Net capital gain/loss in AGI: +$12,876 (reported on 9.1% of returns)
Here:
+$12,876
State:
+$16,917
(% of AGI for various income ranges: 4.4% for AGIs below $25k, 15.0% for AGIs $25k-50k, 53.4% for AGIs $50k-75k, 89.0% for AGIs $75k-100k, 366.1% for AGIs $100k-200k, 7774.0% for AGIs over 200k)
Profit/loss from business: +$4,818 (reported on 18.0% of returns)
Here:
+$4,818
State:
+$7,679
(% of AGI for various income ranges: 55.6% for AGIs below $25k, 49.4% for AGIs $25k-50k, 64.2% for AGIs $50k-75k, 96.4% for AGIs $75k-100k, 215.3% for AGIs $100k-200k, 2984.0% for AGIs over 200k)
Taxable individual retirement arrangement distribution: $22,049 (reported on 5.6% of returns)
70607:
$22,049
Louisiana:
$20,716
(% of AGI for various income ranges: 23.5% for AGIs below $25k, 70.3% for AGIs $25k-50k, 184.1% for AGIs $50k-75k, 344.3% for AGIs $75k-100k, 555.4% for AGIs $100k-200k, 2264.0% for AGIs over 200k)
Total itemized deductions: $47,827 (reported on 15.0% of returns)
Here:
$47,827
State:
$36,265
(% of AGI for various income ranges: 146.9% for AGIs below $25k, 467.2% for AGIs $25k-50k, 1157.9% for AGIs $50k-75k, 1735.1% for AGIs $75k-100k, 3112.3% for AGIs $100k-200k, 12592.0% for AGIs over 200k)
Charity contributions: $12,434 (reported on 3.6% of returns)
Here:
$12,434
State:
$13,106
(% of AGI for various income ranges: 16.1% for AGIs $25k-50k, 56.9% for AGIs $50k-75k, 93.0% for AGIs $75k-100k, 187.2% for AGIs $100k-200k, 1756.0% for AGIs over 200k)
Taxes paid: $5,651 (reported on 5.1% of returns)
70607:
$5,651
State:
$6,643
(% of AGI for various income ranges: 2.5% for AGIs below $25k, 19.5% for AGIs $25k-50k, 34.9% for AGIs $50k-75k, 62.8% for AGIs $75k-100k, 128.5% for AGIs $100k-200k, 717.0% for AGIs over 200k)
Earned income credit: $2,668 (reported on 27.3% of returns)
Here:
$2,668
State:
$2,671
(% of AGI for various income ranges: 148.7% for AGIs below $25k, 96.4% for AGIs $25k-50k)
Percentage of individuals using paid preparers for their 2020 taxes: 94.5%
Here:
94%
State:
92%
(% for various income ranges: 94.0% for AGIs below $25k, 94.5% for AGIs $25k-50k, 93.8% for AGIs $50k-75k, 94.9% for AGIs $75k-100k, 95.4% for AGIs $100k-200k, 100.0% for AGIs over 200k)
Averages for the 2012 tax year for zip code 70607, filed in 2013:
Average Adjusted Gross Income (AGI) in 2012: $40,334 (Individual Income Tax Returns)
Here:
$40,334
State:
$56,730
Salary/wage: $35,913 (reported on 88.7% of returns)
Here:
$35,913
State:
$45,545
(% of AGI for various income ranges: 84.6% for AGIs below $25k, 86.0% for AGIs $25k-50k, 82.9% for AGIs $50k-75k, 84.6% for AGIs $75k-100k, 79.8% for AGIs $100k-200k, 35.2% for AGIs over 200k)
Taxable interest for individuals: $901 (reported on 20.0% of returns)
This zip code:
$901
Louisiana:
$1,804
(% of AGI for various income ranges: 0.4% for AGIs below $25k, 0.6% for AGIs $25k-50k, 0.4% for AGIs $50k-75k, 0.4% for AGIs $75k-100k, 0.3% for AGIs $100k-200k, 0.7% for AGIs over 200k)
Ordinary dividends: $3,199 (reported on 9.0% of returns)
Here:
$3,199
State:
$7,610
(% of AGI for various income ranges: 0.6% for AGIs below $25k, 0.3% for AGIs $25k-50k, 0.6% for AGIs $50k-75k, 0.6% for AGIs $75k-100k, 0.5% for AGIs $100k-200k, 2.8% for AGIs over 200k)
Net capital gain/loss in AGI: +$7,227 (reported on 7.1% of returns)
Here:
+$7,227
State:
+$17,096
(% of AGI for various income ranges: 0.2% for AGIs $25k-50k, 0.3% for AGIs $50k-75k, 0.3% for AGIs $75k-100k, 1.3% for AGIs $100k-200k, 9.4% for AGIs over 200k)
Profit/loss from business: +$7,651 (reported on 15.0% of returns)
Here:
+$7,651
State:
+$12,088
(% of AGI for various income ranges: 6.2% for AGIs below $25k, 1.6% for AGIs $25k-50k, 1.7% for AGIs $50k-75k, 1.1% for AGIs $75k-100k, 2.9% for AGIs $100k-200k, 4.9% for AGIs over 200k)
Taxable individual retirement arrangement distribution: $14,016 (reported on 5.6% of returns)
70607:
$14,016
Louisiana:
$16,085
(% of AGI for various income ranges: 1.2% for AGIs below $25k, 1.7% for AGIs $25k-50k, 2.4% for AGIs $50k-75k, 1.9% for AGIs $75k-100k, 3.2% for AGIs $100k-200k)
Total itemized deductions: $19,200 (21% of AGI, reported on 16.0% of returns)
Here:
$19,200
State:
$23,585
Here:
20.8% of AGI
State:
18.1% of AGI
(% of AGI for various income ranges: 3.5% for AGIs below $25k, 6.4% for AGIs $25k-50k, 8.4% for AGIs $50k-75k, 8.3% for AGIs $75k-100k, 10.2% for AGIs $100k-200k, 8.8% for AGIs over 200k)
Charity contributions: $5,568 (reported on 12.5% of returns)
Here:
$5,568
State:
$5,533
(% of AGI for various income ranges: 0.5% for AGIs below $25k, 1.3% for AGIs $25k-50k, 1.8% for AGIs $50k-75k, 2.1% for AGIs $75k-100k, 2.7% for AGIs $100k-200k, 2.0% for AGIs over 200k)
Taxes paid: $3,890 (reported on 15.9% of returns)
70607:
$3,890
State:
$6,282
(% of AGI for various income ranges: 0.4% for AGIs below $25k, 0.8% for AGIs $25k-50k, 1.2% for AGIs $50k-75k, 1.6% for AGIs $75k-100k, 2.7% for AGIs $100k-200k, 3.2% for AGIs over 200k)
Earned income credit: $2,615 (reported on 31.6% of returns)
Here:
$2,615
State:
$2,633
(% of AGI for various income ranges: 11.0% for AGIs below $25k, 1.5% for AGIs $25k-50k)
Percentage of individuals using paid preparers for their 2012 taxes: 58.9%
Here:
59%
State:
57%
(% for various income ranges: 57.3% for AGIs below $25k, 55.8% for AGIs $25k-50k, 63.7% for AGIs $50k-75k, 61.6% for AGIs $75k-100k, 68.1% for AGIs $100k-200k, 77.8% for AGIs over 200k)
Averages for the 2004 tax year for zip code 70607, filed in 2005:
Average Adjusted Gross Income (AGI) in 2004: $34,015 (Individual Income Tax Returns)
Here:
$34,015
State:
$39,411
Salary/wage: $30,609 (reported on 89.6% of returns)
Here:
$30,609
State:
$34,434
(% of AGI for various income ranges: 101.3% for AGIs below $10k, 84.0% for AGIs $10k-25k, 86.6% for AGIs $25k-50k, 86.5% for AGIs $50k-75k, 87.3% for AGIs $75k-100k, 58.7% for AGIs over 100k)
Taxable interest for individuals: $1,086 (reported on 29.2% of returns)
This zip code:
$1,086
Louisiana:
$1,606
(% of AGI for various income ranges: 1.9% for AGIs below $10k, 1.2% for AGIs $10k-25k, 0.9% for AGIs $25k-50k, 0.8% for AGIs $50k-75k, 0.6% for AGIs $75k-100k, 1.0% for AGIs over 100k)
Taxable dividends: $1,980 (reported on 11.4% of returns)
Here:
$1,980
State:
$3,235
(% of AGI for various income ranges: 1.1% for AGIs below $10k, 0.5% for AGIs $10k-25k, 0.5% for AGIs $25k-50k, 0.3% for AGIs $50k-75k, 0.5% for AGIs $75k-100k, 1.3% for AGIs over 100k)
Net capital gain/loss: +$3,689 (reported on 9.1% of returns)
Here:
+$3,689
State:
+$8,531
(% of AGI for various income ranges: -1.2% for AGIs below $10k, 0.2% for AGIs $10k-25k, 0.1% for AGIs $25k-50k, 0.3% for AGIs $50k-75k, 0.6% for AGIs $75k-100k, 3.7% for AGIs over 100k)
Profit/loss from business: +$4,952 (reported on 12.4% of returns)
Here:
+$4,952
State:
+$9,128
(% of AGI for various income ranges: 3.6% for AGIs below $10k, 3.7% for AGIs $10k-25k, 1.4% for AGIs $25k-50k, 1.0% for AGIs $50k-75k, 1.1% for AGIs $75k-100k, 1.9% for AGIs over 100k)
IRA payment deduction: $2,393 (reported on 1.8% of returns)
70607:
$2,393
Louisiana:
$3,055
(% of AGI for various income ranges: 0.1% for AGIs $10k-25k, 0.2% for AGIs $25k-50k, 0.1% for AGIs $50k-75k, 0.2% for AGIs $75k-100k, 0.1% for AGIs over 100k)
Self-employed pension: $15,909 (reported on 0.1% of returns)
Here:
$15,909
Louisiana:
$17,274
Total itemized deductions: $15,307 (21% of AGI, reported on 14.9% of returns)
Here:
$15,307
State:
$18,222
Here:
20.8% of AGI
State:
20.3% of AGI
(% of AGI for various income ranges: 4.5% for AGIs below $10k, 3.1% for AGIs $10k-25k, 5.7% for AGIs $25k-50k, 7.5% for AGIs $50k-75k, 10.0% for AGIs $75k-100k, 8.0% for AGIs over 100k)
Charity contributions deductions: $4,315 (6% of AGI, reported on 12.5% of returns)
Here:
$4,315
State:
$4,190
Here:
5.6% of AGI
State:
4.4% of AGI
(% of AGI for various income ranges: 0.2% for AGIs below $10k, 0.6% for AGIs $10k-25k, 1.1% for AGIs $25k-50k, 1.7% for AGIs $50k-75k, 2.5% for AGIs $75k-100k, 2.3% for AGIs over 100k)
Total tax: $4,762 (reported on 64.5% of returns)
70607:
$4,762
State:
$6,529
(% of AGI for various income ranges: 2.0% for AGIs below $10k, 3.1% for AGIs $10k-25k, 5.9% for AGIs $25k-50k, 8.7% for AGIs $50k-75k, 10.7% for AGIs $75k-100k, 17.1% for AGIs over 100k)
Earned income credit: $2,005 (reported on 29.9% of returns)
Here:
$2,005
State:
$2,103
Percentage of individuals using paid preparers for their 2004 taxes: 61.8%
Here:
62%
State:
61%
(% for various income ranges: 55.0% for AGIs below $10k, 65.5% for AGIs $10k-25k, 62.0% for AGIs $25k-50k, 61.6% for AGIs $50k-75k, 63.8% for AGIs $75k-100k, 67.8% for AGIs over 100k)
Household received Food Stamps/SNAP in the past 12 months: 2,430 Household did not receive Food Stamps/SNAP in the past 12 months: 8,238
Women who had a birth in the past 12 months: 306 (30 now married, 286 unmarried) Women who did not have a birth in the past 12 months: 6,234 (1,988 now married, 4,257 unmarried)
Housing units in zip code 70607 with a mortgage: 3,297 (57 second mortgage, 53 both second mortgage and home equity loan) Houses without a mortgage: 64
Median monthly owner costs for units with a mortgage: $1,192 Median monthly owner costs for units without a mortgage: $403
Residents with income below the poverty level in 2022:
This zip code:
25.0%
Whole state:
18.6%
Residents with income below 50% of the poverty level in 2022:
This zip code:
16.6%
Whole state:
10.1%
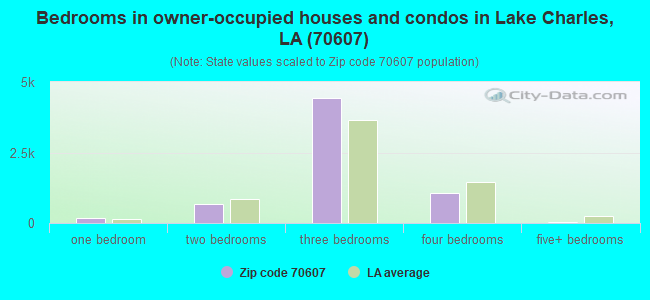
Median number of rooms in houses and condos:
Here:
5.7
State:
6.2
Median number of rooms in apartments:
Here:
4.5
State:
4.4
Notable locations in this zip code not listed on our city pages
Notable locations in zip code 70607: Higgins School (A), Lake Charles Radio Range Station (B), Quail Ridge Mobile Home Park Wastewater Treatment Facility (C), McNeese State University Cowboy Stadium (D), Sweet Lake Ferry (E), Louisiana State University AgCenter Calcasieu Parish Office (F), Cameron Parish Sheriff's Department (G), Cameron Parish Library Grand Lake Branch (H), Calcasieu Parish Sheriff's Office South Lake Charles Law Enforcement Center (I), Grand Lake Volunteer Fire Department (J), Cal Cam Volunteer Fire Department (K), Cajun Country Volunteer Fire Department (L), Lake Charles Training Facility (M), Lake Charles Fire Department Station 6 (N). Display/hide their locations on the map
Churches in zip code 70607 include: Lake Charles Revival Center (A), Lake Charles Bible Church (B), Kingdom Hall of Jehovahs Witnesses (C), Grand Lake Faith Temple (D), Faith Bible Church (E), Eastside Bible Fellowship Church (F), Christian World Ministries (G), Christ the King Catholic Church (H), Christ Bethel Fellowship Church (I). Display/hide their locations on the map
Streams, rivers, and creeks: Bayou Bois Connine (A), Coulee Hippolyte (B), Grand Gully (C), South Fork Black Bayou (D). Display/hide their locations on the map
1,760 married couples with children.
3,567 single-parent households (408 men, 3,159 women).
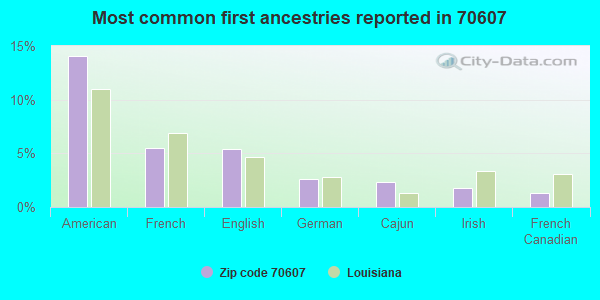
93.2% of residents of 70607 zip code speak English at home.
2.5% of residents speak Spanish at home (46% very well, 15% well, 27% not well, 11% not at all).
2.8% of residents speak other Indo-European language at home (61% very well, 26% well, 12% not well).
1.1% of residents speak Asian or Pacific Island language at home (24% very well, 47% well, 29% not well).
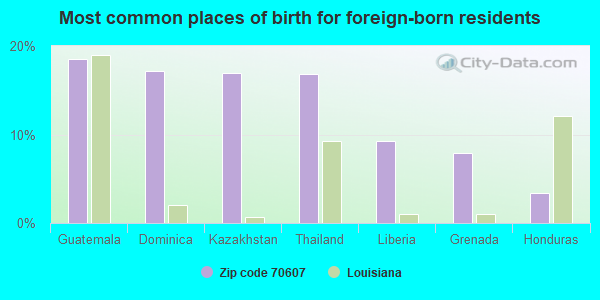
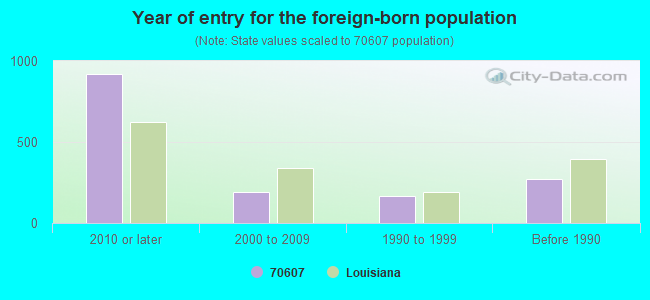
Foreign born population: 1,306 (4.7%) (33.2% of them are naturalized citizens)
Major facilities with environmental interests located in this zip code:
BRENTWOOD ELEMENTARY SCHOOL (3825 BRENTWOOD AVENUE in LAKE CHARLES, LA)
(Geographic Names Information System) (National Center for Education Statistics) - STATE ID-010006 Organizations: CALCASIEU PARISH SCHOOL BOARD (SCHOOL DISTRICT)
GRAND LAKE HIGH SCHOOL (1039 HIGHWAY 384 GRAND LAKE in LAKE CHARLES, LA)
(Geographic Names Information System) (National Center for Education Statistics) - STATE ID-012003 Organizations: CAMERON PARISH SCHOOL BOARD (SCHOOL DISTRICT)
HENRY HEIGHTS ELEMENTARY SCHOOL (3600 LOUISIANA AVENUE in LAKE CHARLES, LA)
(Geographic Names Information System) (National Center for Education Statistics) - STATE ID-010024 Organizations: CALCASIEU PARISH SCHOOL BOARD (SCHOOL DISTRICT)
FAIRVIEW ELEMENTARY SCHOOL (3955 GERSTNER MEMORIAL DRIVE in LAKE CHARLES, LA)
(Geographic Names Information System) (National Center for Education Statistics) - STATE ID-010018 Organizations: CALCASIEU PARISH SCHOOL BOARD (SCHOOL DISTRICT)
F. K. WHITE MIDDLE SCHOOL (1000 EAST MCNEESE STREET in LAKE CHARLES, LA)
(National Center for Education Statistics) - STATE ID-010066 Organizations: CALCASIEU PARISH SCHOOL BOARD (SCHOOL DISTRICT)
GIFFORD TRAILER PARK NO. 1 WATER SYSTEM - LA1019101 (5500 LEGER ROAD in LAKE CHARLES, LA)
(Integrated Compliance Information System) - ICIS-06-2003-1232, FORMAL ENFORCEMENT ACTION,
GLOBAL POLLUTION SERVICES INC (4909 COMMON ST in LAKE CHARLES, LA)
USED OIL PROGRAM (Resource Conservation and Recovery Act (tracking hazardous waste)) Business NAICS classification: ADMINISTRATIVE MANAGEMENT AND GENERAL MANAGEMENT CONSULTING SERVICES. Organizations: MATT BELL (CONTACT/OPERATOR)
, LARRY J WOODCOCK (CONTACT/OWNER)
Alternative names: LARCO ENVIRONMENTAL SVCS
OAK FOREST MOBILE HOME PARK, I (2530 CARLO HENRY RD in LAKE CHARLES, LA)
National Pollutant Discharge Elimination System NON-MAJOR (Tracking pollutant discharge elimination systems) - permit Business SIC classification: SEWERAGE SYSTEMS Alternative names: OAK FOREST MOBILE H-
PRAIRIE LAND CO PRODUCTION FACILITY (8117 CORBINA RD in LAKE CHARLES, LA)
AIR MINOR (AIRS/AFS) Business SIC classification: CRUDE PETROLEUM AND NATURAL GAS Alternative names: PRAIRIE LAND CO.,LC
GREATHOUSE HURRICANE (CP4000HD AIR CURTAIN in , LA)
AIR MINOR (AIRS/AFS) Business SIC classification: REFUSE SYSTEMS Alternative names: GREATHOUSE CONSTRUCTION PORTABLE HURRICA
CITY OF LAKE CHARLES (SUGARLOAF COMMUNITY in LAKE CHARLES, LA)
National Pollutant Discharge Elimination System NON-MAJOR (Tracking pollutant discharge elimination systems) - permit Business SIC classification: PLASTERING, DRYWALL, ACOUSTICAL, AND INSULATION WORK Alternative names: CITY OF LAKE CHARLES-SUGARLOAF, CURRY-CHASE LLC
FORMER RITE AID STORE (3402 FIFTH AVE in LAKE CHARLES, LA)
AIR MINOR (AIRS/AFS) Business SIC classification: REFUSE SYSTEMS Alternative names: CARL FEIGEL, K & B DRUG STORE NUMBER 59
NATL WEATHER SVC FORECAST OFC (500 AIRPORT BLVD NO 115 in LAKE CHARLES, LA) . Federal Facility. DEPARTMENT OF COMMERCE
Conditionally Exempt Small Quantity Generators, less than 100 kg/month of hazardous waste (Resource Conservation and Recovery Act (tracking hazardous waste)) - notification Organizations: NWS NOAA DEPT OF COMMERCE (CONTACT/OWNER)
Housing units lacking complete plumbing facilities: 5.4% Housing units lacking complete kitchen facilities: 4.7%
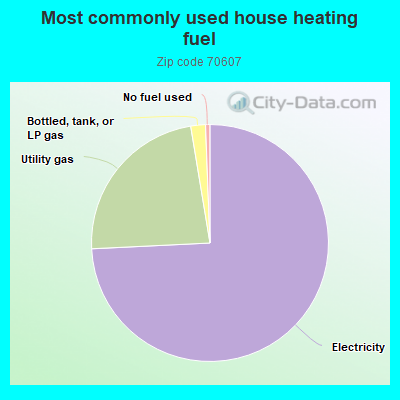
74.3%Electricity
23.2%Utility gas
2.0%Bottled, tank, or LP gas
0.6%No fuel used
Place of birth for U.S.-born residents:
This state: 22,405
Northeast: 356
Midwest: 158
South: 2,771
West: 635
52% of the 70607 zip code residents lived in the same house 5 years ago. Out of people who lived in different houses, 70% lived in this county. Out of people who lived in different counties, 50% lived in Louisiana.
87% of the 70607 zip code residents lived in the same house 1 year ago. Out of people who lived in different houses, 54% moved from this county. Out of people who lived in different houses, 27% moved from different county within same state. Out of people who lived in different houses, 11% moved from different state. Out of people who lived in different houses, 8% moved from abroad.
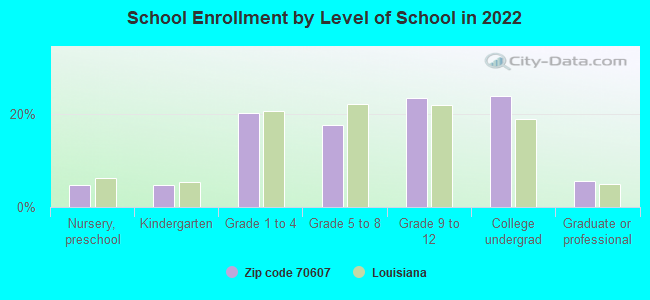
Private vs. public school enrollment:
Students in private schools in grades 1 to 8 (elementary and middle school): 116
Here:
4.1%
Louisiana:
19.6%
Students in private schools in grades 9 to 12 (high school): 104
Here:
6.0%
Louisiana:
18.3%
Students in private undergraduate colleges: 180
Here:
10.0%
Louisiana:
17.4%
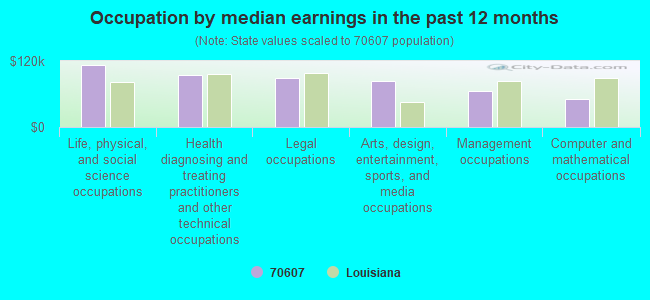
Occupation by median earnings in the past 12 months ($)
112,772Life, physical, and social science occupations
94,134Health diagnosing and treating practitioners and other technical occupations
89,251Legal occupations
83,720Arts, design, entertainment, sports, and media occupations
65,649Management occupations
51,240Computer and mathematical occupations
Companies with federal contracts located in this zip code (LAKE CHARLES, LA):
VISION AVIATION, LLC (500 AIRPORT BLVD #H LAKE C; small business)
$218,160 with Defense Logistics Agency for Liquid Propellants and Fuels, Petroleum Base. Signed on 2003-11-13. Completion date: 2007-03-31.
DANIEL R LAVERGNE JR (903 HIGHWAY 384) : $103,634 in 21 contractsfrom 2001 to 2005
Contracts for Landscaping/Groundskeeping Services by Army, U.S. Army Corps of Engineers - civil program financing only Signed by year:2000: $0; 2001: $17,017; 2002: $11,104; 2003: $20,691; 2004: $44,732; 2005: $10,090; 2006: $0.
Biggest contracts:
$19,394 with Army for Landscaping/Groundskeeping Services. Signed on 2005-03-11. Completion date: 2005-07-01.
$19,394 with U.S. Army Corps of Engineers - civil program financing only for Landscaping/Groundskeeping Services. Signed on 2005-03-11. Completion date: 2005-07-01.
$17,832, same as above.Signed on 2004-03-10. Completion date: 2002-07-05.
$17,832 with Army for Landscaping/Groundskeeping Services. Signed on 2004-03-10. Completion date: 2002-07-05.
BOARDING HOUSE (3353 HWY 14 EAST; small business) : $36,426 in 3 contractsfrom 2004 to 2005
$14,880 with Army for Food Services. Signed on 2005-12-01. Completion date: 2005-11-01.
$14,400, same as above.Signed on 2005-11-14. Completion date: 2005-11-01.
$7,146 with Army for Food Items For Resale. Signed on 2004-05-06. Completion date: 2004-05-16.
TRUE BLUE WATERSPORTS LLC (5959 COMMON ST; small business)
$4,944 with Army for Marine Lifesaving and Diving Equipment. Signed on 2004-09-29. Completion date: 2004-10-16.
Top industries in this zip code by the number of employees in 2005:
Health Care and Social Assistance: General Medical and Surgical Hospitals (500-999 employees: 1 establishment)
Other Services (except Public Administration): Religious Organizations (50-99: 1, 20-49: 1, 10-19: 2, 5-9: 5, 1-4: 4)
Health Care and Social Assistance: Services for the Elderly and Persons with Disabilities (100-249: 1)
Accommodation and Food Services: Full-Service Restaurants (50-99: 1, 20-49: 1)
Health Care and Social Assistance: Child Day Care Services (20-49: 2, 10-19: 2, 5-9: 1, 1-4: 1)
Accommodation and Food Services: Limited-Service Restaurants (20-49: 3, 1-4: 1)
Administrative and Support and Waste Management and Remediation Services: Office Administrative Services (50-99: 1, 1-4: 1)
People in group quarters in 2010:
421 people in college/university student housing
29 people in group homes intended for adults
13 people in nursing facilities/skilled-nursing facilities
11 people in mental (psychiatric) hospitals and psychiatric units in other hospitals
People in group quarters in 2000:
38 people in homes for the mentally retarded
28 people in wards in general hospitals for patients who have no usual home elsewhere
10 people in college dormitories (includes college quarters off campus)
5 people in other group homes
5 people in other nonhousehold living situations
Fatal accident statistics in 2013:
Fatal accident count: 5
Vehicles involved in fatal accidents: 7
Fatal accidents caused by drunken drivers: 2
Fatalities: 7
Persons involved in fatal accidents: 15
Pedestrians involved in fatal accidents: 0
Fatal accident statistics in 2012:
Fatal accident count: 3
Vehicles involved in fatal accidents: 4
Fatal accidents caused by drunken drivers: 2
Fatalities: 3
Persons involved in fatal accidents: 4
Pedestrians involved in fatal accidents: 1
Home Mortgage Disclosure Act Aggregated Statistics For Year 2009 (Based on 4 full and 8 partial tracts)
A) FHA, FSA/RHS & VA Home Purchase Loans
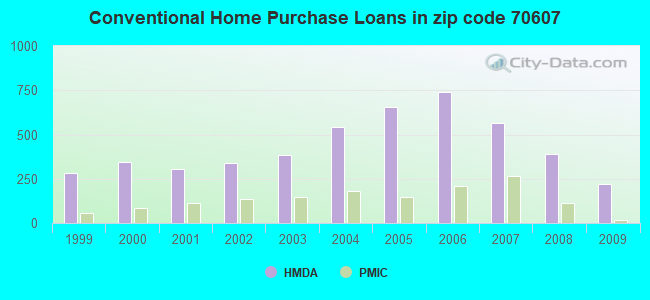
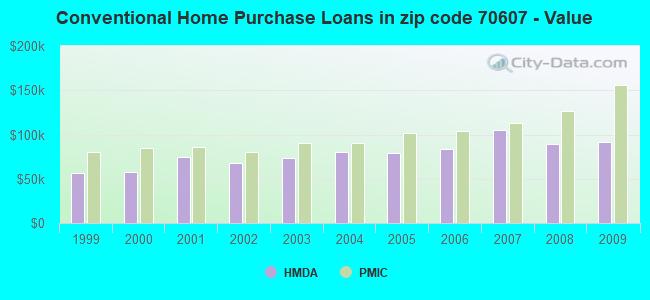
B) Conventional Home Purchase Loans
C) Refinancings
D) Home Improvement Loans
E) Loans on Dwellings For 5+ Families
F) Non-occupant Loans on < 5 Family Dwellings (A B C & D)
G) Loans On Manufactured Home Dwelling (A B C & D)
Number
Average Value
Number
Average Value
Number
Average Value
Number
Average Value
Number
Average Value
Number
Average Value
Number
Average Value
LOANS ORIGINATED
149
$119,057
219
$91,314
416
$122,638
81
$37,198
7
$1,530,296
114
$64,755
131
$30,578
APPLICATIONS APPROVED, NOT ACCEPTED
12
$77,120
25
$94,370
44
$133,588
8
$31,548
0
$0
4
$170,522
23
$59,023
APPLICATIONS DENIED
41
$121,563
70
$97,161
211
$133,199
71
$21,974
0
$0
5
$108,696
65
$38,050
APPLICATIONS WITHDRAWN
18
$131,440
17
$109,685
66
$124,604
9
$75,789
2
$351,640
0
$0
13
$56,052
FILES CLOSED FOR INCOMPLETENESS
6
$162,235
3
$166,310
45
$132,083
9
$22,494
0
$0
1
$112,880
3
$61,627
Aggregated Statistics For Year 2008 (Based on 4 full and 8 partial tracts)
A) FHA, FSA/RHS & VA Home Purchase Loans
B) Conventional Home Purchase Loans
C) Refinancings
D) Home Improvement Loans
E) Loans on Dwellings For 5+ Families
F) Non-occupant Loans on < 5 Family Dwellings (A B C & D)
G) Loans On Manufactured Home Dwelling (A B C & D)
Number
Average Value
Number
Average Value
Number
Average Value
Number
Average Value
Number
Average Value
Number
Average Value
Number
Average Value
LOANS ORIGINATED
121
$123,565
391
$89,099
372
$106,617
92
$34,901
8
$1,509,495
131
$61,198
204
$33,134
APPLICATIONS APPROVED, NOT ACCEPTED
11
$74,489
78
$64,189
34
$110,986
21
$56,620
0
$0
11
$49,662
61
$46,834
APPLICATIONS DENIED
33
$124,934
113
$84,310
300
$106,071
82
$35,329
0
$0
28
$60,849
93
$59,105
APPLICATIONS WITHDRAWN
11
$108,675
31
$88,340
115
$126,806
3
$52,223
0
$0
15
$82,719
15
$47,521
FILES CLOSED FOR INCOMPLETENESS
4
$104,765
11
$150,697
28
$152,542
1
$74,050
0
$0
1
$135,760
2
$96,450
Aggregated Statistics For Year 2007 (Based on 4 full and 8 partial tracts)
A) FHA, FSA/RHS & VA Home Purchase Loans
B) Conventional Home Purchase Loans
C) Refinancings
D) Home Improvement Loans
E) Loans on Dwellings For 5+ Families
F) Non-occupant Loans on < 5 Family Dwellings (A B C & D)
G) Loans On Manufactured Home Dwelling (A B C & D)
Number
Average Value
Number
Average Value
Number
Average Value
Number
Average Value
Number
Average Value
Number
Average Value
Number
Average Value
LOANS ORIGINATED
40
$132,405
567
$104,559
410
$105,607
174
$39,169
7
$426,224
129
$78,401
169
$38,161
APPLICATIONS APPROVED, NOT ACCEPTED
7
$43,884
96
$89,672
82
$106,784
16
$19,458
0
$0
12
$85,839
45
$43,739
APPLICATIONS DENIED
14
$105,367
187
$83,254
365
$105,802
119
$39,926
0
$0
30
$92,584
121
$48,470
APPLICATIONS WITHDRAWN
2
$131,280
70
$85,968
134
$124,521
20
$71,814
2
$2,867,805
19
$83,755
29
$46,534
FILES CLOSED FOR INCOMPLETENESS
2
$95,265
8
$131,599
35
$140,366
4
$97,145
0
$0
0
$0
2
$37,095
Aggregated Statistics For Year 2006 (Based on 4 full and 8 partial tracts)
A) FHA, FSA/RHS & VA Home Purchase Loans
B) Conventional Home Purchase Loans
C) Refinancings
D) Home Improvement Loans
E) Loans on Dwellings For 5+ Families
F) Non-occupant Loans on < 5 Family Dwellings (A B C & D)
G) Loans On Manufactured Home Dwelling (A B C & D)
Number
Average Value
Number
Average Value
Number
Average Value
Number
Average Value
Number
Average Value
Number
Average Value
Number
Average Value
LOANS ORIGINATED
32
$96,549
742
$84,005
427
$95,321
173
$29,869
4
$443,845
130
$62,121
214
$33,995
APPLICATIONS APPROVED, NOT ACCEPTED
10
$47,852
139
$77,954
98
$98,634
27
$31,659
0
$0
9
$77,686
86
$45,444
APPLICATIONS DENIED
34
$62,694
271
$70,614
328
$93,296
133
$37,266
2
$383,015
43
$72,786
192
$39,922
APPLICATIONS WITHDRAWN
0
$0
54
$98,809
249
$97,111
41
$63,318
0
$0
16
$67,462
20
$34,581
FILES CLOSED FOR INCOMPLETENESS
1
$46,620
24
$102,194
66
$112,914
0
$0
0
$0
5
$56,378
2
$29,675
Aggregated Statistics For Year 2005 (Based on 4 full and 8 partial tracts)
A) FHA, FSA/RHS & VA Home Purchase Loans
B) Conventional Home Purchase Loans
C) Refinancings
D) Home Improvement Loans
E) Loans on Dwellings For 5+ Families
F) Non-occupant Loans on < 5 Family Dwellings (A B C & D)
G) Loans On Manufactured Home Dwelling (A B C & D)
Number
Average Value
Number
Average Value
Number
Average Value
Number
Average Value
Number
Average Value
Number
Average Value
Number
Average Value
LOANS ORIGINATED
43
$76,018
654
$79,152
450
$88,781
169
$20,592
3
$332,157
103
$61,196
188
$27,519
APPLICATIONS APPROVED, NOT ACCEPTED
9
$50,621
145
$72,978
152
$72,989
31
$26,939
0
$0
14
$84,416
86
$44,082
APPLICATIONS DENIED
18
$73,336
260
$63,204
423
$86,409
109
$27,663
2
$108,505
42
$50,260
151
$41,101
APPLICATIONS WITHDRAWN
2
$65,340
76
$96,942
186
$104,699
25
$102,004
0
$0
25
$85,405
14
$60,341
FILES CLOSED FOR INCOMPLETENESS
1
$52,840
18
$89,099
100
$96,912
0
$0
0
$0
2
$66,250
4
$66,780
Aggregated Statistics For Year 2004 (Based on 4 full and 8 partial tracts)
A) FHA, FSA/RHS & VA Home Purchase Loans
B) Conventional Home Purchase Loans
C) Refinancings
D) Home Improvement Loans
E) Loans on Dwellings For 5+ Families
F) Non-occupant Loans on < 5 Family Dwellings (A B C & D)
G) Loans On Manufactured Home Dwelling (A B C & D)
Number
Average Value
Number
Average Value
Number
Average Value
Number
Average Value
Number
Average Value
Number
Average Value
Number
Average Value
LOANS ORIGINATED
46
$85,782
545
$79,669
576
$84,288
135
$28,780
4
$3,287,930
136
$51,367
153
$32,949
APPLICATIONS APPROVED, NOT ACCEPTED
4
$96,785
108
$67,009
197
$75,719
20
$23,706
0
$0
14
$51,266
75
$32,642
APPLICATIONS DENIED
9
$116,069
237
$54,917
567
$77,039
110
$31,233
0
$0
56
$58,407
182
$37,643
APPLICATIONS WITHDRAWN
2
$110,720
41
$84,719
182
$100,302
11
$58,070
0
$0
14
$62,892
13
$53,650
FILES CLOSED FOR INCOMPLETENESS
4
$71,410
11
$103,685
121
$89,172
8
$21,109
0
$0
6
$74,675
7
$78,697
Aggregated Statistics For Year 2003 (Based on 4 full and 8 partial tracts)
A) FHA, FSA/RHS & VA Home Purchase Loans
B) Conventional Home Purchase Loans
C) Refinancings
D) Home Improvement Loans
E) Loans on Dwellings For 5+ Families
F) Non-occupant Loans on < 5 Family Dwellings (A B C & D)
Number
Average Value
Number
Average Value
Number
Average Value
Number
Average Value
Number
Average Value
Number
Average Value
LOANS ORIGINATED
57
$89,884
383
$73,071
1,001
$87,948
139
$21,602
1
$130,020
110
$52,575
APPLICATIONS APPROVED, NOT ACCEPTED
2
$76,585
50
$66,446
213
$76,981
24
$21,766
0
$0
12
$46,546
APPLICATIONS DENIED
18
$77,046
119
$64,990
535
$75,638
91
$19,381
0
$0
40
$46,449
APPLICATIONS WITHDRAWN
4
$72,892
53
$76,669
184
$79,951
6
$49,240
0
$0
10
$46,762
FILES CLOSED FOR INCOMPLETENESS
3
$85,497
5
$137,176
39
$81,689
2
$55,420
0
$0
1
$21,240
Aggregated Statistics For Year 2002 (Based on 4 full and 8 partial tracts)
A) FHA, FSA/RHS & VA Home Purchase Loans
B) Conventional Home Purchase Loans
C) Refinancings
D) Home Improvement Loans
E) Loans on Dwellings For 5+ Families
F) Non-occupant Loans on < 5 Family Dwellings (A B C & D)
Number
Average Value
Number
Average Value
Number
Average Value
Number
Average Value
Number
Average Value
Number
Average Value
LOANS ORIGINATED
45
$76,138
338
$67,891
567
$79,052
166
$17,454
4
$292,595
108
$64,763
APPLICATIONS APPROVED, NOT ACCEPTED
11
$77,214
82
$47,583
132
$64,183
12
$14,747
0
$0
5
$39,536
APPLICATIONS DENIED
11
$74,833
184
$52,437
332
$62,771
81
$16,007
0
$0
13
$37,738
APPLICATIONS WITHDRAWN
0
$0
26
$66,217
136
$68,805
1
$15,130
0
$0
12
$42,074
FILES CLOSED FOR INCOMPLETENESS
0
$0
8
$84,125
38
$78,789
0
$0
0
$0
0
$0
Aggregated Statistics For Year 2001 (Based on 4 full and 8 partial tracts)
A) FHA, FSA/RHS & VA Home Purchase Loans
B) Conventional Home Purchase Loans
C) Refinancings
D) Home Improvement Loans
F) Non-occupant Loans on < 5 Family Dwellings (A B C & D)
Number
Average Value
Number
Average Value
Number
Average Value
Number
Average Value
Number
Average Value
LOANS ORIGINATED
65
$72,515
307
$74,276
545
$71,637
171
$15,184
70
$38,846
APPLICATIONS APPROVED, NOT ACCEPTED
1
$77,650
74
$44,089
194
$55,234
19
$20,851
15
$38,053
APPLICATIONS DENIED
18
$58,407
225
$46,683
384
$64,807
71
$16,096
20
$40,099
APPLICATIONS WITHDRAWN
5
$65,644
29
$66,420
185
$61,426
11
$27,449
7
$40,903
FILES CLOSED FOR INCOMPLETENESS
1
$61,120
11
$104,942
22
$71,624
0
$0
1
$24,350
Aggregated Statistics For Year 2000 (Based on 4 full and 8 partial tracts)
A) FHA, FSA/RHS & VA Home Purchase Loans
B) Conventional Home Purchase Loans
C) Refinancings
D) Home Improvement Loans
E) Loans on Dwellings For 5+ Families
F) Non-occupant Loans on < 5 Family Dwellings (A B C & D)
Number
Average Value
Number
Average Value
Number
Average Value
Number
Average Value
Number
Average Value
Number
Average Value
LOANS ORIGINATED
104
$64,997
345
$57,436
313
$60,234
139
$14,895
4
$217,012
71
$41,424
APPLICATIONS APPROVED, NOT ACCEPTED
23
$52,583
103
$47,987
122
$60,189
30
$25,572
0
$0
11
$54,618
APPLICATIONS DENIED
46
$53,960
258
$40,817
364
$52,091
90
$14,381
0
$0
13
$26,396
APPLICATIONS WITHDRAWN
15
$42,477
54
$66,824
179
$50,059
16
$34,616
0
$0
8
$48,991
FILES CLOSED FOR INCOMPLETENESS
0
$0
4
$47,298
35
$70,069
2
$14,450
1
$733,110
0
$0
Aggregated Statistics For Year 1999 (Based on 2 full and 4 partial tracts)
A) FHA, FSA/RHS & VA Home Purchase Loans
B) Conventional Home Purchase Loans
C) Refinancings
D) Home Improvement Loans
E) Loans on Dwellings For 5+ Families
F) Non-occupant Loans on < 5 Family Dwellings (A B C & D)
2009 - 2018 National Fire Incident Reporting System (NFIRS) incidents
Based on the data from the years 2009 - 2018 the average number of fire incidents per year is 65. The highest number of fires - 86 took place in 2014, and the least - 50 in 2009. The data has an increasing trend.
When looking into fire subcategories, the most incidents belonged to: Outside Fires (54.4%), and Structure Fires (30.7%).
Fire incident types reported to NFIRS in Zip Code 70607


 Nearest zip codes: 70605, 70630, 70601, 70669, 70615, 70632.
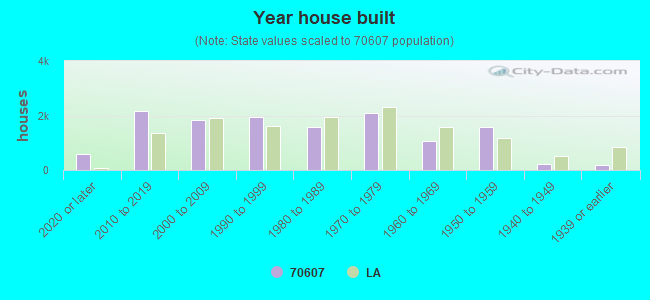


 Based on the data from the years 2009 - 2018 the average number of fire incidents per year is 65. The highest number of fires - 86 took place in 2014, and the least - 50 in 2009. The data has an increasing trend.
 When looking into fire subcategories, the most incidents belonged to: Outside Fires (54.4%), and Structure Fires (30.7%).