Estimated zip code population in 2022: 2,006 Zip code population in 2010: 1,440 Zip code population in 2000: 892
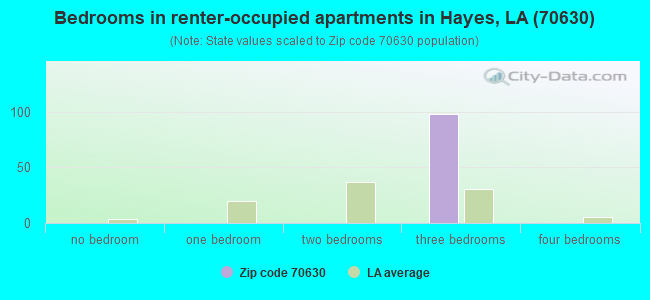
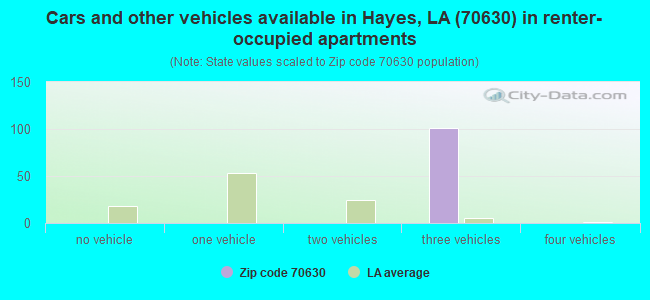
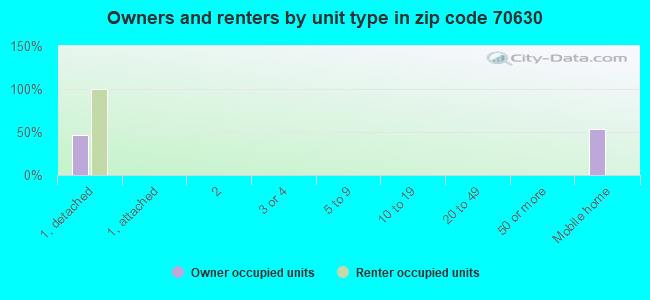
Houses and condos: 850 Renter-occupied apartments: 98
% of renters here:
14%
State:
32%
March 2022 cost of living index in zip code 70630: 78.1 (low, U.S. average is 100)
Land area: 185.1 sq. mi. Water area: 6.9 sq. mi.
Population density: 11 people per square mile
(very low).
OSM Map
General Map
Google Map
MSN Map
OSM Map
General Map
Google Map
MSN Map
OSM Map
General Map
Google Map
MSN Map
OSM Map
General Map
Google Map
MSN Map
Please wait while loading the map...
Median real estate property taxes paid for housing units with mortgages in 2022: $287 (0.1%) Median real estate property taxes paid for housing units with no mortgage in 2022: $1,708 (0.9%)
Business Search- 14 Million verified businesses
Males: 1,024
(51.1%)
Females: 981
(48.9%)
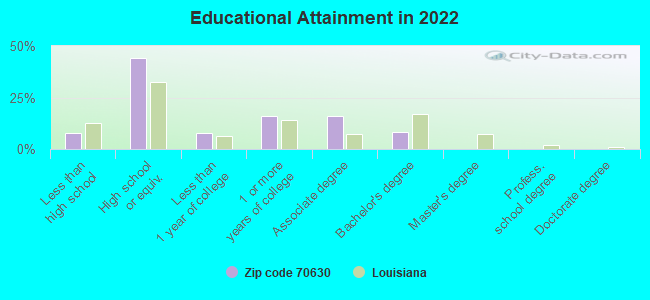
For population 25 years and over in 70630:
High school or higher: 91.7%
Bachelor's degree or higher: 8.0%
Graduate or professional degree: 0.0%
Unemployed: 6.8%
Mean travel time to work (commute): 41.3 minutes
For population 15 years and over in 70630:
Never married: 30.6%
Now married: 51.8%
Separated: 3.6%
Widowed: 4.7%
Divorced: 9.2%
Zip code 70630 compared to state average:
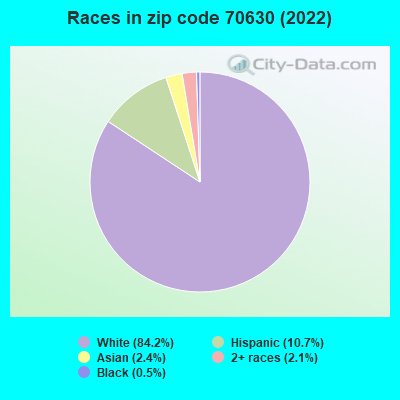
Black race population percentage significantly below state average.
Hispanic race population percentage above state average.
Median age above state average.
Foreign-born population percentage above state average.
Renting percentage significantly below state average.
Length of stay since moving in significantly above state average.
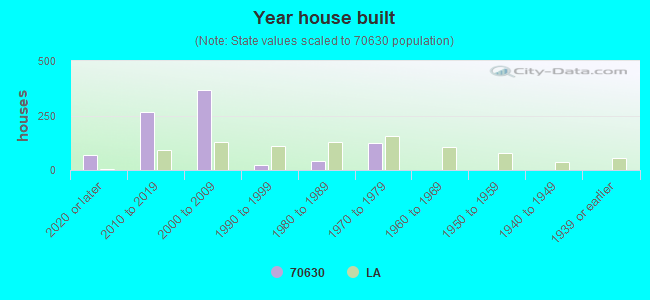
House age significantly below state average.
Percentage of population with a bachelor's degree or higher significantly below state average.
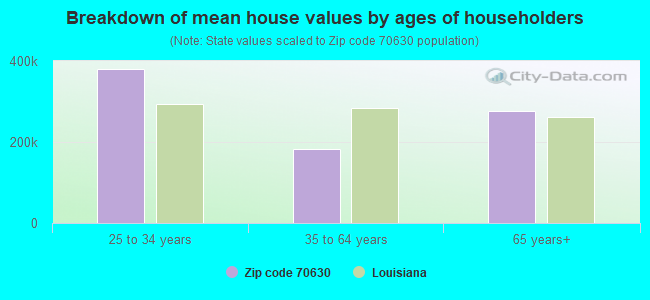
Estimated median house/condo value in 2022: $189,894
70630:
$189,894
Louisiana:
$209,200
According to our research of Louisiana and other state lists, there were 3 registered sex offenders living in 70630 zip code as of April 26, 2024. The ratio of all residents to sex offenders in zip code 70630 is 517 to 1. The ratio of registered sex offenders to all residents in this zip code is lower than the state average.
Median resident age:
This zip code:
44.1 years
Louisiana median age:
38.2 years
Average household size:
This zip code:
2.8 people
Louisiana:
2.5 people
Averages for the 2020 tax year for zip code 70630, filed in 2021:
Average Adjusted Gross Income (AGI) in 2020: $93,071 (Individual Income Tax Returns)
Here:
$93,071
State:
$60,757
Salary/wage: $67,664 (reported on 84.1% of returns)
Here:
$67,664
State:
$50,882
(% of AGI for various income ranges: 1145.8% for AGIs below $25k, 3246.7% for AGIs $25k-50k, 5761.2% for AGIs $50k-75k, 9268.0% for AGIs $75k-100k, 12941.8% for AGIs $100k-200k)
Taxable interest for individuals: $1,092 (reported on 38.1% of returns)
This zip code:
$1,092
Louisiana:
$1,576
(% of AGI for various income ranges: 6.7% for AGIs below $25k, 6.7% for AGIs $25k-50k, 11.2% for AGIs $50k-75k, 14.0% for AGIs $75k-100k, 59.1% for AGIs $100k-200k)
Ordinary dividends: $6,709 (reported on 17.5% of returns)
Here:
$6,709
State:
$7,743
(% of AGI for various income ranges: 79.2% for AGIs $25k-50k, 66.0% for AGIs $75k-100k, 35.5% for AGIs $100k-200k)
Net capital gain/loss in AGI: +$3,364 (reported on 17.5% of returns)
Here:
+$3,364
State:
+$16,917
(% of AGI for various income ranges: 34.2% for AGIs below $25k, 82.5% for AGIs $50k-75k, 239.1% for AGIs $100k-200k)
Profit/loss from business: +$3,900 (reported on 20.6% of returns)
Here:
+$3,900
State:
+$7,679
(% of AGI for various income ranges: 234.2% for AGIs below $25k, 76.7% for AGIs $25k-50k, 183.8% for AGIs $50k-75k)
Taxable individual retirement arrangement distribution: $33,860 (reported on 7.9% of returns)
70630:
$33,860
Louisiana:
$20,716
(% of AGI for various income ranges: 191.7% for AGIs below $25k, 2926.0% for AGIs $75k-100k)
Total itemized deductions: $64,540 (reported on 23.8% of returns)
Here:
$64,540
State:
$36,265
(% of AGI for various income ranges: 924.2% for AGIs below $25k, 1676.2% for AGIs $50k-75k, 2232.0% for AGIs $75k-100k, 3500.9% for AGIs $100k-200k)
Taxes paid: $6,500 (reported on 4.8% of returns)
70630:
$6,500
State:
$6,643
(% of AGI for various income ranges: 177.3% for AGIs $100k-200k)
Earned income credit: $2,456 (reported on 14.3% of returns)
Here:
$2,456
State:
$2,671
(% of AGI for various income ranges: 100.8% for AGIs below $25k, 83.3% for AGIs $25k-50k)
Percentage of individuals using paid preparers for their 2020 taxes: 93.7%
Here:
94%
State:
92%
(% for various income ranges: 88.2% for AGIs below $25k, 92.9% for AGIs $25k-50k, 90.0% for AGIs $50k-75k, 100.0% for AGIs $75k-100k, 100.0% for AGIs $100k-200k, 100.0% for AGIs over 200k)
Averages for the 2012 tax year for zip code 70630, filed in 2013:
Average Adjusted Gross Income (AGI) in 2012: $68,907 (Individual Income Tax Returns)
Here:
$68,907
State:
$56,730
Salary/wage: $50,248 (reported on 85.2% of returns)
Here:
$50,248
State:
$45,545
(% of AGI for various income ranges: 74.0% for AGIs below $25k, 80.6% for AGIs $25k-50k, 83.8% for AGIs $50k-75k, 83.0% for AGIs $75k-100k, 110.5% for AGIs $100k-200k)
Taxable interest for individuals: $714 (reported on 36.1% of returns)
This zip code:
$714
Louisiana:
$1,804
(% of AGI for various income ranges: 0.5% for AGIs below $25k, 0.3% for AGIs $25k-50k, 1.0% for AGIs $50k-75k, 0.1% for AGIs $75k-100k, 0.6% for AGIs $100k-200k)
Ordinary dividends: $1,173 (reported on 18.0% of returns)
Here:
$1,173
State:
$7,610
(% of AGI for various income ranges: 1.0% for AGIs below $25k, 0.9% for AGIs $50k-75k, 0.5% for AGIs $100k-200k)
Net capital gain/loss in AGI: +$2,671 (reported on 11.5% of returns)
Here:
+$2,671
State:
+$17,096
Profit/loss from business: +$13,400 (reported on 21.3% of returns)
Here:
+$13,400
State:
+$12,088
(% of AGI for various income ranges: 7.8% for AGIs below $25k, 1.4% for AGIs $25k-50k, 5.0% for AGIs $50k-75k, 12.6% for AGIs $100k-200k)
Taxable individual retirement arrangement distribution: $11,400 (reported on 6.6% of returns)
70630:
$11,400
Louisiana:
$16,085
Total itemized deductions: $23,345 (13% of AGI, reported on 18.0% of returns)
Here:
$23,345
State:
$23,585
Here:
12.6% of AGI
State:
18.1% of AGI
(% of AGI for various income ranges: 13.2% for AGIs below $25k, 5.2% for AGIs $50k-75k, 7.8% for AGIs $75k-100k, 16.1% for AGIs $100k-200k)
Charity contributions: $5,175 (reported on 13.1% of returns)
Here:
$5,175
State:
$5,533
(% of AGI for various income ranges: 3.0% for AGIs $50k-75k, 2.3% for AGIs $100k-200k)
Taxes paid: $5,840 (reported on 16.4% of returns)
70630:
$5,840
State:
$6,282
(% of AGI for various income ranges: 1.2% for AGIs $50k-75k, 1.1% for AGIs $75k-100k, 4.9% for AGIs $100k-200k)
Earned income credit: $2,182 (reported on 18.0% of returns)
Here:
$2,182
State:
$2,633
(% of AGI for various income ranges: 6.8% for AGIs below $25k, 1.4% for AGIs $25k-50k)
Percentage of individuals using paid preparers for their 2012 taxes: 67.2%
Here:
67%
State:
57%
(% for various income ranges: 60.0% for AGIs below $25k, 64.3% for AGIs $25k-50k, 72.7% for AGIs $50k-75k, 71.4% for AGIs $75k-100k, 71.4% for AGIs $100k-200k, 100.0% for AGIs over 200k)
Averages for the 2004 tax year for zip code 70630, filed in 2005:
Average Adjusted Gross Income (AGI) in 2004: $38,444 (Individual Income Tax Returns)
Here:
$38,444
State:
$39,411
Salary/wage: $35,359 (reported on 82.1% of returns)
Here:
$35,359
State:
$34,434
(% of AGI for various income ranges: 86.0% for AGIs below $10k, 81.9% for AGIs $10k-25k, 78.9% for AGIs $25k-50k, 79.6% for AGIs $50k-75k, 76.2% for AGIs $75k-100k, 54.3% for AGIs over 100k)
Taxable interest for individuals: $921 (reported on 40.2% of returns)
This zip code:
$921
Louisiana:
$1,606
(% of AGI for various income ranges: 4.0% for AGIs below $10k, 1.1% for AGIs $10k-25k, 1.8% for AGIs $25k-50k, 0.4% for AGIs $50k-75k, 1.1% for AGIs $75k-100k, 0.1% for AGIs over 100k)
Taxable dividends: $793 (reported on 18.3% of returns)
Here:
$793
State:
$3,235
(% of AGI for various income ranges: 1.2% for AGIs below $10k, 0.1% for AGIs $10k-25k, 0.7% for AGIs $25k-50k, 0.1% for AGIs $50k-75k, 0.8% for AGIs $75k-100k)
Net capital gain/loss: +$1,000 (reported on 16.0% of returns)
Here:
+$1,000
State:
+$8,531
(% of AGI for various income ranges: -2.6% for AGIs below $10k, -0.5% for AGIs $25k-50k, 0.3% for AGIs $50k-75k, 2.8% for AGIs $75k-100k)
Profit/loss from business: +$8,337 (reported on 18.7% of returns)
Here:
+$8,337
State:
+$9,128
(% of AGI for various income ranges: 8.7% for AGIs below $10k, 5.4% for AGIs $10k-25k, 1.9% for AGIs $25k-50k, 9.1% for AGIs $50k-75k)
Profit/loss from farming: +$2,128 (reported on 9.9% of returns)
Here:
+$2,128
State:
-$6,401
Total itemized deductions: $13,691 (19% of AGI, reported on 14.3% of returns)
Here:
$13,691
State:
$18,222
Here:
18.6% of AGI
State:
20.3% of AGI
(% of AGI for various income ranges: 5.8% for AGIs $25k-50k, 4.5% for AGIs $50k-75k, 6.4% for AGIs $75k-100k, 8.1% for AGIs over 100k)
Charity contributions deductions: $3,417 (5% of AGI, reported on 12.6% of returns)
Here:
$3,417
State:
$4,190
Here:
4.5% of AGI
State:
4.4% of AGI
(% of AGI for various income ranges: 1.5% for AGIs $25k-50k, 1.0% for AGIs $50k-75k, 0.6% for AGIs $75k-100k, 2.5% for AGIs over 100k)
Total tax: $4,991 (reported on 73.5% of returns)
70630:
$4,991
State:
$6,529
(% of AGI for various income ranges: 2.8% for AGIs below $10k, 3.8% for AGIs $10k-25k, 6.2% for AGIs $25k-50k, 9.1% for AGIs $50k-75k, 10.1% for AGIs $75k-100k, 20.0% for AGIs over 100k)
Earned income credit: $1,827 (reported on 15.8% of returns)
Here:
$1,827
State:
$2,103
Percentage of individuals using paid preparers for their 2004 taxes: 65.1%
Here:
65%
State:
61%
(% for various income ranges: 53.3% for AGIs below $10k, 51.4% for AGIs $10k-25k, 77.0% for AGIs $25k-50k, 71.0% for AGIs $50k-75k, 77.5% for AGIs $75k-100k, 86.7% for AGIs over 100k)
Household received Food Stamps/SNAP in the past 12 months: 20 Household did not receive Food Stamps/SNAP in the past 12 months: 684
Women who did not have a birth in the past 12 months: 663 (323 now married, 337 unmarried)
Housing units in zip code 70630 with a mortgage: 348 Median monthly owner costs for units with a mortgage: $1,083 Median monthly owner costs for units without a mortgage: $352
Residents with income below the poverty level in 2022:
This zip code:
5.5%
Whole state:
18.6%
Residents with income below 50% of the poverty level in 2022:
This zip code:
0.8%
Whole state:
10.1%
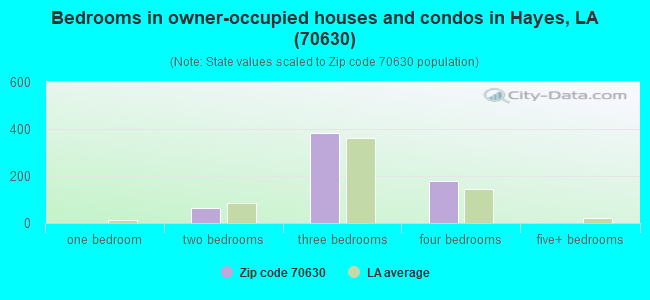
Median number of rooms in houses and condos:
Here:
6.1
State:
6.2
Notable locations in this zip code not listed on our city pages
Notable locations in zip code 70630: Coastal Hunting Club (A), Sweet Lake Pumping Station (B), Calcasieu Parish Library Bell City Branch (C), Holmwood Fire Station (D). Display/hide their locations on the map
Size of family households: 81 2-persons, 354 3-persons, 66 4-persons, 98 5-persons, 10 6-persons
Size of nonfamily households: 52 1-person, 38 2-persons
238 married couples with children.
111 single-parent households (44 men, 67 women).
83.9% of residents of 70630 zip code speak English at home.
10.0% of residents speak Spanish at home (28% well, 72% not well).
4.1% of residents speak other Indo-European language at home (85% very well, 15% well).
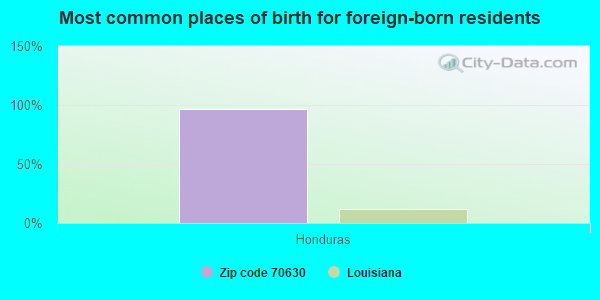
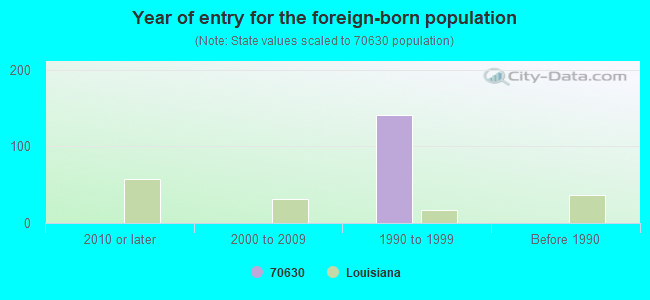
Foreign born population: 149 (7.4%) (0.0% of them are naturalized citizens)
:
7.4%
Whole state:
4.2%
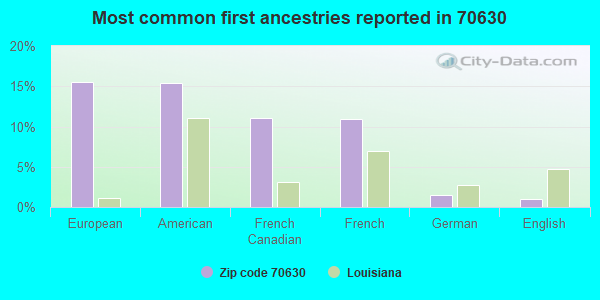
97%Honduras
16%European
15%American
11%French Canadian
11%French
1%German
1%English
Year of entry for the foreign-born population
02010 or later
02000 to 2009
1411990 to 1999
0Before 1990
Facilities with environmental interests located in this zip code:
BELL CITY HIGH SCHOOL (7161 HIGHWAY 14 EAST in BELL CITY, LA)
(Geographic Names Information System) (National Center for Education Statistics) - STATE ID-010004 Organizations: CALCASIEU PARISH SCHOOL BOARD (SCHOOL DISTRICT)
BELL CITY WATER SYSTEM (PO BOX 70 in BELL CITY, LA)
(Integrated Compliance Information System) - ICIS-06-2003-1226, FORMAL ENFORCEMENT ACTION,
FONTENOT #1 PRODUCTION FACILITY (1.25 SW OF in BELL CITY, LA)
AIR MINOR (AIRS/AFS) Business SIC classification: CRUDE PETROLEUM AND NATURAL GAS Alternative names: CLAYTON WMS FONTENOT, THERIOT #1 PROD FTY
Population in 1990: 1,365.
Place of birth for U.S.-born residents:
This state: 1,732
South: 66
West: 47
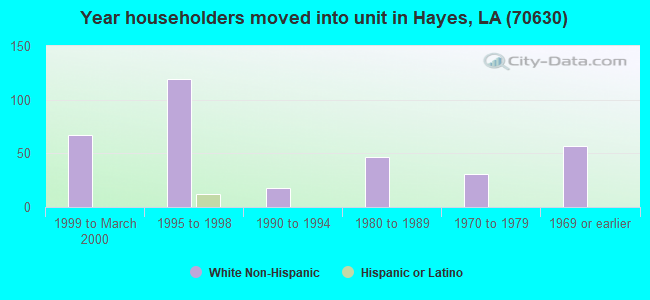
65% of the 70630 zip code residents lived in the same house 5 years ago. Out of people who lived in different houses, 66% lived in this county.
84% of the 70630 zip code residents lived in the same house 1 year ago. Out of people who lived in different houses, 92% moved from this county. Out of people who lived in different houses, 3% moved from different county within same state.
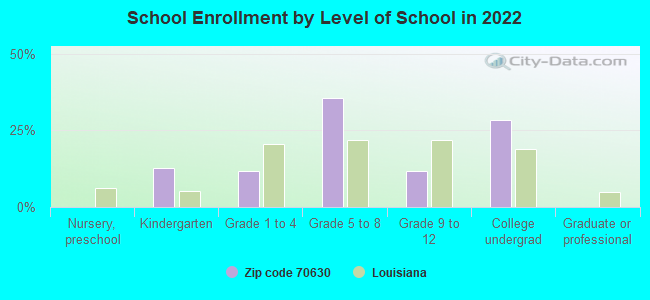
Private vs. public school enrollment:
Students in private schools in grades 1 to 8 (elementary and middle school):
Here:
0.0%
Louisiana:
19.6%
Students in private schools in grades 9 to 12 (high school):
Here:
0.0%
Louisiana:
18.3%
Students in private undergraduate colleges: 62
Here:
49.7%
Louisiana:
17.4%
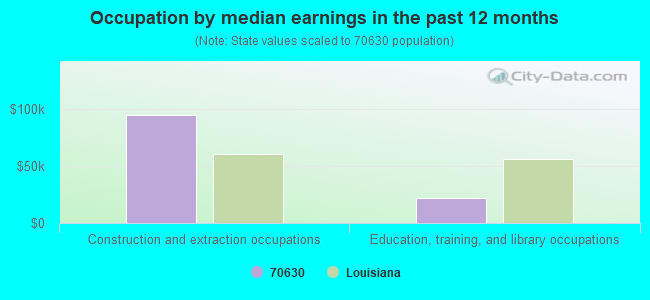
Occupation by median earnings in the past 12 months ($)
94,548Construction and extraction occupations
21,932Education, training, and library occupations
Top industries in this zip code by the number of employees in 2005:
Other Services (except Public Administration): Religious Organizations (5-9 employees: 1 establishment, 1-4 employees: 1 establishment)
Professional, Scientific, and Technical Services: Offices of Lawyers (1-4: 1)
Arts, Entertainment, and Recreation: All Other Amusement and Recreation Industries (1-4: 1)
Accommodation and Food Services: Caterers (1-4: 1)
Professional, Scientific, and Technical Services: Other Scientific and Technical Consulting Services (1-4: 1)
Fatal accident statistics in 2013:
Fatal accident count: 1
Vehicles involved in fatal accidents: 1
Fatal accidents caused by drunken drivers: 0
Fatalities: 1
Persons involved in fatal accidents: 1
Pedestrians involved in fatal accidents: 0
Home Mortgage Disclosure Act Aggregated Statistics For Year 2009 (Based on 2 partial tracts)
A) FHA, FSA/RHS & VA Home Purchase Loans
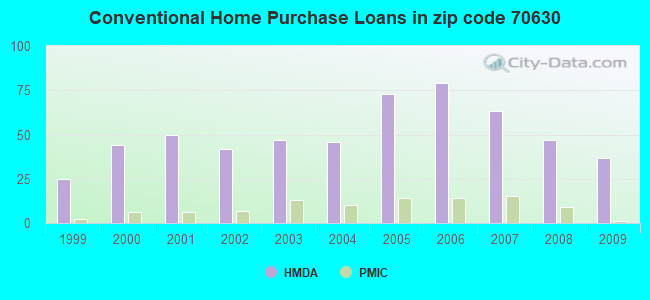
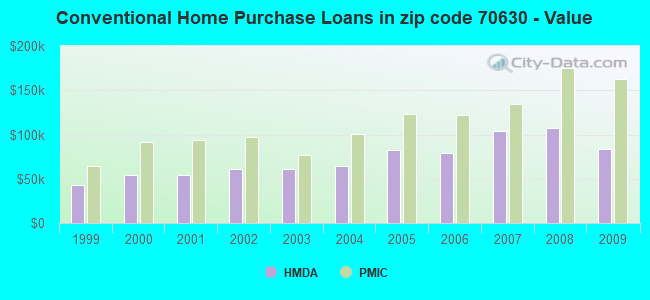
B) Conventional Home Purchase Loans
C) Refinancings
D) Home Improvement Loans
F) Non-occupant Loans on < 5 Family Dwellings (A B C & D)
G) Loans On Manufactured Home Dwelling (A B C & D)
Number
Average Value
Number
Average Value
Number
Average Value
Number
Average Value
Number
Average Value
Number
Average Value
LOANS ORIGINATED
25
$137,042
37
$83,626
77
$116,679
22
$49,406
14
$54,034
37
$38,502
APPLICATIONS APPROVED, NOT ACCEPTED
1
$217,680
7
$137,111
7
$113,816
0
$0
0
$0
9
$73,117
APPLICATIONS DENIED
9
$158,767
11
$109,458
34
$140,722
14
$17,652
1
$35,920
14
$39,820
APPLICATIONS WITHDRAWN
2
$96,265
4
$88,182
11
$154,260
1
$217,680
0
$0
1
$23,710
FILES CLOSED FOR INCOMPLETENESS
1
$137,210
1
$80,460
3
$124,523
1
$181,760
0
$0
1
$94,830
Aggregated Statistics For Year 2008 (Based on 2 partial tracts)
A) FHA, FSA/RHS & VA Home Purchase Loans
B) Conventional Home Purchase Loans
C) Refinancings
D) Home Improvement Loans
E) Loans on Dwellings For 5+ Families
F) Non-occupant Loans on < 5 Family Dwellings (A B C & D)
G) Loans On Manufactured Home Dwelling (A B C & D)
Number
Average Value
Number
Average Value
Number
Average Value
Number
Average Value
Number
Average Value
Number
Average Value
Number
Average Value
LOANS ORIGINATED
18
$126,358
47
$107,470
60
$139,753
16
$45,663
1
$144,400
4
$43,282
42
$49,091
APPLICATIONS APPROVED, NOT ACCEPTED
2
$73,995
23
$78,337
6
$125,720
3
$36,160
0
$0
1
$100,580
24
$63,578
APPLICATIONS DENIED
5
$125,002
43
$79,458
42
$101,294
18
$48,811
0
$0
0
$0
51
$59,247
APPLICATIONS WITHDRAWN
2
$108,120
4
$112,430
20
$132,114
2
$84,410
0
$0
0
$0
6
$64,775
FILES CLOSED FOR INCOMPLETENESS
1
$63,940
1
$129,310
6
$137,813
0
$0
0
$0
0
$0
1
$72,560
Aggregated Statistics For Year 2007 (Based on 2 partial tracts)
A) FHA, FSA/RHS & VA Home Purchase Loans
B) Conventional Home Purchase Loans
C) Refinancings
D) Home Improvement Loans
F) Non-occupant Loans on < 5 Family Dwellings (A B C & D)
G) Loans On Manufactured Home Dwelling (A B C & D)
Number
Average Value
Number
Average Value
Number
Average Value
Number
Average Value
Number
Average Value
Number
Average Value
LOANS ORIGINATED
9
$92,913
63
$103,723
63
$111,706
35
$34,627
4
$30,890
41
$45,101
APPLICATIONS APPROVED, NOT ACCEPTED
1
$80,460
17
$80,756
16
$86,118
2
$31,970
0
$0
14
$66,811
APPLICATIONS DENIED
1
$130,750
33
$85,816
45
$113,140
17
$54,134
1
$75,430
32
$55,317
APPLICATIONS WITHDRAWN
0
$0
4
$123,205
23
$99,295
4
$52,442
0
$0
3
$62,260
FILES CLOSED FOR INCOMPLETENESS
1
$47,410
3
$129,550
4
$79,742
0
$0
0
$0
0
$0
Aggregated Statistics For Year 2006 (Based on 2 partial tracts)
A) FHA, FSA/RHS & VA Home Purchase Loans
B) Conventional Home Purchase Loans
C) Refinancings
D) Home Improvement Loans
E) Loans on Dwellings For 5+ Families
F) Non-occupant Loans on < 5 Family Dwellings (A B C & D)
G) Loans On Manufactured Home Dwelling (A B C & D)
Number
Average Value
Number
Average Value
Number
Average Value
Number
Average Value
Number
Average Value
Number
Average Value
Number
Average Value
LOANS ORIGINATED
8
$87,914
79
$78,642
75
$90,882
37
$30,697
1
$233,480
14
$84,156
60
$48,576
APPLICATIONS APPROVED, NOT ACCEPTED
1
$116,380
19
$64,164
14
$81,333
8
$20,924
0
$0
0
$0
17
$48,725
APPLICATIONS DENIED
4
$66,272
50
$63,219
57
$75,709
19
$44,465
0
$0
5
$70,690
54
$45,073
APPLICATIONS WITHDRAWN
1
$154,460
1
$208,340
34
$111,922
1
$129,310
0
$0
0
$0
4
$69,325
FILES CLOSED FOR INCOMPLETENESS
0
$0
1
$289,520
9
$104,328
1
$17,960
0
$0
2
$99,140
0
$0
Aggregated Statistics For Year 2005 (Based on 2 partial tracts)
A) FHA, FSA/RHS & VA Home Purchase Loans
B) Conventional Home Purchase Loans
C) Refinancings
D) Home Improvement Loans
F) Non-occupant Loans on < 5 Family Dwellings (A B C & D)
G) Loans On Manufactured Home Dwelling (A B C & D)
Number
Average Value
Number
Average Value
Number
Average Value
Number
Average Value
Number
Average Value
Number
Average Value
LOANS ORIGINATED
13
$85,158
73
$82,941
63
$80,871
25
$22,069
10
$95,332
42
$39,273
APPLICATIONS APPROVED, NOT ACCEPTED
1
$58,910
21
$67,530
12
$80,401
5
$13,218
0
$0
19
$49,872
APPLICATIONS DENIED
4
$57,472
47
$52,260
67
$83,377
20
$33,046
1
$60,350
55
$48,329
APPLICATIONS WITHDRAWN
0
$0
4
$75,072
22
$90,682
5
$111,496
0
$0
4
$56,932
FILES CLOSED FOR INCOMPLETENESS
0
$0
6
$58,788
11
$105,278
0
$0
0
$0
0
$0
Aggregated Statistics For Year 2004 (Based on 2 partial tracts)
A) FHA, FSA/RHS & VA Home Purchase Loans
B) Conventional Home Purchase Loans
C) Refinancings
D) Home Improvement Loans
F) Non-occupant Loans on < 5 Family Dwellings (A B C & D)
G) Loans On Manufactured Home Dwelling (A B C & D)
Number
Average Value
Number
Average Value
Number
Average Value
Number
Average Value
Number
Average Value
Number
Average Value
LOANS ORIGINATED
4
$64,655
46
$64,781
80
$82,095
26
$31,637
4
$40,410
37
$35,474
APPLICATIONS APPROVED, NOT ACCEPTED
1
$46,700
9
$65,134
27
$77,427
7
$28,429
1
$10,780
11
$45,520
APPLICATIONS DENIED
1
$63,220
27
$51,884
80
$68,850
22
$24,393
1
$262,220
44
$47,365
APPLICATIONS WITHDRAWN
0
$0
2
$28,735
28
$105,066
2
$72,560
0
$0
6
$71,002
FILES CLOSED FOR INCOMPLETENESS
0
$0
3
$81,897
21
$94,726
0
$0
0
$0
0
$0
Aggregated Statistics For Year 2003 (Based on 2 partial tracts)
A) FHA, FSA/RHS & VA Home Purchase Loans
B) Conventional Home Purchase Loans
C) Refinancings
D) Home Improvement Loans
E) Loans on Dwellings For 5+ Families
F) Non-occupant Loans on < 5 Family Dwellings (A B C & D)
Number
Average Value
Number
Average Value
Number
Average Value
Number
Average Value
Number
Average Value
Number
Average Value
LOANS ORIGINATED
6
$73,637
47
$60,514
139
$80,471
34
$19,038
1
$126,440
8
$28,736
APPLICATIONS APPROVED, NOT ACCEPTED
3
$92,193
15
$37,165
24
$78,126
4
$26,400
0
$0
1
$121,410
APPLICATIONS DENIED
1
$58,190
36
$41,847
55
$79,011
17
$25,398
0
$0
5
$34,052
APPLICATIONS WITHDRAWN
0
$0
2
$37,000
28
$86,259
1
$10,780
0
$0
0
$0
FILES CLOSED FOR INCOMPLETENESS
0
$0
2
$81,540
2
$103,810
1
$81,180
0
$0
0
$0
Aggregated Statistics For Year 2002 (Based on 2 partial tracts)
A) FHA, FSA/RHS & VA Home Purchase Loans
B) Conventional Home Purchase Loans
C) Refinancings
D) Home Improvement Loans
F) Non-occupant Loans on < 5 Family Dwellings (A B C & D)
Number
Average Value
Number
Average Value
Number
Average Value
Number
Average Value
Number
Average Value
LOANS ORIGINATED
3
$105,127
42
$61,167
97
$70,729
34
$21,404
4
$46,158
APPLICATIONS APPROVED, NOT ACCEPTED
1
$24,430
18
$53,002
29
$69,809
5
$26,006
1
$21,550
APPLICATIONS DENIED
2
$57,830
39
$42,551
54
$65,414
9
$14,688
4
$26,222
APPLICATIONS WITHDRAWN
0
$0
6
$43,343
15
$65,327
2
$16,525
0
$0
FILES CLOSED FOR INCOMPLETENESS
1
$74,000
0
$0
4
$59,988
0
$0
1
$30,170
Aggregated Statistics For Year 2001 (Based on 2 partial tracts)
A) FHA, FSA/RHS & VA Home Purchase Loans
B) Conventional Home Purchase Loans
C) Refinancings
D) Home Improvement Loans
F) Non-occupant Loans on < 5 Family Dwellings (A B C & D)
Number
Average Value
Number
Average Value
Number
Average Value
Number
Average Value
Number
Average Value
LOANS ORIGINATED
1
$132,190
50
$54,239
84
$72,747
25
$13,592
5
$62,070
APPLICATIONS APPROVED, NOT ACCEPTED
1
$49,570
10
$35,345
22
$84,216
1
$67,530
1
$17,240
APPLICATIONS DENIED
1
$77,590
57
$41,982
51
$54,472
7
$21,039
3
$37,837
APPLICATIONS WITHDRAWN
1
$51,720
5
$45,546
32
$72,760
2
$68,250
1
$80,460
FILES CLOSED FOR INCOMPLETENESS
1
$14,370
1
$74,710
5
$66,812
0
$0
0
$0
Aggregated Statistics For Year 2000 (Based on 2 partial tracts)
A) FHA, FSA/RHS & VA Home Purchase Loans
B) Conventional Home Purchase Loans
C) Refinancings
D) Home Improvement Loans
F) Non-occupant Loans on < 5 Family Dwellings (A B C & D)
Number
Average Value
Number
Average Value
Number
Average Value
Number
Average Value
Number
Average Value
LOANS ORIGINATED
6
$72,318
44
$54,386
52
$62,749
15
$18,535
2
$57,470
APPLICATIONS APPROVED, NOT ACCEPTED
1
$30,170
17
$46,738
28
$54,393
6
$20,593
1
$32,330
APPLICATIONS DENIED
4
$45,618
74
$38,852
50
$52,515
13
$12,876
1
$36,640
APPLICATIONS WITHDRAWN
0
$0
6
$64,297
30
$57,185
1
$14,370
0
$0
FILES CLOSED FOR INCOMPLETENESS
1
$71,840
0
$0
1
$84,770
0
$0
0
$0
Aggregated Statistics For Year 1999 (Based on 1 partial tract)
A) FHA, FSA/RHS & VA Home Purchase Loans
B) Conventional Home Purchase Loans
C) Refinancings
D) Home Improvement Loans
F) Non-occupant Loans on < 5 Family Dwellings (A B C & D)


+$2,128
-$6,401
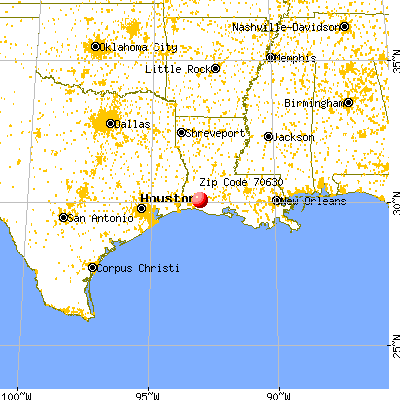
 Nearest zip codes: 70646, 70607, 70632, 70549, 70647, 70650.