Estimated zip code population in 2022: 33,115 Zip code population in 2010: 31,192 Zip code population in 2000: 27,158
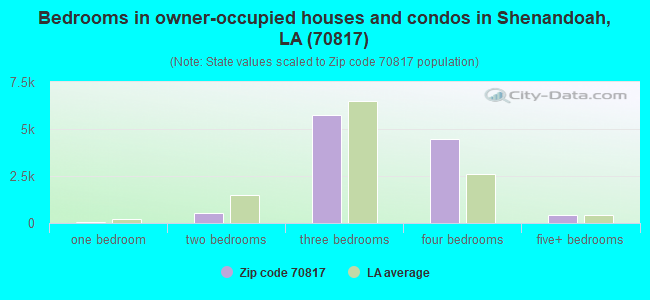
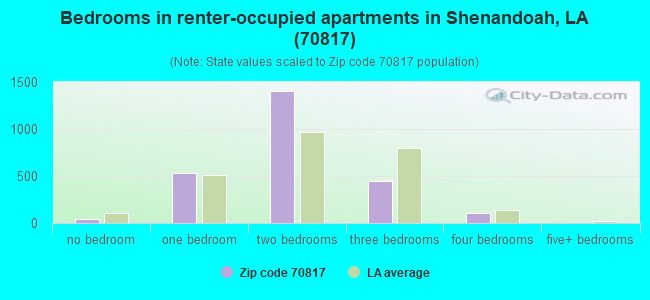
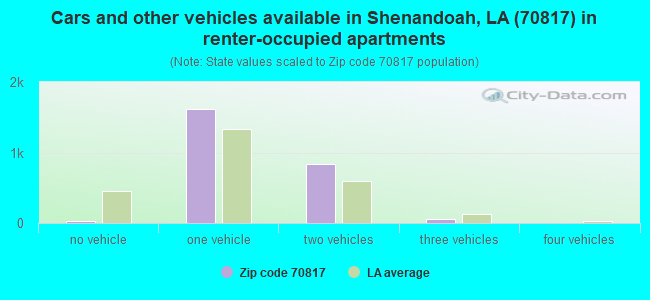
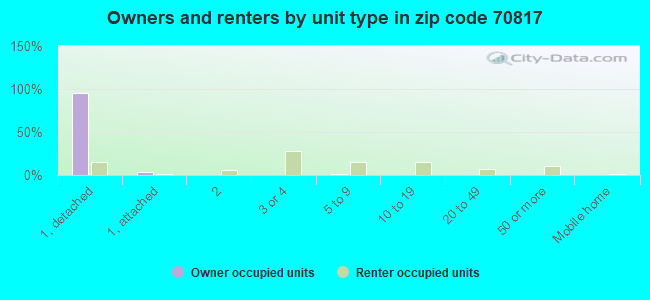
Houses and condos: 14,168 Renter-occupied apartments: 2,546
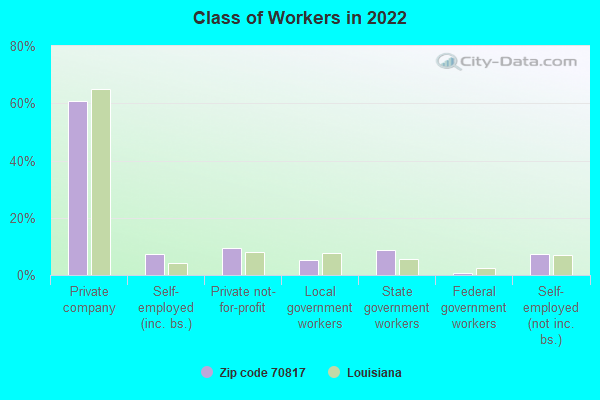
% of renters here:
19%
State:
32%
March 2022 cost of living index in zip code 70817: 89.9 (less than average, U.S. average is 100)
Land area: 25.7 sq. mi. Water area: 0.4 sq. mi.
Population density: 1,288 people per square mile
(low).
OSM Map
General Map
Google Map
MSN Map
OSM Map
General Map
Google Map
MSN Map
OSM Map
General Map
Google Map
MSN Map
OSM Map
General Map
Google Map
MSN Map
Please wait while loading the map...
Real estate property taxes paid for housing units in 2022:
This zip code:
0.6% ($1,891)
Louisiana:
0.5% ($1,127)
Median real estate property taxes paid for housing units with mortgages in 2022: $2,103 (0.7%) Median real estate property taxes paid for housing units with no mortgage in 2022: $1,649 (0.6%)
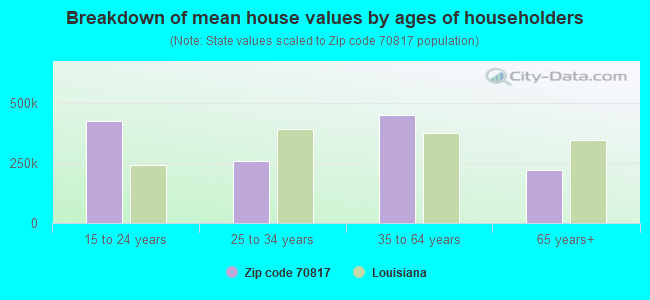
Estimated median house/condo value in 2022: $291,698
70817:
$291,698
Louisiana:
$209,200
According to our research of Louisiana and other state lists, there were 19 registered sex offenders living in 70817 zip code as of April 26, 2024. The ratio of all residents to sex offenders in zip code 70817 is 1,837 to 1. The ratio of registered sex offenders to all residents in this zip code is much lower than the state average.
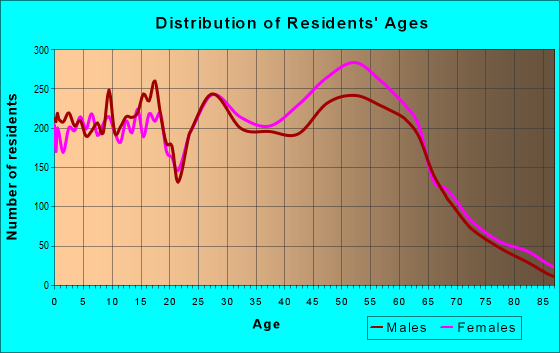
Median resident age:
This zip code:
40.6 years
Louisiana median age:
38.2 years
Average household size:
This zip code:
2.4 people
Louisiana:
2.5 people
Averages for the 2020 tax year for zip code 70817, filed in 2021:
Average Adjusted Gross Income (AGI) in 2020: $88,596 (Individual Income Tax Returns)
Here:
$88,596
State:
$60,757
Salary/wage: $72,805 (reported on 81.7% of returns)
Here:
$72,805
State:
$50,882
(% of AGI for various income ranges: 1138.1% for AGIs below $25k, 3532.5% for AGIs $25k-50k, 6564.2% for AGIs $50k-75k, 9416.8% for AGIs $75k-100k, 17418.6% for AGIs $100k-200k, 62134.1% for AGIs over 200k)
Taxable interest for individuals: $1,495 (reported on 35.9% of returns)
This zip code:
$1,495
Louisiana:
$1,576
(% of AGI for various income ranges: 18.2% for AGIs below $25k, 26.7% for AGIs $25k-50k, 45.1% for AGIs $50k-75k, 85.4% for AGIs $75k-100k, 137.6% for AGIs $100k-200k, 678.3% for AGIs over 200k)
Ordinary dividends: $5,730 (reported on 25.0% of returns)
Here:
$5,730
State:
$7,743
(% of AGI for various income ranges: 28.1% for AGIs below $25k, 44.6% for AGIs $25k-50k, 111.4% for AGIs $50k-75k, 199.1% for AGIs $75k-100k, 382.1% for AGIs $100k-200k, 2139.3% for AGIs over 200k)
Net capital gain/loss in AGI: +$18,066 (reported on 21.6% of returns)
Here:
+$18,066
State:
+$16,917
(% of AGI for various income ranges: 13.7% for AGIs below $25k, 27.0% for AGIs $25k-50k, 86.4% for AGIs $50k-75k, 172.9% for AGIs $75k-100k, 472.4% for AGIs $100k-200k, 11100.4% for AGIs over 200k)
Profit/loss from business: +$11,762 (reported on 20.1% of returns)
Here:
+$11,762
State:
+$7,679
(% of AGI for various income ranges: 110.6% for AGIs below $25k, 88.2% for AGIs $25k-50k, 173.4% for AGIs $50k-75k, 272.6% for AGIs $75k-100k, 631.5% for AGIs $100k-200k, 3184.8% for AGIs over 200k)
Taxable individual retirement arrangement distribution: $27,157 (reported on 11.3% of returns)
70817:
$27,157
Louisiana:
$20,716
(% of AGI for various income ranges: 57.9% for AGIs below $25k, 137.3% for AGIs $25k-50k, 266.0% for AGIs $50k-75k, 609.1% for AGIs $75k-100k, 1048.0% for AGIs $100k-200k, 2744.8% for AGIs over 200k)
Self-employed (Keogh) retirement plans: $25,255 (reported on 0.7% of returns)
70817:
$25,255
Louisiana:
$27,459
(% of AGI for various income ranges: 38.8% for AGIs $100k-200k, 431.7% for AGIs over 200k)
Total itemized deductions: $36,643 (reported on 10.7% of returns)
Here:
$36,643
State:
$36,265
(% of AGI for various income ranges: 62.9% for AGIs below $25k, 138.4% for AGIs $25k-50k, 331.0% for AGIs $50k-75k, 474.9% for AGIs $75k-100k, 902.7% for AGIs $100k-200k, 6538.3% for AGIs over 200k)
Charity contributions: $11,900 (reported on 8.8% of returns)
Here:
$11,900
State:
$13,106
(% of AGI for various income ranges: 4.9% for AGIs below $25k, 23.6% for AGIs $25k-50k, 74.5% for AGIs $50k-75k, 99.4% for AGIs $75k-100k, 283.0% for AGIs $100k-200k, 1838.0% for AGIs over 200k)
Taxes paid: $7,215 (reported on 10.5% of returns)
70817:
$7,215
State:
$6,643
(% of AGI for various income ranges: 6.3% for AGIs below $25k, 21.2% for AGIs $25k-50k, 65.6% for AGIs $50k-75k, 110.9% for AGIs $75k-100k, 232.1% for AGIs $100k-200k, 1046.3% for AGIs over 200k)
Earned income credit: $2,385 (reported on 12.6% of returns)
Here:
$2,385
State:
$2,671
(% of AGI for various income ranges: 103.1% for AGIs below $25k, 66.1% for AGIs $25k-50k, 0.9% for AGIs $50k-75k)
Percentage of individuals using paid preparers for their 2020 taxes: 91.8%
Here:
92%
State:
92%
(% for various income ranges: 90.2% for AGIs below $25k, 93.0% for AGIs $25k-50k, 91.7% for AGIs $50k-75k, 92.7% for AGIs $75k-100k, 92.3% for AGIs $100k-200k, 91.3% for AGIs over 200k)
Averages for the 2012 tax year for zip code 70817, filed in 2013:
Average Adjusted Gross Income (AGI) in 2012: $76,889 (Individual Income Tax Returns)
Here:
$76,889
State:
$56,730
Salary/wage: $64,044 (reported on 86.4% of returns)
Here:
$64,044
State:
$45,545
(% of AGI for various income ranges: 79.6% for AGIs below $25k, 78.5% for AGIs $25k-50k, 77.8% for AGIs $50k-75k, 77.4% for AGIs $75k-100k, 79.3% for AGIs $100k-200k, 54.3% for AGIs over 200k)
Taxable interest for individuals: $1,251 (reported on 39.9% of returns)
This zip code:
$1,251
Louisiana:
$1,804
(% of AGI for various income ranges: 1.3% for AGIs below $25k, 0.8% for AGIs $25k-50k, 0.6% for AGIs $50k-75k, 0.5% for AGIs $75k-100k, 0.5% for AGIs $100k-200k, 0.8% for AGIs over 200k)
Ordinary dividends: $4,631 (reported on 24.6% of returns)
Here:
$4,631
State:
$7,610
(% of AGI for various income ranges: 2.0% for AGIs below $25k, 1.2% for AGIs $25k-50k, 1.1% for AGIs $50k-75k, 0.9% for AGIs $75k-100k, 1.1% for AGIs $100k-200k, 2.4% for AGIs over 200k)
Net capital gain/loss in AGI: +$9,015 (reported on 19.3% of returns)
Here:
+$9,015
State:
+$17,096
(% of AGI for various income ranges: 0.5% for AGIs $25k-50k, 0.5% for AGIs $50k-75k, 1.0% for AGIs $75k-100k, 1.1% for AGIs $100k-200k, 6.0% for AGIs over 200k)
Profit/loss from business: +$15,897 (reported on 18.7% of returns)
Here:
+$15,897
State:
+$12,088
(% of AGI for various income ranges: 8.4% for AGIs below $25k, 3.5% for AGIs $25k-50k, 3.1% for AGIs $50k-75k, 3.2% for AGIs $75k-100k, 3.5% for AGIs $100k-200k, 4.3% for AGIs over 200k)
Taxable individual retirement arrangement distribution: $22,929 (reported on 10.3% of returns)
70817:
$22,929
Louisiana:
$16,085
(% of AGI for various income ranges: 3.2% for AGIs below $25k, 2.9% for AGIs $25k-50k, 2.9% for AGIs $50k-75k, 3.6% for AGIs $75k-100k, 2.8% for AGIs $100k-200k, 3.3% for AGIs over 200k)
Self-employment retirement plans: $19,067 (reported on 0.9% of returns)
70817:
$19,067
Louisiana:
$25,119
(% of AGI for various income ranges: 0.2% for AGIs $50k-75k, 0.2% for AGIs $100k-200k, 0.6% for AGIs over 200k)
Total itemized deductions: $21,800 (17% of AGI, reported on 40.3% of returns)
Here:
$21,800
State:
$23,585
Here:
16.9% of AGI
State:
18.1% of AGI
(% of AGI for various income ranges: 9.6% for AGIs below $25k, 11.2% for AGIs $25k-50k, 12.7% for AGIs $50k-75k, 12.8% for AGIs $75k-100k, 12.0% for AGIs $100k-200k, 10.0% for AGIs over 200k)
Charity contributions: $4,787 (reported on 33.2% of returns)
Here:
$4,787
State:
$5,533
(% of AGI for various income ranges: 0.8% for AGIs below $25k, 1.5% for AGIs $25k-50k, 1.8% for AGIs $50k-75k, 2.0% for AGIs $75k-100k, 2.3% for AGIs $100k-200k, 2.3% for AGIs over 200k)
Taxes paid: $6,532 (reported on 40.2% of returns)
70817:
$6,532
State:
$6,282
(% of AGI for various income ranges: 1.4% for AGIs below $25k, 1.9% for AGIs $25k-50k, 2.6% for AGIs $50k-75k, 3.0% for AGIs $75k-100k, 3.8% for AGIs $100k-200k, 4.3% for AGIs over 200k)
Earned income credit: $2,156 (reported on 11.9% of returns)
Here:
$2,156
State:
$2,633
(% of AGI for various income ranges: 5.9% for AGIs below $25k, 0.7% for AGIs $25k-50k)
Percentage of individuals using paid preparers for their 2012 taxes: 47.8%
Here:
48%
State:
57%
(% for various income ranges: 41.7% for AGIs below $25k, 46.1% for AGIs $25k-50k, 49.1% for AGIs $50k-75k, 49.7% for AGIs $75k-100k, 51.0% for AGIs $100k-200k, 68.6% for AGIs over 200k)
Averages for the 2004 tax year for zip code 70817, filed in 2005:
Average Adjusted Gross Income (AGI) in 2004: $60,360 (Individual Income Tax Returns)
Here:
$60,360
State:
$39,411
Salary/wage: $54,360 (reported on 88.8% of returns)
Here:
$54,360
State:
$34,434
(% of AGI for various income ranges: 174.1% for AGIs below $10k, 80.6% for AGIs $10k-25k, 83.3% for AGIs $25k-50k, 82.3% for AGIs $50k-75k, 85.9% for AGIs $75k-100k, 74.5% for AGIs over 100k)
Taxable interest for individuals: $1,334 (reported on 51.9% of returns)
This zip code:
$1,334
Louisiana:
$1,606
(% of AGI for various income ranges: 7.1% for AGIs below $10k, 2.1% for AGIs $10k-25k, 1.4% for AGIs $25k-50k, 1.1% for AGIs $50k-75k, 0.8% for AGIs $75k-100k, 1.1% for AGIs over 100k)
Taxable dividends: $2,454 (reported on 29.7% of returns)
Here:
$2,454
State:
$3,235
(% of AGI for various income ranges: 4.9% for AGIs below $10k, 1.3% for AGIs $10k-25k, 1.1% for AGIs $25k-50k, 1.0% for AGIs $50k-75k, 0.8% for AGIs $75k-100k, 1.4% for AGIs over 100k)
Net capital gain/loss: +$5,596 (reported on 23.3% of returns)
Here:
+$5,596
State:
+$8,531
(% of AGI for various income ranges: -3.0% for AGIs below $10k, 0.1% for AGIs $10k-25k, 0.4% for AGIs $25k-50k, 0.8% for AGIs $50k-75k, 1.3% for AGIs $75k-100k, 3.7% for AGIs over 100k)
Profit/loss from business: +$12,310 (reported on 16.8% of returns)
Here:
+$12,310
State:
+$9,128
(% of AGI for various income ranges: 4.4% for AGIs below $10k, 4.4% for AGIs $10k-25k, 3.1% for AGIs $25k-50k, 2.8% for AGIs $50k-75k, 3.0% for AGIs $75k-100k, 3.8% for AGIs over 100k)
IRA payment deduction: $3,308 (reported on 3.3% of returns)
70817:
$3,308
Louisiana:
$3,055
(% of AGI for various income ranges: 0.5% for AGIs below $10k, 0.2% for AGIs $10k-25k, 0.3% for AGIs $25k-50k, 0.2% for AGIs $50k-75k, 0.2% for AGIs $75k-100k, 0.1% for AGIs over 100k)
Self-employed pension: $14,819 (reported on 1.1% of returns)
Here:
$14,819
Louisiana:
$17,274
(% of AGI for various income ranges: 0.1% for AGIs $10k-25k, 0.1% for AGIs $50k-75k, 0.2% for AGIs $75k-100k, 0.5% for AGIs over 100k)
Total itemized deductions: $18,049 (19% of AGI, reported on 44.2% of returns)
Here:
$18,049
State:
$18,222
Here:
18.5% of AGI
State:
20.3% of AGI
(% of AGI for various income ranges: 16.3% for AGIs below $10k, 10.0% for AGIs $10k-25k, 13.8% for AGIs $25k-50k, 14.4% for AGIs $50k-75k, 14.2% for AGIs $75k-100k, 12.5% for AGIs over 100k)
Charity contributions deductions: $3,808 (4% of AGI, reported on 40.0% of returns)
Here:
$3,808
State:
$4,190
Here:
3.8% of AGI
State:
4.4% of AGI
(% of AGI for various income ranges: 1.0% for AGIs below $10k, 1.0% for AGIs $10k-25k, 1.9% for AGIs $25k-50k, 2.1% for AGIs $50k-75k, 2.5% for AGIs $75k-100k, 3.0% for AGIs over 100k)
Total tax: $9,569 (reported on 82.4% of returns)
70817:
$9,569
State:
$6,529
(% of AGI for various income ranges: 4.9% for AGIs below $10k, 4.4% for AGIs $10k-25k, 7.3% for AGIs $25k-50k, 9.1% for AGIs $50k-75k, 10.6% for AGIs $75k-100k, 17.8% for AGIs over 100k)
Earned income credit: $1,592 (reported on 8.4% of returns)
Here:
$1,592
State:
$2,103
Percentage of individuals using paid preparers for their 2004 taxes: 46.7%
Here:
47%
State:
61%
(% for various income ranges: 40.0% for AGIs below $10k, 47.7% for AGIs $10k-25k, 46.8% for AGIs $25k-50k, 48.2% for AGIs $50k-75k, 46.8% for AGIs $75k-100k, 51.5% for AGIs over 100k)
Likely homosexual households (counted as self-reported same-sex unmarried-partner households)
Lesbian couples: 0.0% of all households
Gay men: 0.1% of all households
Household received Food Stamps/SNAP in the past 12 months: 1,314 Household did not receive Food Stamps/SNAP in the past 12 months: 12,222
Women who had a birth in the past 12 months: 208 (195 now married, 5 unmarried) Women who did not have a birth in the past 12 months: 7,005 (3,170 now married, 3,815 unmarried)
Housing units in zip code 70817 with a mortgage: 6,845 (637 second mortgage, 68 home equity loan, 520 both second mortgage and home equity loan) Houses without a mortgage: 115
Median monthly owner costs for units with a mortgage: $1,799 Median monthly owner costs for units without a mortgage: $531
Residents with income below the poverty level in 2022:
This zip code:
7.7%
Whole state:
18.6%
Residents with income below 50% of the poverty level in 2022:
This zip code:
4.0%
Whole state:
10.1%
Median number of rooms in houses and condos:
Here:
6.6
State:
6.2
Median number of rooms in apartments:
Here:
4.0
State:
4.4
Notable locations in this zip code not listed on our city pages
Notable locations in zip code 70817: Briarwood Country Club (A), Shenandoah Country Club (B), Briarwood Golf Club (C), East Baton Rouge Parish Library Jones Creek Regional Branch (D), East Baton Rouge Parish Sheriff's Office (E), Saint George Fire Department Station 66 (F), Saint George Fire Department Station 64 (G), Saint George Fire Department Station 63 (H). Display/hide their locations on the map
Churches in zip code 70817 include: Most Blessed Sacrament Church (A), Gospel Light Baptist Church (B), Community of Christ Church (C), Christ Presbyterian Church (D), Abiding Hope Fellowship (E), Celebration of Christ Church (F), Saint Andrews Church (G), Covenant Presbyterian Church (H), Colonial Baptist Church (I). Display/hide their locations on the map
Cemeteries: Cann Cemetery (1), Woodlawn Baptist Cemetery (2), Hillman Cemetery (3), Richards Gardens of Memory Cemetery (4), Harelson Cemetery (5). Display/hide their locations on the map
Streams, rivers, and creeks: Boggy Cut Bayou (A), Clay Cut Bayou (B), Bayou Manchac (C), Weiner Creek (D), Knox Branch (E), Jones Creek (F), Jacks Bayou (G). Display/hide their locations on the map
Parks in zip code 70817 include: Barringer Road Park (1), Antioch Parish Park (2), Woodlawn Acres Parish Park (3), Airline Highway Parish Park (4), Manchac Parish Park (5). Display/hide their locations on the map
In group quarters: 126 (-1 institutionalized population)
Size of family households: 4,866 2-persons, 1,767 3-persons, 1,578 4-persons, 697 5-persons, 106 6-persons, 105 7-or-more-persons
Size of nonfamily households: 4,146 1-person, 424 2-persons, 6 4-persons
5,391 married couples with children.
1,541 single-parent households (400 men, 1,141 women).
92.4% of residents of 70817 zip code speak English at home.
1.6% of residents speak Spanish at home (50% very well, 44% well, 4% not well, 2% not at all).
1.8% of residents speak other Indo-European language at home (76% very well, 24% well).
2.3% of residents speak Asian or Pacific Island language at home (70% very well, 25% well, 6% not well).
2.2% of residents speak other language at home (66% very well, 22% well, 11% not well).
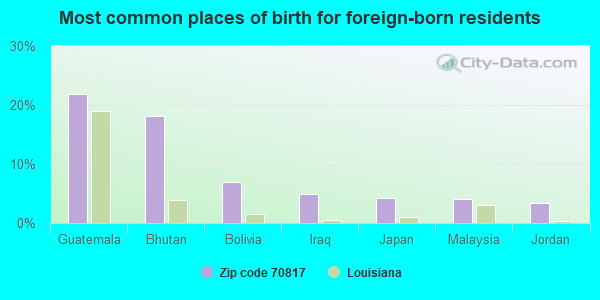
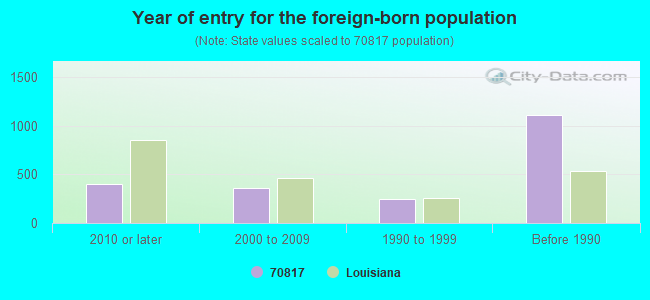
Foreign born population: 1,804 (5.4%) (77.9% of them are naturalized citizens)
This zip code:
5.4%
Whole state:
4.2%
22%Guatemala
18%Bhutan
7%Bolivia
5%Iraq
4%Japan
4%Malaysia
3%Jordan
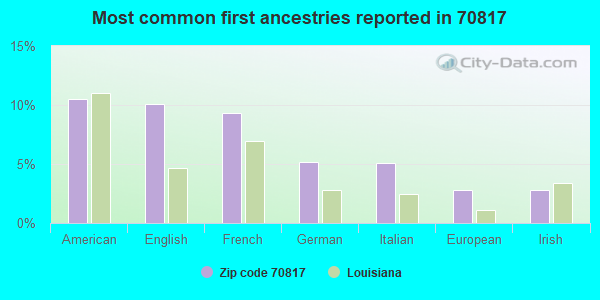
11%American
10%English
9%French
5%German
5%Italian
3%European
3%Irish
Year of entry for the foreign-born population
4032010 or later
3622000 to 2009
2421990 to 1999
1,112Before 1990
Major facilities with environmental interests located in this zip code:
BENGAL PRODUCTS INC (13739 AIRLINE HWY in BATON ROUGE, LA)
(Integrated Compliance Information System) - ICIS-06-1997-0655, FORMAL ENFORCEMENT ACTION COMPLIANCE ACTIVITY (Tracking inspections of insecticide, fungicide, and rodenticide, and toxic substances) STATE MASTER (New Jersey environmental info) - NJEMS-001527, PESTICIDES - MANUFACTURE (Resource Conservation and Recovery Act (tracking hazardous waste)) Business SIC classification: CYCLIC ORGANIC CRUDES AND INTERMEDIATES, AND ORGANIC DYES AND PIGMENTS; ELECTRONIC COMPONENTS; PETROLEUM AND PETROLEUM PRODUCTS WHOLESALERS, EXCEPT BULK STATIONS AND TERMINALS Alternative names: BENGAL CHEMICAL INC
BRIAN HARRIS BMW (12336 AIRLINE HIGHWAY in BATON ROUGE, LA)
AIR MINOR (AIRS/AFS) National Pollutant Discharge Elimination System NON-MAJOR (Tracking pollutant discharge elimination systems) - permit National Pollutant Discharge Elimination System NON-MAJOR (Tracking pollutant discharge elimination systems) - permit Business SIC classification: SEWERAGE SYSTEMS; GENERAL AUTOMOTIVE REPAIR SHOPS Alternative names: BRAIN HARRIS AUDI/PORSCHE, BRIAN HARRIS AUDI/PORSCHE, HARRIS CHEVROLET, HARRIS CHEVROLET, INC.
RANGE ROAD MOBILE HOME PARK WATER SYS (4809 JONES CREEK RD in BATON ROUGE, LA)
(Integrated Compliance Information System) - ICIS-06-2001-1285, FORMAL ENFORCEMENT ACTION Business SIC classification: WATER SUPPLY
AUTO MAGIC CAR WASH (5922 GREEN HERON COURT in BATON ROUGE, LA)
National Pollutant Discharge Elimination System NON-MAJOR (Tracking pollutant discharge elimination systems) - permit National Pollutant Discharge Elimination System NON-MAJOR (Tracking pollutant discharge elimination systems) - permit Business SIC classification: CARWASHES Alternative names: AUTO MAGIC CAR WASH-AUTO EXPRE, AUTO MAGIC CAR WASHES INC
PARETTI IMPORTS INCORPORATED (11977 AIRLINE HIGHWAY in BATON ROUGE, LA)
National Pollutant Discharge Elimination System NON-MAJOR (Tracking pollutant discharge elimination systems) - permit Conditionally Exempt Small Quantity Generators, less than 100 kg/month of hazardous waste (Resource Conservation and Recovery Act (tracking hazardous waste)) - notification Business SIC classification: SEWERAGE SYSTEMS Organizations: CRAIG A PARETTI (CONTACT/OWNER)
Alternative names: PARETTI JAGUAR OF BATON ROUGE
ENTEK ENVIRONMENTAL LAB. (14285 AIRLINE HWY in BATON ROUGE, LA)
National Pollutant Discharge Elimination System NON-MAJOR (Tracking pollutant discharge elimination systems) - permit Conditionally Exempt Small Quantity Generators, less than 100 kg/month of hazardous waste (Resource Conservation and Recovery Act (tracking hazardous waste)) - notification Business SIC classification: TESTING LABORATORIES Organizations: SHAM L SACHDEV (CONTACT/OWNER)
ARABIE TIRE & CAR CARE CENTER (15326 GEORGE ONEAL in BATON ROUGE, LA)
(Resource Conservation and Recovery Act (tracking hazardous waste)) Business NAICS classification: GENERAL AUTOMOTIVE REPAIR. Organizations: ARABIE RANDOLPH (CONTACT/OWNER)
HERCULES TRANSPORT INC (20269 HIGHLAND ROAD in BATON ROUGE, LA)
AIR MINOR (AIRS/AFS) Conditionally Exempt Small Quantity Generators, less than 100 kg/month of hazardous waste (Resource Conservation and Recovery Act (tracking hazardous waste)) - notification Business SIC classification: REFUSE SYSTEMS
BELL SOUTH TELECOMMUNICATIONS (13390 JEFFERSON HIGHWAY in BATON ROUGE, LA)
(Resource Conservation and Recovery Act (tracking hazardous waste)) Organizations: BELLSOUTH K3234 (CONTACT/OPERATOR)
, BELLSOUTH (CONTACT/OWNER)
Alternative names: BELL SOUTH TELECOMM-WOODLAWN C, BELLSOUTH K3234
A BEAR TIRE (13950 COURSEY BLVD in BATON ROUGE, LA)
(Resource Conservation and Recovery Act (tracking hazardous waste)) Business NAICS classification: TIRE RETREADING. Organizations: BCW INC (CONTACT/OWNER)
ABLE MOVING & STORAGE (15507 AIRLINE HWY in BATON ROUGE, LA)
(Resource Conservation and Recovery Act (tracking hazardous waste)) Organizations: ABLE MOVING & STORAGE, INC. (CONTACT/OWNER)
PLASTIC FUSION FABRICATOR INC (14918 JEFFERSON HWY in BATON ROUGE, LA)
(Resource Conservation and Recovery Act (tracking hazardous waste)) Organizations: DAVID HOLDER (CONTACT/OWNER)
B & O TRUCK EQUIPMENT (12636 AIRLINE HWY in BATON ROUGE, LA)
(Resource Conservation and Recovery Act (tracking hazardous waste)) Organizations: BILLY LETT (CONTACT/OWNER)
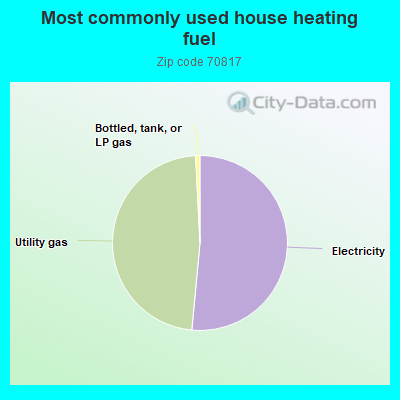
51.3%Electricity
47.5%Utility gas
0.8%Bottled, tank, or LP gas
Population in 1990: 20,916. Population change in the 1990s: +6,242 (+29.8%).
Place of birth for U.S.-born residents:
This state: 24,214
Northeast: 870
Midwest: 1,081
South: 4,045
West: 742
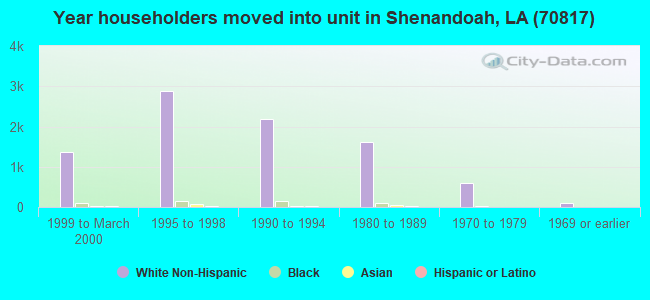
57% of the 70817 zip code residents lived in the same house 5 years ago. Out of people who lived in different houses, 68% lived in this county. Out of people who lived in different counties, 50% lived in Louisiana.
93% of the 70817 zip code residents lived in the same house 1 year ago. Out of people who lived in different houses, 62% moved from this county. Out of people who lived in different houses, 19% moved from different county within same state. Out of people who lived in different houses, 16% moved from different state. Out of people who lived in different houses, 5% moved from abroad.
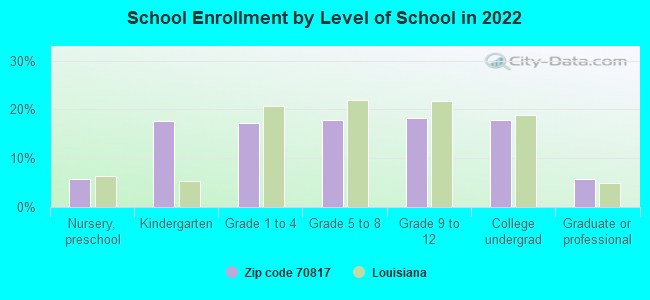
Private vs. public school enrollment:
Students in private schools in grades 1 to 8 (elementary and middle school): 1,032
Here:
35.0%
Louisiana:
19.6%
Students in private schools in grades 9 to 12 (high school): 667
Here:
43.6%
Louisiana:
18.3%
Students in private undergraduate colleges: 235
Here:
15.8%
Louisiana:
17.4%
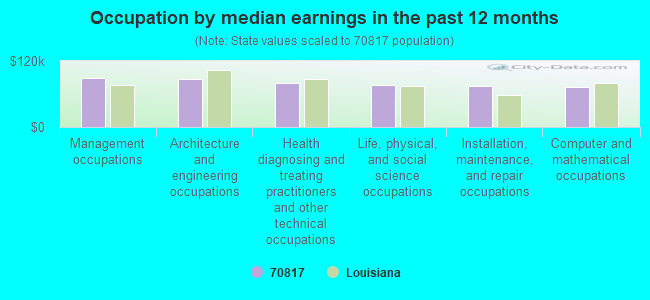
Occupation by median earnings in the past 12 months ($)
88,593Management occupations
86,606Architecture and engineering occupations
80,849Health diagnosing and treating practitioners and other technical occupations
77,062Life, physical, and social science occupations
74,101Installation, maintenance, and repair occupations
73,591Computer and mathematical occupations
Companies with biggest federal contracts located in this zip code (BATON ROUGE, LA):
CAJUN CONSTRUCTORS, INC (15635 AIRLINE HWY) : $82,412,280 in 120 contractsfrom 1999 to 2006
Contracts for Construction of Structures and Facilities -- Other Non-Building Facilities, Construction of Structures and Facilities -- Sewage and Waste Facilities, Construction of Structures and Facilities -- Other Conservation and Development Facilities by Army, U.S. Army Corps of Engineers - civil program financing only Signed by year:2000: $964,886; 2001: $0; 2002: $20,663,000; 2003: $5,064,275; 2004: $21,569,122; 2005: $25,490,339; 2006: $8,528,418.
Biggest contracts:
$23,942,000 with Army for Construction of Structures and Facilities -- Other Non-Building Facilities. Signed on 2005-11-01. Completion date: 2006-03-15.
$20,663,000 with Army for Construction of Structures and Facilities -- Sewage and Waste Facilities. Taking place in KS. Signed on 2002-09-30. Completion date: 2004-09-29.
$6,310,533 with Army for Construction of Structures and Facilities -- Other Non-Building Facilities. Signed on 2006-03-17. Completion date: 2006-05-10.
$2,500,000 with U.S. Army Corps of Engineers - civil program financing only for Construction of Structures and Facilities -- Sewage and Waste Facilities. Taking place in MS. Signed on 2003-04-04. Completion date: 2002-11-05.
PENSKE TRUCK LEASING CORPORATI (6890 PECUE LANE; small business) : $426,795 in 25 contractsfrom 2002 to 2006
Contracts for Trucks and Truck Tractors, Wheeled, Lease or Rental of Equipment -- Ground Effect Vehicles, Motor Vehicles, Trailers, and Cycles, Lease or Rental of Equipment -- Vehicular Equipment Components, Lease or Rental of Equipment -- Refrigeration, Air Conditioning, and Air Circulating Equipment, and moreby Federal Emergency Management Agency, Army Signed by year:2000: $0; 2001: $0; 2002: $8,820; 2003: $1,565; 2004: $21,070; 2005: $152,417; 2006: $242,923.
Biggest contracts:
$80,715 with Federal Emergency Management Agency for Trucks and Truck Tractors, Wheeled. Signed on 2006-02-22. Effective on 2005-10-22. Completion date: 2006-03-21.
$58,949, same as above.Signed on 2005-10-04. Effective on 2005-09-12. Completion date: 2005-12-10.
$53,280 with Federal Emergency Management Agency for Lease or Rental of Equipment -- Ground Effect Vehicles, Motor Vehicles, Trailers, and Cycles. Signed on 2006-03-28. Completion date: 2006-09-30.
$50,000 with Federal Emergency Management Agency for Trucks and Truck Tractors, Wheeled. Signed on 2006-06-26. Completion date: 2006-09-25.
XENETECH GLOBAL, INC. (12139 AIRLINE HIGHWAY; small business) : $325,089 in 24 contractsfrom 2002 to 2006
Contracts for Bending and Forming Machines, Milling Machines, Miscellaneous Special Industry Machinery, Office Furniture, and moreby Air Force, Army, Navy, Bureau of Prisoners/Federal Prison System, and others Signed by year:2000: $0; 2001: $0; 2002: $8,115; 2003: $70,928; 2004: $169,843; 2005: $31,913; 2006: $44,290.
Biggest contracts:
$44,861 with Air Force for Bending and Forming Machines. Signed on 2004-06-10. Completion date: 2004-06-30.
$37,163 with Army for Bending and Forming Machines. Signed on 2004-01-08. Completion date: 2004-02-06.
$31,582 with Navy for Bending and Forming Machines. Signed on 2003-03-19. Completion date: 2003-05-02.
$22,163 with Army for Bending and Forming Machines. Signed on 2004-09-20. Completion date: 2004-11-05.
GROUP CONTRACTORS, INC (15055 JEFFERSON HWY) : $319,393 in 6 contractsfrom 2000 to 2001
Contracts for Construction of Structures and Facilities -- Other Non-Building Facilities by U.S. Army Corps of Engineers - civil program financing only Signed by year:2000: $136,012; 2001: $183,381; 2002: $0; 2003: $0; 2004: $0; 2005: $0; 2006: $0.
Biggest contracts:
$340,000 with U.S. Army Corps of Engineers - civil program financing only for Construction of Structures and Facilities -- Other Non-Building Facilities. Signed on 2000-12-01. Completion date: 2002-04-25.
$88,888, same as above.Signed on 2001-03-14. Completion date: 2002-03-15.
$64,889, same as above.Signed on 2001-08-02. Completion date: 2002-08-02.
$29,604, same as above.Signed on 2001-05-24. Completion date: 2002-05-28.
RM CONTRACTORS OF BATON ROUGE, (5931 FORT CLARKE DR N; small business) : $100,800 in 4 contractsfrom 2005 to 2006
$36,800 with Army for Trucks and Truck Tractors, Wheeled. Signed on 2005-10-28. Completion date: 2005-11-28.
$32,000, same as above.Signed on 2005-12-05. Completion date: 2005-11-28.
$16,000, same as above.Signed on 2005-12-28. Completion date: 2005-11-28.
$16,000, same as above.Signed on 2006-01-18. Completion date: 2005-11-28.
GRANWOOD FLOOR CONSTRUCTORS, I (7355 ASSOCIATE DRIVE; small business)
$66,980 with Air Force for Miscellaneous Items. Signed on 2001-09-30. Completion date: 2001-11-16.
MATRIX CONSTRUCTION CO , INC (10630 OLD LODGE CT; small business) : $64,670 in 4 contractsfrom 2002 to 2004
$42,600 with Army for Maintenance, Repair or Alteration of Real Property -- Maintenance Buildings. Signed on 2002-09-30. Completion date: 2002-11-25.
$13,230 with Army for Construction of Structures and Facilities -- Parking Facilities Conservation. Signed on 2004-08-12. Completion date: 2004-09-26.
$7,679 with Army for Maintenance, Repair or Alteration of Real Property -- Highways, Roads, Streets, Bridges, and Railways (includes resurfacing). Signed on 2002-07-25. Completion date: 2002-08-30.
$1,161 with Army for Construction of Structures and Facilities -- Parking Facilities Conservation. Signed on 2004-09-01. Completion date: 2004-09-26.
B&T SERVICES, LLC (19026 VIGNES LAKE; small business) : $21,720 in 2 contractsin 2006
$15,520 with Army for Maintenance, Repair or Alteration of Real Property -- Office Buildings. Signed on 2006-03-10. Completion date: 2006-04-08.
$6,200, same as above.Signed on 2006-04-04. Completion date: 2006-04-08.
TOTAL ELECTRICAL SERVICES, INC (8270 ANTIOCH ROAD; small business)
$14,200 with Army for Maintenance, Repair or Alteration of Real Property -- Office Buildings. Signed on 2001-09-22. Completion date: 2001-10-22.
DEEP SOUTH COMPANY INC (15324 AIRLINE HWY; small business) : $9,650 in 3 contractsfrom 2005 to 2006
$5,000 with Army for Lease or Rental of Equipment -- Construction, Mining, Excavating, and Highway Maintenance Equipment. Taking place in TX. Signed on 2006-01-27. Completion date: 2006-02-28.
$3,120 with Army for Maintenance, Repair and Rebuilding of Equipment -- Miscellaneous. Taking place in TX. Signed on 2005-03-11. Completion date: 2005-03-08.
$1,530, same as above.Signed on 2005-08-01. Completion date: 2005-03-08.
Top industries in this zip code by the number of employees in 2005:
2002 - 2018 National Fire Incident Reporting System (NFIRS) incidents
Based on the data from the years 2002 - 2018 the average number of fires per year is 58. The highest number of fires - 97 took place in 2010, and the least - 0 in 2008. The data has a rising trend.
When looking into fire subcategories, the most incidents belonged to: Outside Fires (49.1%), and Structure Fires (32.7%).
Fire incident types reported to NFIRS in Zip Code 70817
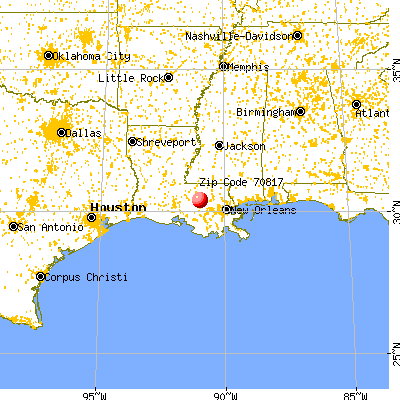


 Nearest zip codes: 70816, 70769, 70809, 70819, 70726, 70836.
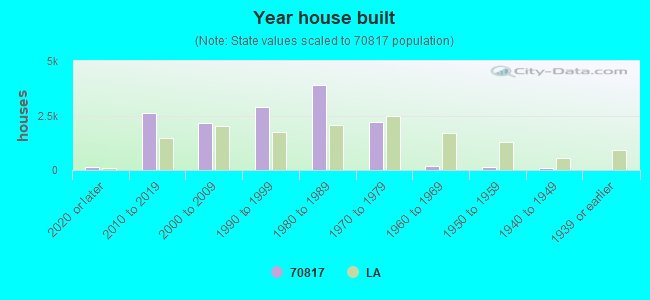


 Based on the data from the years 2002 - 2018 the average number of fires per year is 58. The highest number of fires - 97 took place in 2010, and the least - 0 in 2008. The data has a rising trend.
 When looking into fire subcategories, the most incidents belonged to: Outside Fires (49.1%), and Structure Fires (32.7%).